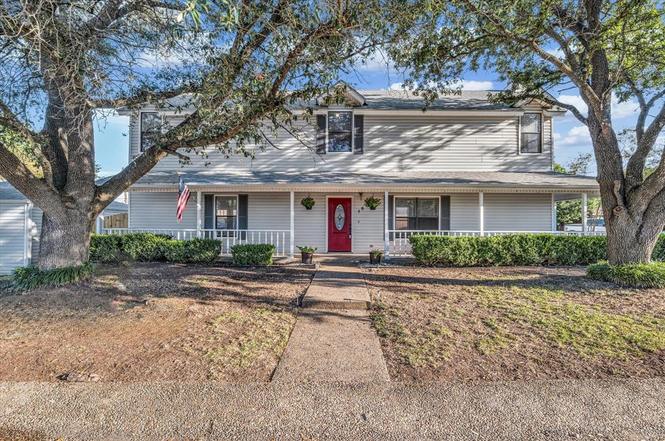
1300 Chapel Downs Rd · Waco, TX
Flood risk 1/10 · Minimal
- FEMA flood zone
- X (unshaded)
- Chance of flooding over 30 yrs
- 0.0%
- Est. flood insurance / yr
- $507 – $1,088
Fire risk 4/10 · Minor
- Est. fire insurance / yr
- $1,222 – $2,270
Heat risk 7/10 · Major
- Hot days now (above 108°F)
- 7 days/yr
- Hot days in 30 yrs
- 24 days/yr
Wind risk 6/10 · Moderate
- Chance of severe wind over 30 yrs
- 60.0%
Air-quality risk 2/10 · Minimal
- Unhealthy air days now
- 0 days/yr
- Unhealthy air days in 30 yrs
- 1 days/yr
Risk factors via First Street. Map © Google.
Why this score? — see what drove the D- grade
The composite is a weighted blend of 9 inputs, each scored 0–100. Each bar is that input's sub-score; the figure is the points it added to the 100-point composite (weight × sub-score).
- Cash flow +10.5/30.0
- ARV discount +7.5/15.0
- Schools +5.2/10.0
- 1% rule +4.6/10.0
- Livability +3.7/5.0
- DSCR +3.0/10.0
- Rent growth +2.7/5.0
- Condition / age +2.5/5.0
- Appreciation +0.0/10.0
$225,000
🖨 Deal sheet (PDF) 📄 Offer letter ✓ Due diligence
Listing remarks
Discover this charming 3 bedroom, 1.5 bath home offering the perfect blend of comfort, convenience, and low-maintenance living in a sought-after Midway ISD location. Step inside to fresh interior paint, updated flooring, and a bright, open-concept layout designed for both everyday living and effortless entertaining. The kitchen features ample counter space, generous cabinetry, and a seamless connection to the dining and living areas—ideal for today’s modern lifestyle. All three bedrooms are located upstairs, along with a split full bath that provides both privacy and functionality for family or guests. Downstairs, a convenient half bath and laundry area add to the home’s p
Key facts
- Ample counter space
- Generous storage
- Updated flooring
Tags
Property features AI
Finance
- Financial info: Accepts Cash, Conventional, FHA, and VA financing; No second mortgage indicated
- HOA & community: No association
Exterior
- Parking: 2 covered parking spaces; 2-car garage (garage faces rear) with garage door opener; On-street parking
- Security: Fire alarm; Smoke detectors
- Utilities: City water; City sewer; Electricity connected; Individual gas meter; Individual water meter; Cable available; Alley access; Asphalt roads; Curbs
- Home design: Single family residence; Residential property; Two levels; Not attached
- Construction: Asphalt roof; Siding exterior; Slab foundation; Built in 1983 (preowned)
- Exterior features: Gutters; Private yard; Wood fencing in back yard; Covered patio; Front porch; Wrap-around patio
Interior
- Kitchen: Dishwasher; Disposal; Electric oven; Electric range; Refrigerator; Ice maker; Plumbed for gas in kitchen; Water line to refrigerator; Dual sinks; Built-in cabinets
- Bedrooms: 3 bedrooms total; Primary bedroom on the 2nd level (approx. 15 x 12)
- Flooring: Carpet; Laminate
- Bathrooms: 1 full bathroom; 1 half bathroom
- Heating & cooling: Central heating (natural gas); Fireplace(s) for supplemental heat; Central air; Ceiling fans; Electric cooling; Roof turbine(s)
- Interior features: Cable TV available; High speed internet available; Cathedral ceilings; Vaulted ceilings; Kitchen island; Eat-in kitchen; 4 total rooms; 1 living area; 1 dining area
- Laundry & utility: Full-size washer/dryer area; Washer hookup; Washer and electric dryer hookups; Gas dryer hookup; Utility room; Gas water heater
Neighborhood map
What this means for you Summary
Snapshot
- This is a 3-bed/2.0-bath single-family listed at $225k.
Deal economics
- At list price, monthly cash flow is $-114 ($-1k/yr) — negative.
- To cash-flow at today's rent, offer at most $205k (9.0% below list).
- To meet the 1% rule (rent ≥ 1% of price), the offer needs to be $217k (3.5% below list).
- Recommended offer: $198k (12.0% below list) — sets the bar for market timing.
- Cap rate 5.7% vs local median 3.9% in Waco — top-decile yield for the area; either an underpriced asset or a hidden risk that comps aren't pricing in. Stress-test before assuming the spread holds.
Location & tenants
- Location reads 74/100 on livability (#166 in TX, #4,378 nationally) — a middle-class / working-renter tenant base. Strengths: cost of living A+, housing A+, health & safety A+; Watch: crime D, commute F, employment D-.
- Midway ISD (other): math 61% / reading 58% proficiency, ranked #56 of 826 in TX (top 7%) — acceptable for families but not a draw, mixed tenant base, ~2y average lease.
- Zoned schools: Chapel Park El (463 students, 40% FRL).
- Market conditions: Rents flat; 308 active listings in the ZIP; 8 comparable units currently listed for rent nearby; rentals at typical pace (median 22d on market — plan ~3-4 weeks tenant-placement turnaround); solid renter incomes; 1,014 units permitted in McLennan County in 2024 (200 in 5+ unit buildings).
Forward outlook
- Local home prices are declining (-3.0%/yr); year-one equity from $2k of loan paydown is wiped out by about $7k of value loss. Plan a longer hold.
- McLennan County population projected at +17% by 2050 — long-run rental-demand tailwind backs the buy-and-hold thesis.
Negotiation context
- It's been on market 246 days — a 12% lower offer ($198k) is reasonable based on typical stale-listing flexibility.
- 3 sale attempts; this cycle's ask has dropped $40k (15%) from the opening price — seller is motivated, your offer sets the floor, not the list.
Risks & watch-outs
- Watch-outs: property tax is 3.0% of price.
- Climate carrying-cost: major wind risk, 60% chance of damaging wind over 30y; extreme-heat days projected 7→24/yr by 2055 (HVAC capex compounding) — expect insurance premiums to compound above CPI over the hold.
Questions for the listing agent
- What do current leases actually rent for vs. the listed asking? Can we see a recent rent roll and the last 12 months of T-12 income?
- It's been on market 246 days. Have you received any prior offers? Is the seller open to a 12% concession, seller financing, or rate buy-down credit?
- Property tax is high relative to price — has the assessment been appealed recently, and will the sale trigger a re-assessment?
- Why hasn't it sold? Are there any deal-killer items the seller is aware of (foundation, flood, title, zoning, code violations)?
- Is there a deadline driving the sale (1031 exchange, divorce, estate, relocation)? That informs how much negotiation room exists.
- Schools are D-rated, which usually means shorter tenancies and higher turnover. Who's the typical renter profile here, and what's been the actual vacancy rate?
- Crime grade is D in this area — have there been break-ins, vandalism, or insurance claims at this property in the last 3 years? What carrier currently insures it and at what premium?
- The area grade is low — what's the realistic commute time and amenity access for the typical tenant pool here? Any planned neighborhood developments (good or bad) we should know about?
- What's the average days-on-market for RENTAL listings here right now (not sales)? A rising rental-DOM trend means longer vacancies and softer asking-rent achievability than the comps imply.
- What's the recent tenant-quality profile in this submarket — average credit score on applications, eviction rate, late-payment / NSF rate, and stable-employment percentage? A property-management company in the area should have these aggregated.
- How much new for-sale + rental construction is in the pipeline within 1–3 miles? Heavy new supply typically softens prices + rents 12–24 months out; constrained supply supports both.
Investment metrics
- 1% rule
- 0.96% ✗
- Cap rate
- 5.68%
- Cash-on-cash
- -2.18%
- DSCR
- 0.90
- GRM
- 8.6
CMA / ARV
No comps found within radius.
Projected returns pro-forma
-3.0% appreciation · 0.71% rent growth · sell at horizon
- IRR
- -22.9%
- Equity multiple
- 0.23×
- Total profit
- $-48,422
- Equity at exit
- $33,548
- IRR
- -26.2%
- Equity multiple
- -0.11×
- Total profit
- $-69,880
- Equity at exit
- $19,454
Cash invested: $63,000 (down + closing). Projections, not guarantees.
Landlord ↔ Tenant lean methodology
- Overall (STATE)
- 87 Strongly Landlord-Friendly
- State Texas
- 87 Strongly Landlord-Friendly · R+5
- County
- — inherits STATE
- City
- — inherits STATE
ZIP-level market 76712
- Home prices YoY
- -32.6%
- Rents YoY
- 0.7%
- Active inventory
- 308
- Price-to-rent
- 8.6×
Monthly cashflow live
- Estimated rent
- $2,171 high interval (Pro) →
- Mortgage (P&I)
- −$1,180
- Tax from tax record
- −$556 /mo · $6,667/yr
- Insurance
- −$94
- HOA
- −$0
- Vacancy / Maint / Mgmt
- −$456
- Net cashflow
- $-114
Break-even live
Sensitivity live
| Price | -10% $13 | -5% $-51 | +0% $-114 | +5% $-178 | +10% $-242 |
|---|---|---|---|---|---|
| Rent | -10% $-286 | -5% $-200 | +0% $-114 | +5% $-28 | +10% $57 |
| Rate | -1.0pp $-1 | -0.5pp $-57 | base $-114 | +0.5pp $-173 | +1.0pp $-232 |
UW: 25.0% down · 7.5% · 30yr · 1.5% tax · 5.0% vac · 8.0% maint · 8.0% mgmt
Financing live
Cash to close
- Down payment
- $56,250
- Closing costs
- $6,750
- Reserves months
- —
- Total cash needed
- —
Loan-product check · same deal, 3 products live
Conventional
25% down · 7.5% · 30yr
- Down + closing
- —
- Monthly P&I
- —
- Monthly cashflow
- —
- DSCR
- —
- Eligible?
- —
Personal DTI + credit; lowest rate.
DSCR
20% down · 8.5% · 30yr
- Down + closing
- —
- Monthly P&I
- —
- Monthly cashflow
- —
- DSCR
- —
- Eligible?
- —
No personal income docs; deal must DSCR.
Hard money
10% down · 12.0% · 12mo
- Down + closing
- —
- Monthly P&I
- —
- Monthly cashflow
- —
- DSCR
- —
- Eligible?
- —
Short-term bridge; refi at stabilization.
Rent comps 8 comps
| Address | Beds | Baths | Sqft | Rent | $/sqft | DOM | Units | Dist |
|---|---|---|---|---|---|---|---|---|
| 9720 Chapel Rd Waco, TX | 1.0–3.0 | 1.0–2.0 | 1059 | $2,300 | $2.17 | 14d | 93 | 0.33mi |
| 1800 Woodgate Dr Waco, TX | 1.0–3.0 | 1.0–2.0 | 1059 | $2,300 | $2.17 | 14d | 132 | 0.65mi |
| 9000 Chapel Rd Waco, TX | 1.0–3.0 | 1.0–2.0 | 922 | $1,900 | $2.06 | 14d | 6 | 0.83mi |
| 10312 Sierra West Dr Waco, TX | 3.0 | 2.0 | 1560 | $2,300 | $1.47 | 22d | 1 | 0.98mi |
| 2701 Skinner Dr Lorena, TX | 3.0 | 2.0 | 1573 | $2,400 | $1.53 | 44d | 1 | 1.11mi |
| 2813 Gilchrist Dr Lorena, TX | 3.0 | 2.0 | 1529 | $2,200 | $1.44 | 44d | 1 | 1.27mi |
| 2809 Keathley Dr Lorena, TX | 3.0 | 2.0 | 1565 | $2,100 | $1.34 | 44d | 1 | 1.33mi |
| 620 N Hewitt Dr Hewitt, TX | 1.0–2.0 | 1.0–1.5 | 897 | $1,325 | $1.48 | 14d | 15 | 1.38mi |
Listing history 17 events
-
2026-06-21days on market $225,000 Active 246 DOM
-
2026-06-18days on market $225,000 Active 244 DOM
-
2026-06-17days on market $225,000 Active 243 DOM
-
2026-06-16days on market $225,000 Active 242 DOM
-
2026-06-15days on market $225,000 Active 241 DOM
-
2026-06-15days on market $225,000 Active 240 DOM
-
2026-06-13days on market $225,000 Active 239 DOM
-
2026-06-12days on market $225,000 Active 238 DOM
-
2026-06-10days on market $225,000 Active 235 DOM
-
2026-06-08days on market $225,000 Active 234 DOM
-
2026-06-08days on market $225,000 Active 233 DOM
-
2026-06-07days on market $225,000 Active 232 DOM
-
2026-06-03days on market $225,000 Active 229 DOM
-
2026-06-02days on market $225,000 Active 228 DOM
-
2026-06-01days on market $225,000 Active 227 DOM
-
2026-05-31remarks 681-char remark
-
2026-05-31$225,000 Active 226 DOM
ⓘ Source: listings_history table (triggers on properties + properties_extension) + one-shot
backfill from property_details.listing_events for pre-trigger history.
Tax reassessment forecast TX · Resets to sale price
- Current annual tax
- $6,667 · $556/mo
- Projected year-2 tax
- $6,667 · $556/mo
- Expected delta
- $0/yr ($0/mo · 0.0%)
ⓘ Screening estimate from a state-policy table — verify with the county assessor before closing.
Climate risk First Street
- Flood 1/10 Low FEMA zone X (unshaded) · 0% chance over 30 yrs
- Wildfire 4/10 Moderate
- Heat 7/10 Severe 7 d/yr ≥108°F today · 24 d/yr by 30 yrs out
- Wind 6/10 Major 60% chance of damaging wind over 30 yrs
- Air quality 2/10 Low 0 unhealthy d/yr today · 1 by 30 yrs out
Nearby sold comps map
Loading sold comps map…
Walkable amenities ~0.75 mi
Loading nearby amenities…
Taxation est. · year 1
- Rental income
- $26,051
- − Mortgage interest
- −$12,603
- − Property taxes
- −$6,667
- − Insurance
- −$1,125
- − Repairs & maintenance
- −$2,084
- − Management
- −$2,084
- − Depreciation
- −$6,545
- Taxable loss
- −$5,058
- Est. tax savings @ 24.0%
- +$1,214
- After-tax cash flow
- $-157/yr
For passive investors: Depreciation is non-cash, so a rental often shows a tax loss while cash-flowing — sheltering income. Rental losses are passive: they offset passive income freely, and up to $25,000/yr can offset ordinary (W-2) income if you actively participate and your MAGI is under $100k (phasing out to $0 by $150k); unused losses carry forward. On sale, claimed depreciation is recaptured at up to 25%, and gains may owe capital-gains tax (a 1031 exchange can defer both). Figures are a year-1 estimate at your 24.0% rate — not tax advice; consult a CPA.
Schools (NCES district)
- District
- Midway ISD
- NCES district ID
- 4830640
- Math proficiency
- 61% ▼ -8.00%
- Reading proficiency
- 58% ▼ -7.00%
- Median HH income
- $67,076
- Composite
- 52.32/100
- National rank
- #1593
- State rank
- #56 of 826 in TX
Livability — Waco
- Score
- 74/100
- State rank
- #166
- US rank
- #4378
Category grades
Schools grade is shown separately in the Schools card above.
Census & demographics
- Census place
- Waco, TX
- County
- McLennan County · 213,088 people
- City population
- 125,319
- Metro
- Waco, TX
- Population (ZIP)
- 29,118
- Household income
- $97,903
- Rent vs Own
- Severe rent burden
- 847.0
Population outlook (McLennan County) Hauer SSP2
- Today (2025)
- 264,191 people
- By 2030
- 273,578 · +3.6%
- By 2040
- 291,506 · +10.3%
- By 2050
- 308,044 · +16.6%
- By 2075
- 349,648 · +32.3%
- By 2100
- 364,779 · +38.1%
Race, ethnicity, and origin ACS 2023
- Neighborhood character
- Predominantly White (72%)
- Race & ethnicity
- White 72% Hispanic / Latino 14% Two or more races 12% Black 7% Asian 2%
- Hispanic origin (detail)
- Mexican 11% Puerto Rican 1%
- Common ancestry
- Slovak 3% Italian 2% Iranian 2%
- Foreign-born
- 5% · Canada, China
- Languages at home
- 90% English-only · Spanish 6% Other Indo-European 1% German/W. Germanic 1%
Political lean MEDSL · McLennan
- 2024 margin
- Solid R (+30.9) · D 34.0% · R 64.9% · Other 1.0%
- 2008→2024 swing
- -7.0pp toward R · 2008: -23.9pp · 2024: -30.9pp
- All cycles
- 2024: R+30.9 2020: R+23.4 2016: R+27.1 2012: R+29.8 2008: R+23.9
Not yet ingested
- Civics
- —
Market trends
- HPI YoY
- ▼ -96.17%
- Current HPI
- 198.9025
- Rent YoY
- ▲ 0.71%
- Metro
- Waco, TX
- State GDP YoY
- ▲ 3.95%
- F500 in state
- 110
Industry mix (Fortune 500 HQ in TX)
| Industry | F500 HQs | Revenue |
|---|---|---|
| Energy | 16 | $1,198B |
|
||
| Technology | 5 | $198B |
|
||
| Engineering / Construction | 4 | $72B |
|
||
| Energy Services | 3 | $60B |
|
||
| Utilities | 3 | $41B |
|
||
| Healthcare | 2 | $330B |
|
||
Price history
-30.8% since first listed11 events — show timeline
- 2026-05-19 Price Changed $225,000 NTREIS
- 2026-03-20 Relisted — NTREIS
- 2026-03-11 Pending — NTREIS
- 2025-12-28 Price Changed $240,000 NTREIS
- 2025-11-10 Price Changed $249,900 NTREIS
- 2025-10-23 Price Changed $259,900 NTREIS
- 2025-10-08 Listed $265,000 NTREIS
- 2025-09-29 Listing Removed — NTREIS
- 2025-08-18 Price Changed $299,900 NTREIS
- 2025-07-16 Price Changed $315,000 NTREIS
- 2025-05-16 Listed $325,000 NTREIS
Property tax history
+5.9%/yrLatest (2025): $6,667 · +3.2% YoY. Source: county tax records.
Cash-flow waterfall
monthlySold comps — $/sqft
last 12 mo · ≤1 miLoading sold comps…