 Triplex
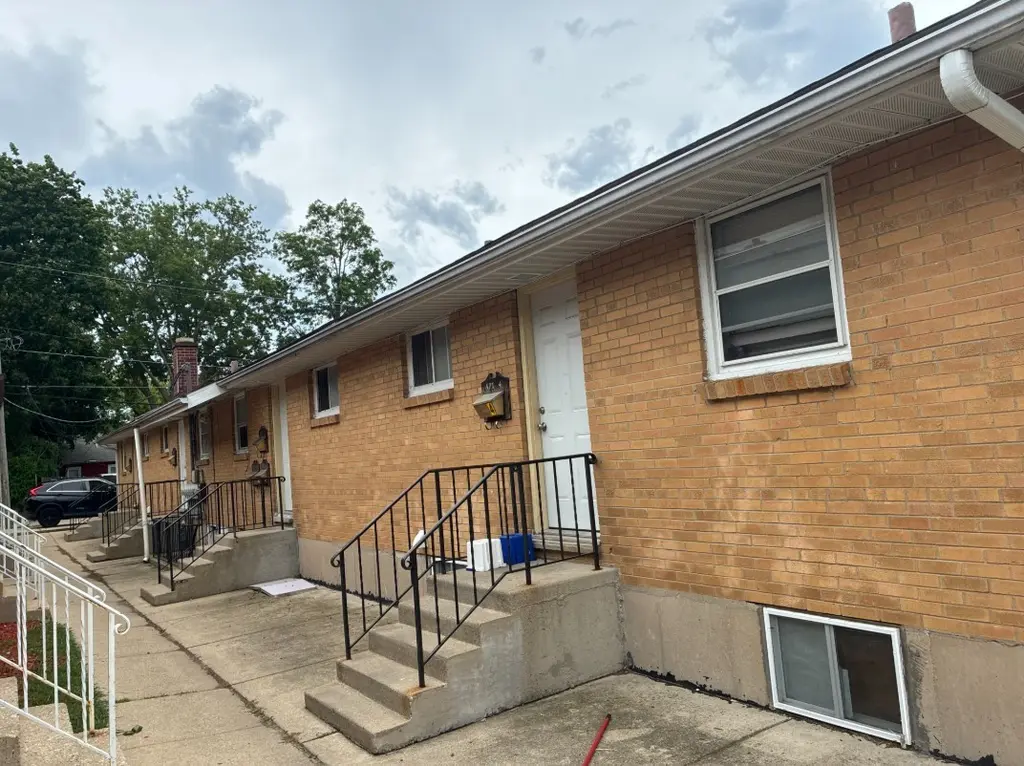
2717 Galilee Ave · Zion, IL
Flood risk 1/10 · Minimal
- FEMA flood zone
- X (unshaded)
- Chance of flooding over 30 yrs
- 0.0%
- Est. flood insurance / yr
- $507 – $1,088
Fire risk 2/10 · Minimal
- Est. fire insurance / yr
- $804 – $1,492
Heat risk 2/10 · Minimal
- Hot days now (above 95°F)
- 7 days/yr
- Hot days in 30 yrs
- 13 days/yr
Wind risk 2/10 · Minimal
- Chance of severe wind over 30 yrs
- —
Air-quality risk 3/10 · Minor
- Unhealthy air days now
- 3 days/yr
- Unhealthy air days in 30 yrs
- 4 days/yr
Risk factors via First Street. Map © Google.
Why this score? — see what drove the D grade
The composite is a weighted blend of 9 inputs, each scored 0–100. Each bar is that input's sub-score; the figure is the points it added to the 100-point composite (weight × sub-score).
- Cash flow +16.8/30.0
- ARV discount +7.5/15.0
- DSCR +5.2/10.0
- 1% rule +4.5/10.0
- Livability +3.6/5.0
- Rent growth +2.5/5.0
- Condition / age +2.5/5.0
- Schools +1.2/10.0
- Appreciation +0.0/10.0
$575,000
🖨 Deal sheet (PDF) 📄 Offer letter ✓ Due diligence
Multi-family units
County records classify this as Multi-Family (5+ Unit). Listing-text estimate: 3 units. estimate disagrees with records
5+ unit building — per-unit beds/baths from public records are typically unavailable; the breakdown below (if shown) is an estimate from the listing text.
Listing remarks MLS
Fantastic Investment Opportunity come see this renovated multi-nit building. Don't miss this well-maintained multi-unit property, perfect for expanding your rental portfolio. This building features four fully renovated units, each offering modern updates including brand-new kitchens with new appliances, vinyl plank flooring, bathtubs, vanities, and toilets. In addition, two partially updated basement units provide further rental income potential. Each unit has its own dedicated storage closet, adding convenience and value for tenants. Recent improvements throughout the building include new light fixtures, interior doors, updated hardware, and all-new plumbing. The roof was replaced approximately three years ago, several windows have been upgraded, and the basement has been professionally waterproofed, with all cracks and leaks repaired. Whether you're a seasoned investor or just getting started, this turnkey property is ready to generate strong cash flow from day one.
Key facts
- 6,672 sq ft lot
- Built 1958
- Listed 9 days
Property features AI
Finance
- Other: Annual tax information available (not included per instructions); Annual operating expense examples provided: water & sewer, electric, trash, insurance (specific amounts recorded in listing)
- Financial info: Total monthly income approximately $6,300; Gross annual income approximately $75,600; Gross rent multiplier about 7.92; Monthly rents by unit type approximate: several units at $1,000–$1,100 and others at $1,050–$1,100
Exterior
- Utilities: Electric service with circuit breakers
- Home design: Multi-family property with 6 units (Multi Family 5+)
- Construction: Built before 1978
- Exterior features: Lot dimensions roughly 48 x 139
Interior
- Kitchen: Ranges included (six total across property)
- Bedrooms: Combination of one- and two-bedroom units: four 1-bed units and two 2-bed units
- Bathrooms: All units feature full bathrooms
- Heating & cooling: Gas heating; Window air-conditioning units
- Interior features: Six ranges available (commercial-style equipment indicated across units)
- Laundry & utility: One washer and one dryer on site
Neighborhood map
What this means for you Summary
Snapshot
- This is a 3 × 3-bed/2.0-bath units multifamily listed at $575k.
Deal economics
- At list price, monthly cash flow is $367 ($4k/yr) — positive. Per door: $122/mo.
- The deal already cash-flows at list — no discount required.
- To meet the 1% rule (rent ≥ 1% of price), the offer needs to be $548k (4.7% below list).
- Recommended offer: $548k (4.7% below list) — sets the bar for 1% rule.
- Cap rate 7.1% vs local median 3.8% in Zion — top-decile yield for the area; either an underpriced asset or a hidden risk that comps aren't pricing in. Stress-test before assuming the spread holds.
Location & tenants
- Location reads 71/100 on livability (#353 in IL) — a middle-class / working-renter tenant base. Strengths: cost of living A+, housing A+, health & safety A+; Watch: crime C-, employment C-, commute D+.
- Zion-Benton Twp Hsd 126 (suburban): math 9% / reading 16% proficiency, ranked #531 of 620 in IL (top 86%) — low school quality limits family demand, transient renter base, plan for 1-2y turnover.
- Zoned schools: Zion Central Middle School (math 8% / reading 8%, grade F, #612 of 665 statewide, top 93%, 323 students, 0% FRL).
- Market conditions: 59 active listings in the ZIP; 948 units permitted in Lake County in 2024 (424 in 5+ unit buildings).
- At $5,480/mo this rent would consume 99% of the median local household income ($66k/yr) (locally 1009% of renters already pay >50% of income on rent) — very limited rent-growth headroom before tenants either downsize or default.
Forward outlook
- Local home prices are declining (-3.0%/yr); year-one equity from $4k of loan paydown is wiped out by about $17k of value loss. Plan a longer hold.
- Lake County population projected to shrink 8% by 2050 — rents likely to lag national; underwrite the cash flow, not the appreciation.
Negotiation context
- Only 9 days on market — expect competitive offers; lowballing is unlikely to land.
- 9 sale attempts since 9y ago; this cycle's ask is 47817% above the opening price — seller raised mid-cycle; expect resistance to lowballs.
- Current owner paid $425k; 35% above their basis — modest negotiation headroom, anchor on the comps not their cost.
Risks & watch-outs
- Watch-outs: built in 1958 — expect roof / HVAC / electrical / plumbing capex.
Questions for the listing agent
- Can we see the unit-by-unit rent roll, current vacancy, and any below-market leases? What's the average tenancy length?
- What capital expenditures (roof, boiler, parking lot, exteriors) have been made in the last 5 years, and what's planned in the next 2?
- Built in 1958 — when were the roof, HVAC, electrical panel, plumbing, and water heater last replaced?
- Is there a deadline driving the sale (1031 exchange, divorce, estate, relocation)? That informs how much negotiation room exists.
- Schools are F-rated, which usually means shorter tenancies and higher turnover. Who's the typical renter profile here, and what's been the actual vacancy rate?
- The area grade is low — what's the realistic commute time and amenity access for the typical tenant pool here? Any planned neighborhood developments (good or bad) we should know about?
- What's the average days-on-market for RENTAL listings here right now (not sales)? A rising rental-DOM trend means longer vacancies and softer asking-rent achievability than the comps imply.
- What's the recent tenant-quality profile in this submarket — average credit score on applications, eviction rate, late-payment / NSF rate, and stable-employment percentage? A property-management company in the area should have these aggregated.
- How much new apartment / multifamily construction is in the pipeline within 1–3 miles? Heavy new supply (>2% of stock underway) typically softens rents 12–24 months out; light construction supports rent growth.
Investment metrics
- 1% rule
- 0.95% ✗
- Cap rate
- 7.06%
- Cash-on-cash
- 2.73%
- DSCR
- 1.12
- GRM
- 8.7
CMA / ARV
No comps found within radius.
Projected returns pro-forma
-3.0% appreciation · 3.0% rent growth · sell at horizon
- IRR
- -12.0%
- Equity multiple
- 0.57×
- Total profit
- $-69,740
- Equity at exit
- $85,734
- IRR
- -2.8%
- Equity multiple
- 0.81×
- Total profit
- $-30,343
- Equity at exit
- $49,715
Cash invested: $161,000 (down + closing). Projections, not guarantees.
Landlord ↔ Tenant lean methodology
- Overall (STATE)
- 43 Moderately Tenant-Leaning
- State Illinois
- 43 Moderately Tenant-Leaning · D+7
- County
- — inherits STATE
- City
- — inherits STATE
ZIP-level market 60099
- Home prices YoY
- -32.5%
- Active inventory
- 59
- Price-to-rent
- 26.2×
Monthly cashflow live
- Estimated rent
- $5,480 high interval (Pro) →
- Mortgage (P&I)
- −$3,015
- Tax from tax record
- −$708 /mo · $8,490/yr
- Insurance
- −$240
- HOA
- −$0
- Vacancy / Maint / Mgmt
- −$1,151
- Net cashflow
- $367
Break-even live
Sensitivity live
| Price | -10% $692 | -5% $529 | +0% $367 | +5% $204 | +10% $41 |
|---|---|---|---|---|---|
| Rent | -10% $-66 | -5% $150 | +0% $367 | +5% $583 | +10% $800 |
| Rate | -1.0pp $656 | -0.5pp $513 | base $367 | +0.5pp $218 | +1.0pp $66 |
3-unit breakdown (identical units grouped — click to expand)
| Units | Beds | Baths | Est. rent |
|---|---|---|---|
| 3× units | 3 | 2 | $5,481 |
| #1 | 3 | 2 | $1,827 |
| #2 | 3 | 2 | $1,827 |
| #3 | 3 | 2 | $1,827 |
| Total (3 units) | $5,480 | ||
UW: 25.0% down · 7.5% · 30yr · 1.5% tax · 5.0% vac · 8.0% maint · 8.0% mgmt
Financing live
Cash to close
- Down payment
- $143,750
- Closing costs
- $17,250
- Reserves months
- —
- Total cash needed
- —
Loan-product check · same deal, 3 products live
Conventional
25% down · 7.5% · 30yr
- Down + closing
- —
- Monthly P&I
- —
- Monthly cashflow
- —
- DSCR
- —
- Eligible?
- —
Personal DTI + credit; lowest rate.
DSCR
20% down · 8.5% · 30yr
- Down + closing
- —
- Monthly P&I
- —
- Monthly cashflow
- —
- DSCR
- —
- Eligible?
- —
No personal income docs; deal must DSCR.
Hard money
10% down · 12.0% · 12mo
- Down + closing
- —
- Monthly P&I
- —
- Monthly cashflow
- —
- DSCR
- —
- Eligible?
- —
Short-term bridge; refi at stabilization.
Listing history 4 events
-
2026-06-21days on market $575,000 Active 9 DOM
-
2026-06-18days on market $575,000 Active 6 DOM
-
2026-06-17remarks 699-char remark
-
2026-06-17$575,000 Active 5 DOM
ⓘ Source: listings_history table (triggers on properties + properties_extension) + one-shot
backfill from property_details.listing_events for pre-trigger history.
Tax reassessment forecast IL · Partial reset (capped growth)
- Current annual tax
- $8,490 · $708/mo
- Projected year-2 tax
- $10,771 · $898/mo
- Expected delta
- +$2,281/yr (+$190/mo · 26.9%)
ⓘ Screening estimate from a state-policy table — verify with the county assessor before closing.
Climate risk First Street
- Flood 1/10 Low FEMA zone X (unshaded) · 0% chance over 30 yrs
- Wildfire 2/10 Low
- Heat 2/10 Low 7 d/yr ≥95°F today · 13 d/yr by 30 yrs out
- Wind 2/10 Low
- Air quality 3/10 Moderate 3 unhealthy d/yr today · 4 by 30 yrs out
Nearby sold comps map
Loading sold comps map…
Walkable amenities ~0.75 mi
Loading nearby amenities…
Taxation est. · year 1
- Rental income
- $65,760
- − Mortgage interest
- −$32,209
- − Property taxes
- −$8,490
- − Insurance
- −$2,875
- − Repairs & maintenance
- −$5,261
- − Management
- −$5,261
- − Depreciation
- −$16,727
- Taxable loss
- −$5,063
- Est. tax savings @ 24.0%
- +$1,215
- After-tax cash flow
- $5,616/yr
For passive investors: Depreciation is non-cash, so a rental often shows a tax loss while cash-flowing — sheltering income. Rental losses are passive: they offset passive income freely, and up to $25,000/yr can offset ordinary (W-2) income if you actively participate and your MAGI is under $100k (phasing out to $0 by $150k); unused losses carry forward. On sale, claimed depreciation is recaptured at up to 25%, and gains may owe capital-gains tax (a 1031 exchange can defer both). Figures are a year-1 estimate at your 24.0% rate — not tax advice; consult a CPA.
Schools (NCES district)
- District
- Zion-Benton Twp Hsd 126
- NCES district ID
- 1743890
- Math proficiency
- 9% ▼ -6.00%
- Reading proficiency
- 16% ▼ -8.00%
- Median HH income
- $56,473
- Composite
- 12.29/100
- National rank
- #9644
- State rank
- #531 of 620 in IL
Livability — Zion
- Score
- 71/100
- State rank
- #353
- US rank
- #7264
Category grades
Schools grade is shown separately in the Schools card above.
Census & demographics
- Census place
- Zion, IL
- County
- Lake County · 591,991 people
- City population
- 30,881
- Metro
- Chicago-Naperville-Elgin, IL-IN-WI
- Population (ZIP)
- 30,881
- Household income
- $66,109
- Rent vs Own
- Severe rent burden
- 1009.0
Population outlook (Lake County) Hauer SSP2
- Today (2025)
- 700,217 people
- By 2030
- 693,290 · -1.0%
- By 2040
- 673,588 · -3.8%
- By 2050
- 643,556 · -8.1%
- By 2075
- 562,792 · -19.6%
- By 2100
- 457,715 · -34.6%
Race, ethnicity, and origin ACS 2023
- Neighborhood character
- Diverse neighborhood (Simpson 0.70)
- Race & ethnicity
- Hispanic / Latino 40% White 29% Black 23% Two or more races 17% Asian 2% Native American 1%
- Hispanic origin (detail)
- Mexican 30% Puerto Rican 4% Dominican 2%
- Common ancestry
- Romanian 2% Lithuanian 2% Portuguese 1%
- Foreign-born
- 17% · Canada
- Languages at home
- 66% English-only · Spanish 30% Tagalog/Filipino 2%
Political lean MEDSL · Lake
- 2024 margin
- Strong D (+20.8) · D 59.7% · R 38.9% · Other 1.4%
- 2008→2024 swing
- +1.1pp toward D · 2008: 19.6pp · 2024: 20.8pp
- All cycles
- 2024: D+20.8 2020: D+24.1 2016: D+20.3 2012: D+8.1 2008: D+19.6
Not yet ingested
- Civics
- —
Market trends
- HPI YoY
- ▼ -106.90%
- Current HPI
- 222.3484
- Rent YoY
- —
- Metro
- Chicago-Naperville-Elgin, IL-IN-WI
- State GDP YoY
- ▲ 1.59%
- F500 in state
- 60
Industry mix (Fortune 500 HQ in IL)
| Industry | F500 HQs | Revenue |
|---|---|---|
| Insurance | 4 | $201B |
|
||
| Consumer Goods | 4 | $87B |
|
||
| Industrial Machinery | 3 | $64B |
|
||
| Healthcare | 2 | $55B |
|
||
| Retail / Pharmacy | 1 | $148B |
|
||
| Agriculture / Food | 1 | $86B |
|
||
Price history
-99.5% since first listed31 events — show timeline
- 2026-03-22 Rental Removed $1,150 RENTALBEAST
- 2026-03-14 Price Changed $1,150 RENTALBEAST
- 2026-02-28 Price Changed $1,100 RENTALBEAST
- 2026-02-15 Price Changed $1,150 RENTALBEAST
- 2026-01-20 Listed for Rent $1,200 RENTALBEAST
- 2026-01-09 Rental Removed $1,000 RENTALBEAST
- 2025-11-15 Price Changed $1,000 RENTALBEAST
- 2025-10-21 Listed for Rent $1,100 RENTALBEAST
- 2025-08-13 Sold (Public Records) $425,000 Public Records
- 2025-07-31 Sold (MLS) $425,000 MRED as Distributed by MLS Grid
- 2025-05-28 Contingent — MRED as Distributed by MLS Grid
- 2025-04-24 Listed $465,000 MRED as Distributed by MLS Grid
- 2023-12-19 Sold (MLS) $320,000 MRED as Distributed by MLS Grid
- 2023-11-13 Pending — MRED as Distributed by MLS Grid
- 2023-10-27 Relisted — MRED as Distributed by MLS Grid
- 2023-10-03 Contingent — MRED as Distributed by MLS Grid
- 2023-09-19 Listed $349,900 MRED as Distributed by MLS Grid
- 2023-05-20 Pending — MRED as Distributed by MLS Grid
- 2023-05-19 Listing Removed — MRED as Distributed by MLS Grid
- 2023-05-17 Price Changed — MRED as Distributed by MLS Grid
- 2023-05-09 Relisted — MRED as Distributed by MLS Grid
- 2023-02-08 Pending — MRED as Distributed by MLS Grid
- 2023-01-31 Relisted — MRED as Distributed by MLS Grid
- 2023-01-07 Pending — MRED as Distributed by MLS Grid
- 2022-12-07 Listed — MRED as Distributed by MLS Grid
- 2017-10-23 Listing Removed — MRED as Distributed by MLS Grid
- 2017-07-10 Price Changed — MRED as Distributed by MLS Grid
- 2017-06-24 Price Changed — MRED as Distributed by MLS Grid
- 2017-05-25 Price Changed — MRED as Distributed by MLS Grid
- 2017-05-15 Listed — MRED as Distributed by MLS Grid
- 2005-09-12 Sold (Public Records) $230,000 Public Records
Property tax history
+0.5%/yrLatest (2024): $8,490 · +7.9% YoY. Source: county tax records.
Cash-flow waterfall
monthlySold comps — $/sqft
last 12 mo · ≤1 miLoading sold comps…