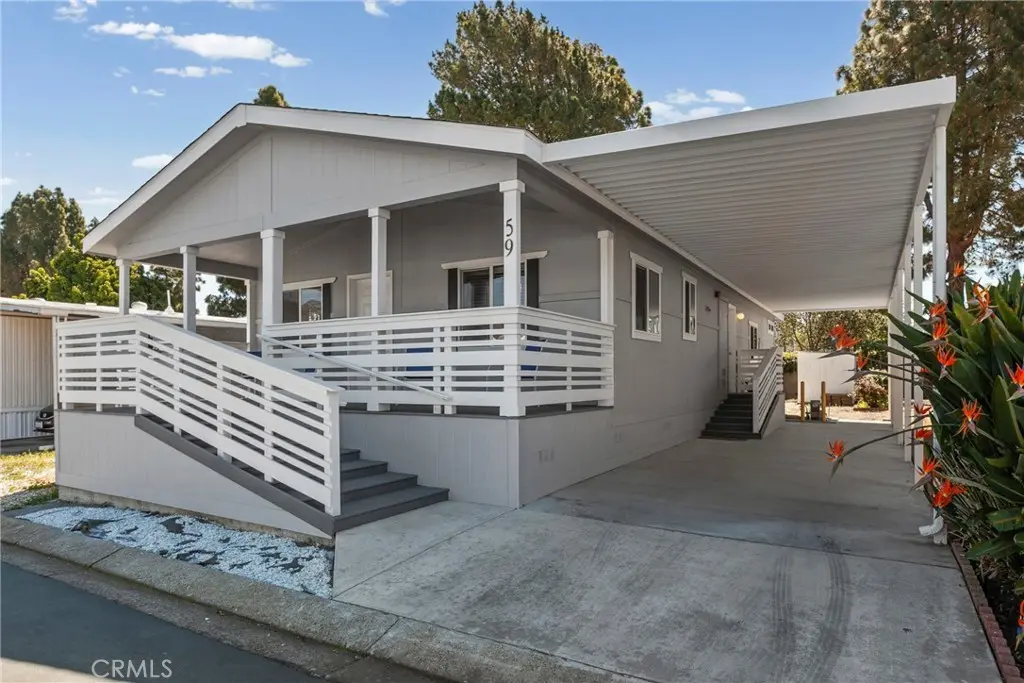
3395 S Higuera St #59 · San Luis Obispo, CA
Flood risk 6/10 · Moderate
- FEMA flood zone
- X (unshaded)
- Chance of flooding over 30 yrs
- 0.68%
- Est. flood insurance / yr
- $507 – $1,088
Fire risk 6/10 · Moderate
- Est. fire insurance / yr
- $659 – $1,223
Heat risk 4/10 · Minor
- Hot days now (above 82°F)
- 4 days/yr
- Hot days in 30 yrs
- 10 days/yr
Wind risk 1/10 · Minimal
- Chance of severe wind over 30 yrs
- —
Air-quality risk 6/10 · Moderate
- Unhealthy air days now
- 11 days/yr
- Unhealthy air days in 30 yrs
- 11 days/yr
Risk factors via First Street. Map © Google.
Why this score? — see what drove the D grade
The composite is a weighted blend of 9 inputs, each scored 0–100. Each bar is that input's sub-score; the figure is the points it added to the 100-point composite (weight × sub-score).
- Cash flow +11.6/30.0
- ARV discount +7.5/15.0
- Condition / age +4.8/5.0
- Schools +4.6/10.0
- Livability +3.7/5.0
- Rent growth +3.6/5.0
- 1% rule +3.4/10.0
- DSCR +3.4/10.0
- Appreciation +0.0/10.0
$414,000
🖨 Deal sheet (PDF) 📄 Offer letter ✓ Due diligence
Listing remarks MLS
Situated in Rancho San Luis Mobile Home Estates, a desirable 55+ community, this brand-new Silvercrest home offers an exceptional blend of comfort and elegance, with access to amenities including a pool, spa, and billiards room. Lightly lived in and in pristine condition, this home features 2 bedrooms and 1¾ bathrooms, along with a versatile bonus room that can be used as a home office or additional living space. The primary suite includes a dual vanity and walk-in shower. The kitchen is equipped with all-new stainless steel appliances and soft close cupboards and drawers. An oversized covered deck with low rise steps up the staircase adds an additional 189 square feet of outdoor living space, perfect for relaxing and viewing Southhills. Recent upgrades include new plumbing, professional leveling, and a brand-new concrete driveway. Space rent of $964.35 includes water, sewer, trash, and common areas. This home is truly move-in ready, offering a perfect blend of modern convenience and tranquil community living.
Key facts
- Spa
- Dual vanity
- Bonus room
Tags
Neighborhood map
What this means for you Summary
Snapshot
- This is a 2-bed/2.0-bath manufactured listed at $414k. Condition is rated excellent.
Deal economics
- At list price, monthly cash flow is $-125 ($-2k/yr) — negative.
- To cash-flow at today's rent, offer at most $396k (4.4% below list).
- To meet the 1% rule (rent ≥ 1% of price), the offer needs to be $346k (16.4% below list).
- Recommended offer: $346k (16.4% below list) — sets the bar for 1% rule.
- Cap rate 5.9% vs local median 2.1% in San Luis Obispo — top-decile yield for the area; either an underpriced asset or a hidden risk that comps aren't pricing in. Stress-test before assuming the spread holds.
Location & tenants
- Location reads 74/100 on livability (#132 in CA, #4,576 nationally) — a middle-class / working-renter tenant base. Strengths: amenities A+, commute A+, health & safety A+; Watch: crime F, cost of living F.
- San Luis Coastal Unified (urban): math 50% / reading 58% proficiency, ranked #118 of 517 in CA (top 23%) — acceptable for families but not a draw, mixed tenant base, ~2y average lease.
- Zoned schools: Pacheco Elementary (math 34% / reading 41%, grade F, #667 of 1,571 statewide, top 43%, 482 students, 36% FRL); Laguna Middle (math 57% / reading 65%, grade B+, #57 of 498 statewide, top 12%, 789 students, 30% FRL); San Luis Obispo High (math 47% / reading 67%, grade C, #234 of 1,170 statewide, top 21%, 1,644 students, 27% FRL) — zoned schools at 31% FRL track the district average.
- Market conditions: Rents rising fast (+4.4%/yr); 140 active listings in the ZIP; 7 comparable units currently listed for rent nearby; rentals at typical pace (median 23d on market — plan ~3-4 weeks tenant-placement turnaround); 43% of comp listings sitting > 30 days — soft ceiling on asking rent; solid renter incomes; 1,104 units permitted in San Luis Obispo County in 2024 (273 in 5+ unit buildings).
- This rent runs 43% of the median local income ($97k/yr) — at the standard rent-burdened threshold; future hikes will face affordability resistance.
Forward outlook
- Local home prices are declining (-3.0%/yr); year-one equity from $3k of loan paydown is wiped out by about $12k of value loss. Plan a longer hold.
- San Luis Obispo County population projected at +20% by 2050 — long-run rental-demand tailwind backs the buy-and-hold thesis.
Negotiation context
- It's been on market 94 days — a 9% lower offer ($377k) is reasonable based on typical stale-listing flexibility.
Risks & watch-outs
- Climate carrying-cost: major flood risk; major wildfire risk — expect insurance premiums to compound above CPI over the hold.
Questions for the listing agent
- What do current leases actually rent for vs. the listed asking? Can we see a recent rent roll and the last 12 months of T-12 income?
- It's been on market 94 days. Have you received any prior offers? Is the seller open to a 16% concession, seller financing, or rate buy-down credit?
- Why hasn't it sold? Are there any deal-killer items the seller is aware of (foundation, flood, title, zoning, code violations)?
- Is there a deadline driving the sale (1031 exchange, divorce, estate, relocation)? That informs how much negotiation room exists.
- Schools are B-rated — typically a magnet for longer-tenancy family renters. What's the average tenant stay here, and is there a school-zone premium baked into asking?
- Crime grade is F in this area — have there been break-ins, vandalism, or insurance claims at this property in the last 3 years? What carrier currently insures it and at what premium?
- The area grade is low — what's the realistic commute time and amenity access for the typical tenant pool here? Any planned neighborhood developments (good or bad) we should know about?
- What's the average days-on-market for RENTAL listings here right now (not sales)? A rising rental-DOM trend means longer vacancies and softer asking-rent achievability than the comps imply.
- What's the recent tenant-quality profile in this submarket — average credit score on applications, eviction rate, late-payment / NSF rate, and stable-employment percentage? A property-management company in the area should have these aggregated.
- How much new for-sale + rental construction is in the pipeline within 1–3 miles? Heavy new supply typically softens prices + rents 12–24 months out; constrained supply supports both.
Investment metrics
- 1% rule
- 0.84% ✗
- Cap rate
- 5.93%
- Cash-on-cash
- -1.30%
- DSCR
- 0.94
- GRM
- 10.0
CMA / ARV
- ARV (median comp)
- $245,660
- List price
- $414,000
- Delta
- 68.53%
- Verdict
- OVERPRICED
- Comps
- 15 within 1.0 mi
Show comp detail 12 sales within ~0.75 mi
| Address | Dist | Beds/Ba | Sqft | Sold | Price | $/sf | Match |
|---|---|---|---|---|---|---|---|
| 3860 S Higuera St #217 | 0.53mi | 2/2.0 | 1,200 (+1%) | 1mo | $290,000 | $242 | 72 |
| 3057 S Higuera St #41 | 0.28mi | 3/2.0 (+1) | 1,120 (-5%) | 15mo | $400,000 | $357 | 61 |
| 3860 S Higuera Unit D23 | 0.56mi | 2/2.0 | 1,095 (-7%) | 3mo | $265,000 | $242 | 58 |
| 3057 Higuera S #123 | 0.34mi | 3/2.0 (+1) | 1,120 (-5%) | 16mo | $450,000 | $402 | 57 |
| 3960 S Higuera #117 | 0.67mi | 2/2.0 | 1,152 (-3%) | 12mo | $230,000 | $200 | 54 |
| 3960 S Higuera #105 | 0.71mi | 2/2.0 | 1,152 (-3%) | 10mo | $249,000 | $216 | 54 |
| 3960 S Higuera St #196 | 0.67mi | 2/2.0 | 1,200 (+1%) | 15mo | $234,000 | $195 | 54 |
| 3057 S Higuera St #43 | 0.28mi | 2/2.0 | 1,356 (+15%) | 16mo | $260,000 | $192 | 49 |
| 3057 south higuera St #32 | 0.27mi | 3/2.0 (+1) | 1,320 (+12%) | 20mo | $465,000 | $352 | 47 |
| 3960 Higuera S #14 | 0.67mi | 2/2.0 | 1,040 (-12%) | 5mo | $335,500 | $323 | 44 |
| 3860 S Higuera St #194 | 0.56mi | 3/2.0 (+1) | 1,352 (+14%) | 16mo | $280,000 | $207 | 32 |
| 3960 Higuera S #1 | 0.67mi | 2/2.0 | 1,344 (+14%) | 20mo | $220,000 | $164 | 30 |
Match score weights: distance 35% · size 25% · config 20% · recency 20%. Top-matched comps best support the ARV.
Projected returns pro-forma
-3.0% appreciation · 4.41% rent growth · sell at horizon
- IRR
- -16.9%
- Equity multiple
- 0.40×
- Total profit
- $-70,042
- Equity at exit
- $61,729
- IRR
- -6.3%
- Equity multiple
- 0.57×
- Total profit
- $-50,028
- Equity at exit
- $35,795
Cash invested: $115,920 (down + closing). Projections, not guarantees.
Landlord ↔ Tenant lean methodology
- Overall (STATE)
- 18 Strongly Tenant-Friendly
- State California
- 18 Strongly Tenant-Friendly · D+13
- County
- — inherits STATE
- City
- — inherits STATE
ZIP-level market 93401
- Rents YoY
- 4.4%
- Active inventory
- 140
- Price-to-rent
- 10.0×
Monthly cashflow live
- Estimated rent
- $3,463 high interval (Pro) →
- Mortgage (P&I)
- −$2,171
- Tax est. 1.5%
- −$518 /mo · $6,210/yr
- Insurance
- −$172
- HOA
- −$0
- Vacancy / Maint / Mgmt
- −$727
- Net cashflow
- $-125
Break-even live
Sensitivity live
| Price | -10% $161 | -5% $18 | +0% $-125 | +5% $-268 | +10% $-412 |
|---|---|---|---|---|---|
| Rent | -10% $-399 | -5% $-262 | +0% $-125 | +5% $11 | +10% $148 |
| Rate | -1.0pp $83 | -0.5pp $-20 | base $-125 | +0.5pp $-233 | +1.0pp $-342 |
UW: 25.0% down · 7.5% · 30yr · 1.5% tax · 5.0% vac · 8.0% maint · 8.0% mgmt
Financing live
Cash to close
- Down payment
- $103,500
- Closing costs
- $12,420
- Reserves months
- —
- Total cash needed
- —
Loan-product check · same deal, 3 products live
Conventional
25% down · 7.5% · 30yr
- Down + closing
- —
- Monthly P&I
- —
- Monthly cashflow
- —
- DSCR
- —
- Eligible?
- —
Personal DTI + credit; lowest rate.
DSCR
20% down · 8.5% · 30yr
- Down + closing
- —
- Monthly P&I
- —
- Monthly cashflow
- —
- DSCR
- —
- Eligible?
- —
No personal income docs; deal must DSCR.
Hard money
10% down · 12.0% · 12mo
- Down + closing
- —
- Monthly P&I
- —
- Monthly cashflow
- —
- DSCR
- —
- Eligible?
- —
Short-term bridge; refi at stabilization.
Rent comps 7 comps
| Address | Beds | Baths | Sqft | Rent | $/sqft | DOM | Units | Dist |
|---|---|---|---|---|---|---|---|---|
| 825 Madonna Rd San Luis Obispo, CA | 2.0 | 2.0 | 949 | $3,000 | $3.16 | 45d | 1 | 0.90mi |
| 905 Madonna Rd San Luis Obispo, CA | 3.0 | 3.0–3.5 | 1459 | $4,825 | $3.31 | 15d | 2 | 0.91mi |
| 915 Madonna Rd #102 San Luis Obispo, CA | 3.0 | 2.0 | 1141 | $1,685 | $1.48 | 45d | 1 | 0.93mi |
| 925 Madonna Rd #302 San Luis Obispo, CA | 3.0 | 2.0 | 1075 | $3,500 | $3.26 | 23d | 1 | 0.94mi |
| 3335 Broad St #18 San Luis Obispo, CA | 2.0 | 1.5 | 1190 | $2,900 | $2.44 | 15d | 1 | 1.05mi |
| 1704 Tonini Dr San Luis Obispo, CA | 1.0–2.0 | 1.0–2.5 | 985 | $3,445 | $3.50 | 15d | 3 | 1.38mi |
| 547 Marsh St San Luis Obispo, CA | 2.0 | 1.0 | 850 | $3,200 | $3.76 | 45d | 1 | 1.49mi |
Listing history 18 events
-
2026-06-21pricedays on market $414,000 Active 94 DOM
-
2026-06-18days on market $424,000 Active 91 DOM
-
2026-06-17days on market $424,000 Active 90 DOM
-
2026-06-16days on market $424,000 Active 89 DOM
-
2026-06-15days on market $424,000 Active 88 DOM
-
2026-06-14days on market $424,000 Active 86 DOM
-
2026-06-13days on market $424,000 Active 85 DOM
-
2026-06-10days on market $424,000 Active 83 DOM
-
2026-06-09days on market $424,000 Active 82 DOM
-
2026-06-08days on market $424,000 Active 81 DOM
-
2026-06-07days on market $424,000 Active 80 DOM
-
2026-06-03days on market $424,000 Active 76 DOM
-
2026-06-02days on market $424,000 Active 75 DOM
-
2026-06-01days on market $424,000 Active 74 DOM
-
2026-05-31days on market $424,000 Active 73 DOM
-
2026-05-30days on market $424,000 Active 72 DOM
-
2026-04-09price $424,000 1032-char remark
Show marketing remark (1032 chars)
Situated in Rancho San Luis Mobile Home Estates, a desirable 55+ community, this brand-new Silvercrest home offers an exceptional blend of comfort and elegance, with access to amenities including a pool, spa, and billiards room. Lightly lived in and in pristine condition, this home features 2 bedrooms and 1¾ bathrooms, along with a versatile bonus room that can be used as a home office or additional living space. The primary suite includes a dual vanity and walk-in shower. The kitchen is equipped with all-new stainless steel appliances and soft close cupboards and drawers. An oversized covered deck with low rise steps up the staircase adds an additional 189 square feet of outdoor living space, perfect for relaxing and viewing Southhills. Recent upgrades include new plumbing, professional leveling, and a brand-new concrete driveway. Space rent of $964.35 includes water, sewer, trash, and common areas. This home is truly move-in ready, offering a perfect blend of modern convenience and tranquil community living.
-
2026-03-19$429,000 Active 1032-char remark
Show marketing remark (1032 chars)
Situated in Rancho San Luis Mobile Home Estates, a desirable 55+ community, this brand-new Silvercrest home offers an exceptional blend of comfort and elegance, with access to amenities including a pool, spa, and billiards room. Lightly lived in and in pristine condition, this home features 2 bedrooms and 1¾ bathrooms, along with a versatile bonus room that can be used as a home office or additional living space. The primary suite includes a dual vanity and walk-in shower. The kitchen is equipped with all-new stainless steel appliances and soft close cupboards and drawers. An oversized covered deck with low rise steps up the staircase adds an additional 189 square feet of outdoor living space, perfect for relaxing and viewing Southhills. Recent upgrades include new plumbing, professional leveling, and a brand-new concrete driveway. Space rent of $964.35 includes water, sewer, trash, and common areas. This home is truly move-in ready, offering a perfect blend of modern convenience and tranquil community living.
ⓘ Source: listings_history table (triggers on properties + properties_extension) + one-shot
backfill from property_details.listing_events for pre-trigger history.
Climate risk First Street
- Flood 6/10 Major FEMA zone X (unshaded) · 68% chance over 30 yrs
- Wildfire 6/10 Major
- Heat 4/10 Moderate 4 d/yr ≥82°F today · 10 d/yr by 30 yrs out
- Wind 1/10 Low
- Air quality 6/10 Major 11 unhealthy d/yr today · 11 by 30 yrs out
Nearby sold comps map
Loading sold comps map…
Walkable amenities ~0.75 mi
Loading nearby amenities…
Taxation est. · year 1
- Rental income
- $41,554
- − Mortgage interest
- −$23,190
- − Property taxes
- −$6,210
- − Insurance
- −$2,070
- − Repairs & maintenance
- −$3,324
- − Management
- −$3,324
- − Depreciation
- −$12,044
- Taxable loss
- −$8,609
- Est. tax savings @ 24.0%
- +$2,066
- After-tax cash flow
- $561/yr
For passive investors: Depreciation is non-cash, so a rental often shows a tax loss while cash-flowing — sheltering income. Rental losses are passive: they offset passive income freely, and up to $25,000/yr can offset ordinary (W-2) income if you actively participate and your MAGI is under $100k (phasing out to $0 by $150k); unused losses carry forward. On sale, claimed depreciation is recaptured at up to 25%, and gains may owe capital-gains tax (a 1031 exchange can defer both). Figures are a year-1 estimate at your 24.0% rate — not tax advice; consult a CPA.
Condition & rehab AI · 13 photos
This move-in-ready manufactured home in a desirable community offers a blend of comfort and elegance with modern updates and excellent condition.
Value-add opportunities
- Both Paint exterior — Fresh paint enhances curb appeal and value
- Both Replace window treatments — Fresh window treatments improve aesthetics and energy efficiency
- Both Install smart home devices — Enhances convenience and marketability
Renovation cost estimate screening
Value-add ROI direction
- Both Paint exterior — Fresh paint enhances curb appeal and value ↑
- Both Replace window treatments — Fresh window treatments improve aesthetics and energy efficiency ↑
- Both Install smart home devices — Enhances convenience and marketability ↑
ⓘ Cost ranges are severity-bucket heuristics (US national rule-of-thumb). Get contractor quotes + a written scope before underwriting a rehab budget.
Schools (NCES district)
- District
- San Luis Coastal Unified
- NCES district ID
- 0634800
- Math proficiency
- 50% ▼ -14.00%
- Reading proficiency
- 58% ▼ -12.00%
- Median HH income
- $53,428
- Composite
- 46.4/100
- National rank
- #2455
- State rank
- #118 of 517 in CA
Livability — San Luis Obispo
- Score
- 74/100
- State rank
- #132
- US rank
- #4576
Category grades
Schools grade is shown separately in the Schools card above.
Census & demographics
- Census place
- San Luis Obispo, CA
- County
- San Luis Obispo County · 224,651 people
- City population
- 54,204
- Metro
- San Luis Obispo-Paso Robles, CA
- Population (ZIP)
- 29,202
- Household income
- $96,824
- Rent vs Own
- Severe rent burden
- 2050.0
Population outlook (San Luis Obispo County) Hauer SSP2
- Today (2025)
- 306,977 people
- By 2030
- 320,378 · +4.4%
- By 2040
- 343,933 · +12.0%
- By 2050
- 366,853 · +19.5%
- By 2075
- 428,329 · +39.5%
- By 2100
- 460,687 · +50.1%
Race, ethnicity, and origin ACS 2023
- Neighborhood character
- Predominantly White (71%)
- Race & ethnicity
- White 71% Hispanic / Latino 18% Two or more races 12% Asian 4% Black 2%
- Hispanic origin (detail)
- Mexican 14%
- Common ancestry
- Lithuanian 4% Italian 3% Portuguese 3%
- Foreign-born
- 9% · Canada, China, South Korea
- Languages at home
- 84% English-only · Spanish 10% Chinese 1% Other Asian/Pacific 1%
Political lean MEDSL · San Luis Obispo
- 2024 margin
- D (+10.9) · D 53.9% · R 43.1% · Other 3.0%
- 2008→2024 swing
- +5.5pp toward D · 2008: 5.4pp · 2024: 10.9pp
- All cycles
- 2024: D+10.9 2020: D+13.1 2016: D+8.3 2012: D+1.0 2008: D+5.4
Not yet ingested
- Civics
- —
Market trends
- HPI YoY
- ▼ -796.84%
- Current HPI
- 359.9248
- Rent YoY
- ▲ 4.41%
- Metro
- San Luis Obispo-Paso Robles, CA
- State GDP YoY
- ▲ 3.21%
- F500 in state
- 116
Industry mix (Fortune 500 HQ in CA)
| Industry | F500 HQs | Revenue |
|---|---|---|
| Technology | 27 | $1,492B |
|
||
| Financial Services | 3 | $174B |
|
||
| Retail | 3 | $44B |
|
||
| Insurance | 3 | $26B |
|
||
| Media / Entertainment | 2 | $115B |
|
||
| Pharmaceuticals / Biotech | 2 | $62B |
|
||
Price history
-1.2% since first listed2 events — show timeline
- 2026-04-09 Price Changed $424,000 CRMLS
- 2026-03-19 Listed $429,000 CRMLS
Cash-flow waterfall
monthlySold comps — $/sqft
last 12 mo · ≤1 miLoading sold comps…