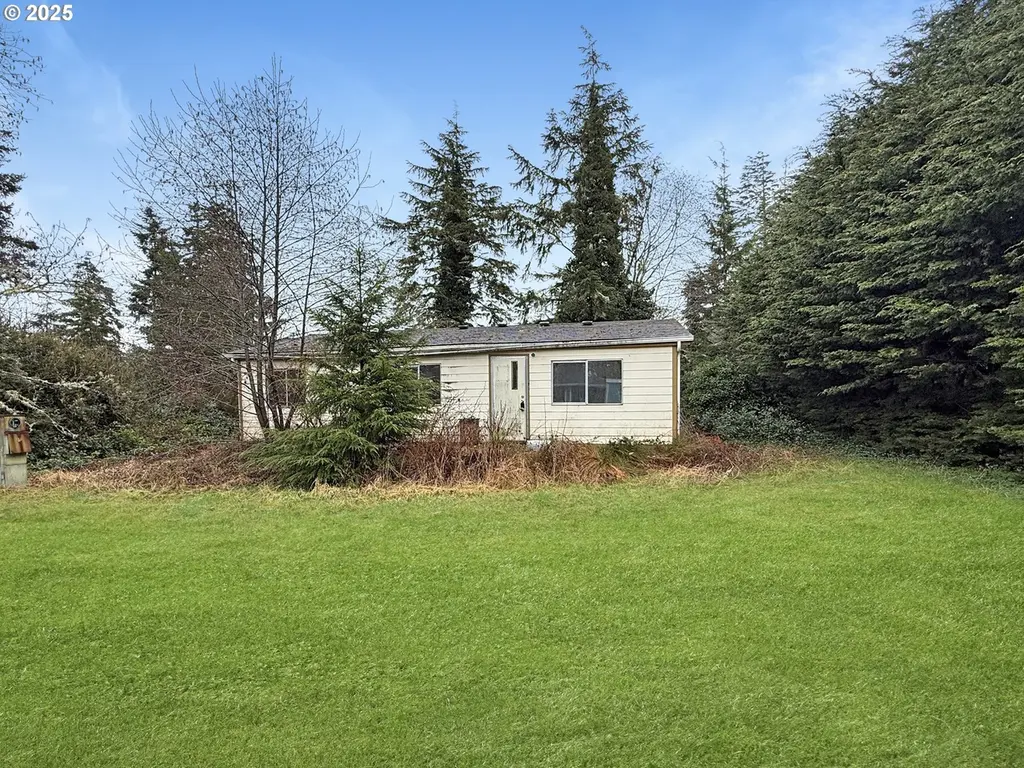
20401 Crane Pl · Ocean Park, WA
Flood risk 1/10 · Minimal
- FEMA flood zone
- X (unshaded)
- Chance of flooding over 30 yrs
- 0.0%
- Est. flood insurance / yr
- $507 – $1,088
Fire risk 3/10 · Minor
- Est. fire insurance / yr
- $604 – $1,122
Heat risk 1/10 · Minimal
- Hot days now (above 74°F)
- 7 days/yr
- Hot days in 30 yrs
- 15 days/yr
Wind risk 1/10 · Minimal
- Chance of severe wind over 30 yrs
- —
Air-quality risk 5/10 · Moderate
- Unhealthy air days now
- 6 days/yr
- Unhealthy air days in 30 yrs
- 6 days/yr
Risk factors via First Street. Map © Google.
Why this score? — see what drove the B- grade
The composite is a weighted blend of 9 inputs, each scored 0–100. Each bar is that input's sub-score; the figure is the points it added to the 100-point composite (weight × sub-score).
- Cash flow +30.0/30.0
- 1% rule +10.0/10.0
- DSCR +10.0/10.0
- ARV discount +7.5/15.0
- Schools +3.7/10.0
- Livability +3.6/5.0
- Rent growth +2.5/5.0
- Condition / age +2.5/5.0
- Appreciation +0.0/10.0
$89,000
🖨 Deal sheet 📄 Offer letter ✓ Due diligence
Listing remarks MLS
Build your dream beach house on this wonderful lot! The existing manufactured home is not habitable or safe in its current condition. Sold "as is", cash only.
Key facts
- 7,405 sq ft lot
- Built 1983
- Listed 442 days
Neighborhood map
What this means for you Summary
Snapshot
- This is a 2-bed/2.0-bath manufactured listed at $89k.
Deal economics
- At list price, monthly cash flow is $1k ($18k/yr) — positive.
- The deal already cash-flows at list — no discount required.
- Meets the 1% rule at list price ($3k rent vs $89k).
- Recommended offer: $78k (12.0% below list) — sets the bar for market timing.
- Cap rate 26.4% vs local median 4.2% in Ocean Park — top-decile yield for the area; either an underpriced asset or a hidden risk that comps aren't pricing in. Stress-test before assuming the spread holds.
Location & tenants
- Location reads 72/100 on livability (#216 in WA) — a middle-class / working-renter tenant base. Strengths: housing A+, health & safety A+, crime A; Watch: commute D+, employment D+, schools F.
- Ocean Beach School District (rural): math 34% / reading 50% proficiency, ranked #212 of 291 in WA (top 73%) — families likely to look elsewhere, expect single-tenant / working-renter base with shorter leases.
- Market conditions: 311 active listings in the ZIP; 1 comparable units currently listed for rent nearby; 90 units permitted in Pacific County in 2024 (0 in 5+ unit buildings).
Forward outlook
- Local home prices are declining (-3.0%/yr); year-one equity from $615 of loan paydown is wiped out by about $3k of value loss. Plan a longer hold.
- Pacific County population projected at -10% by 2050 — secular population decline; favor cash flow + early exit over multi-decade hold.
- At projected returns (-3.0% appreciation + 3.0% rent growth), your $25k cash investment doubles in ~2 years — after that, you're playing with house money.
Negotiation context
- It's been on market 442 days — a 12% lower offer ($78k) is reasonable based on typical stale-listing flexibility.
- 4 sale attempts since 15y ago; this cycle's ask has dropped $10k (10%) from the opening price — seller is motivated, your offer sets the floor, not the list.
- Current owner paid $32k; list at $89k implies a 178% gain — meaningful room to come down on a strong offer.
Questions for the listing agent
- It's been on market 442 days. Have you received any prior offers? Is the seller open to a 12% concession, seller financing, or rate buy-down credit?
- What does the HOA fee cover, when was the last increase, and are there any pending special assessments or reserve-fund shortfalls?
- Why hasn't it sold? Are there any deal-killer items the seller is aware of (foundation, flood, title, zoning, code violations)?
- Is there a deadline driving the sale (1031 exchange, divorce, estate, relocation)? That informs how much negotiation room exists.
- Schools are F-rated, which usually means shorter tenancies and higher turnover. Who's the typical renter profile here, and what's been the actual vacancy rate?
- What's the average days-on-market for RENTAL listings here right now (not sales)? A rising rental-DOM trend means longer vacancies and softer asking-rent achievability than the comps imply.
- What's the recent tenant-quality profile in this submarket — average credit score on applications, eviction rate, late-payment / NSF rate, and stable-employment percentage? A property-management company in the area should have these aggregated.
- How much new for-sale + rental construction is in the pipeline within 1–3 miles? Heavy new supply typically softens prices + rents 12–24 months out; constrained supply supports both.
Investment metrics
- 1% rule
- 2.92% ✓
- Cap rate
- 26.44%
- Cash-on-cash
- 71.95%
- DSCR
- 4.20
- GRM
- 2.9
CMA / ARV
- ARV (median comp)
- $235,957
- List price
- $89,000
- Delta
- -62.28%
- Verdict
- UNDERPRICED
- Comps
- 5 within 1.0 mi
Show comp detail 4 sales within ~0.75 mi
| Address | Dist | Beds/Ba | Sqft | Sold | Price | $/sf | Match |
|---|---|---|---|---|---|---|---|
| 20813 Crane Pl | 0.27mi | 2/2.0 | 960 (+11%) | 5mo | $160,000 | $167 | 64 |
| 2915 217th St | 0.63mi | 2/2.0 | 896 (+4%) | 3mo | $215,000 | $240 | 62 |
| 1710 195th St | 0.69mi | 2/2.0 | 840 (-3%) | 2mo | $270,000 | $321 | 62 |
| 1525 197th St | 0.71mi | 2/1.0 | 952 (+10%) | 21mo | $125,500 | $132 | 29 |
Match score weights: distance 35% · size 25% · config 20% · recency 20%. Top-matched comps best support the ARV.
Projected returns pro-forma
-3.0% appreciation · 3.0% rent growth · sell at horizon
- IRR
- 71.6%
- Equity multiple
- 4.24×
- Total profit
- $80,743
- Equity at exit
- $13,270
- IRR
- 75.5%
- Equity multiple
- 8.74×
- Total profit
- $192,864
- Equity at exit
- $7,695
Cash invested: $24,920 (down + closing). Projections, not guarantees.
Landlord ↔ Tenant lean methodology
- Overall (STATE)
- 28 Tenant-Leaning
- State Washington
- 28 Tenant-Leaning · D+8
- County
- — inherits STATE
- City
- — inherits STATE
ZIP-level market 98640
- Home prices YoY
- -26.7%
- Active inventory
- 311
- Price-to-rent
- 2.9×
Monthly cashflow live
- Estimated rent
- $2,600 medium interval (Pro) →
- Mortgage (P&I)
- −$467
- Tax from tax record
- −$46 /mo · $553/yr
- Insurance
- −$37
- HOA
- −$10
- Vacancy / Maint / Mgmt
- −$546
- Net cashflow
- $1,494
Break-even live
UW: 25.0% down · 7.5% · 30yr · 1.5% tax · 5.0% vac · 8.0% maint · 8.0% mgmt
Financing live
Cash to close
- Down payment
- $22,250
- Closing costs
- $2,670
- Reserves months
- —
- Total cash needed
- —
Loan-product check · same deal, 3 products live
Conventional
25% down · 7.5% · 30yr
- Down + closing
- —
- Monthly P&I
- —
- Monthly cashflow
- —
- DSCR
- —
- Eligible?
- —
Personal DTI + credit; lowest rate.
DSCR
20% down · 8.5% · 30yr
- Down + closing
- —
- Monthly P&I
- —
- Monthly cashflow
- —
- DSCR
- —
- Eligible?
- —
No personal income docs; deal must DSCR.
Hard money
10% down · 12.0% · 12mo
- Down + closing
- —
- Monthly P&I
- —
- Monthly cashflow
- —
- DSCR
- —
- Eligible?
- —
Short-term bridge; refi at stabilization.
Rent comps 1 comps
| Address | Beds | Baths | Sqft | Rent | $/sqft | DOM | Units | Dist |
|---|---|---|---|---|---|---|---|---|
| 1509 178th Pl Long Beach, WA | 2.0 | 1.0 | 896 | $2,600 | $2.90 | 43d | 1 | 1.45mi |
HOA detail
- Monthly dues
- $10 · $120/yr
Listing history 20 events
-
2026-06-09days on market $89,000 Active 442 DOM
-
2026-06-08days on market $89,000 Active 441 DOM
-
2026-06-08days on market $89,000 Active 440 DOM
-
2026-06-07days on market $89,000 Active 439 DOM
-
2026-06-03days on market $89,000 Active 436 DOM
-
2026-06-02days on market $89,000 Active 435 DOM
-
2026-06-01days on market $89,000 Active 434 DOM
-
2026-05-31days on market $89,000 Active 433 DOM
-
2025-09-13price $89,000 168-char remark
Show marketing remark (168 chars)
Build your dream beach house on this wonderful lot! The existing manufactured home is not habitable or safe in its current condition. Sold "as is", cash only.
-
2025-07-03status Active 168-char remark
Show marketing remark (168 chars)
Build your dream beach house on this wonderful lot! The existing manufactured home is not habitable or safe in its current condition. Sold "as is", cash only.
-
2025-06-24status Pending 168-char remark
Show marketing remark (168 chars)
Build your dream beach house on this wonderful lot! The existing manufactured home is not habitable or safe in its current condition. Sold "as is", cash only.
-
2025-03-14$99,000 Active 168-char remark
Show marketing remark (168 chars)
Build your dream beach house on this wonderful lot! The existing manufactured home is not habitable or safe in its current condition. Sold "as is", cash only.
-
2012-04-26soldstatus $32,000 Sold 216-char remark
Show marketing remark (216 chars)
Opportunity for handyman. Water damage and mold type growth in Laundry and Bath rooms. 2 Bedrooms. 1 Bath, Vaulted open floor plan. New water heater and roof was replaced a few years ago, hardi plank siding on front.
-
2012-04-20soldstatus $32,000 Sold
-
2012-03-21status Pending 216-char remark
Show marketing remark (216 chars)
Opportunity for handyman. Water damage and mold type growth in Laundry and Bath rooms. 2 Bedrooms. 1 Bath, Vaulted open floor plan. New water heater and roof was replaced a few years ago, hardi plank siding on front.
-
2012-03-20status Pending Feasibility
-
2012-03-03price $36,500
-
2012-02-29price $36,500 216-char remark
Show marketing remark (216 chars)
Opportunity for handyman. Water damage and mold type growth in Laundry and Bath rooms. 2 Bedrooms. 1 Bath, Vaulted open floor plan. New water heater and roof was replaced a few years ago, hardi plank siding on front.
-
2012-01-15$37,500 Active
-
2011-12-31$37,500 Active 216-char remark
Show marketing remark (216 chars)
Opportunity for handyman. Water damage and mold type growth in Laundry and Bath rooms. 2 Bedrooms. 1 Bath, Vaulted open floor plan. New water heater and roof was replaced a few years ago, hardi plank siding on front.
ⓘ Source: listings_history table (triggers on properties + properties_extension) + one-shot
backfill from property_details.listing_events for pre-trigger history.
Tax reassessment forecast WA · Resets to sale price
- Current annual tax
- $553 · $46/mo
- Projected year-2 tax
- $872 · $73/mo
- Expected delta
- +$319/yr (+$27/mo · 57.7%)
ⓘ Screening estimate from a state-policy table — verify with the county assessor before closing.
Climate risk First Street
- Flood 1/10 Low FEMA zone X (unshaded) · 0% chance over 30 yrs
- Wildfire 3/10 Moderate
- Heat 1/10 Low 7 d/yr ≥74°F today · 15 d/yr by 30 yrs out
- Wind 1/10 Low
- Air quality 5/10 Major 6 unhealthy d/yr today · 6 by 30 yrs out
Nearby sold comps map
Loading sold comps map…
Walkable amenities ~0.75 mi
Loading nearby amenities…
Taxation est. · year 1
- Rental income
- $31,200
- − Mortgage interest
- −$4,985
- − Property taxes
- −$553
- − Insurance
- −$445
- − Repairs & maintenance
- −$2,496
- − Management
- −$2,496
- − HOA
- −$120
- − Depreciation
- −$2,589
- Taxable income
- $17,515
- Est. tax owed @ 24.0%
- −$4,204
- After-tax cash flow
- $13,725/yr
For passive investors: Depreciation is non-cash, so a rental often shows a tax loss while cash-flowing — sheltering income. Rental losses are passive: they offset passive income freely, and up to $25,000/yr can offset ordinary (W-2) income if you actively participate and your MAGI is under $100k (phasing out to $0 by $150k); unused losses carry forward. On sale, claimed depreciation is recaptured at up to 25%, and gains may owe capital-gains tax (a 1031 exchange can defer both). Figures are a year-1 estimate at your 24.0% rate — not tax advice; consult a CPA.
Schools (NCES district)
- District
- Ocean Beach School District
- NCES district ID
- 5306060
- Math proficiency
- 34% ▼ -1.00%
- Reading proficiency
- 50% ▲ 1.00%
- Median HH income
- $38,549
- Composite
- 37.37/100
- National rank
- #8929
- State rank
- #212 of 291 in WA
Livability — Ocean Park
- Score
- 72/100
- State rank
- #216
- US rank
- #6161
Category grades
Schools grade is shown separately in the Schools card above.
Census & demographics
- Population (ZIP)
- 5,107
Population outlook (Pacific County) Hauer SSP2
- Today (2025)
- 20,636 people
- By 2030
- 20,137 · -2.4%
- By 2040
- 19,041 · -7.7%
- By 2050
- 18,504 · -10.3%
- By 2075
- 17,403 · -15.7%
- By 2100
- 16,241 · -21.3%
Race, ethnicity, and origin ACS 2023
- Neighborhood character
- Predominantly White (88%)
- Race & ethnicity
- White 88% Two or more races 6% Hispanic / Latino 6% Asian 3%
- Hispanic origin (detail)
- Mexican 5%
- Common ancestry
- Portuguese 5% Lithuanian 4% Slovak 4%
- Foreign-born
- 7% · Canada, China
- Languages at home
- 92% English-only · Spanish 4% Chinese 1% German/W. Germanic 1%
Political lean MEDSL · Pacific
- 2024 margin
- Toss-up / Even · D 48.1% · R 49.4% · Other 2.4%
- 2008→2024 swing
- -15.4pp toward R · 2008: 14.1pp · 2024: -1.3pp
- All cycles
- 2024: R+1.3 2020: R+1.1 2016: R+6.9 2012: D+11.4 2008: D+14.1
Not yet ingested
- Civics
- —
Market trends
- HPI YoY
- ▼ -81.15%
- Current HPI
- 222.8758
- Rent YoY
- —
- Metro
- —
- State GDP YoY
- ▲ 4.65%
- F500 in state
- 22
Industry mix (Fortune 500 HQ in WA)
| Industry | F500 HQs | Revenue |
|---|---|---|
| Retail | 2 | $269B |
|
||
| Technology / Retail | 1 | $638B |
|
||
| Technology | 1 | $245B |
|
||
| Telecommunications | 1 | $38B |
|
||
| Food / Beverage | 1 | $36B |
|
||
| Automotive / Trucks | 1 | $34B |
|
||
Price history
+137.3% since first listed12 events — show timeline
- 2025-09-13 Price Changed $89,000 RMLS
- 2025-07-03 Relisted — RMLS
- 2025-06-24 Pending — RMLS
- 2025-03-14 Listed $99,000 RMLS
- 2012-04-26 Sold (MLS) $32,000 RMLS
- 2012-04-20 Sold (MLS) $32,000 NWMLS as Distributed by MLS Grid
- 2012-03-21 Pending — RMLS
- 2012-03-20 Pending — NWMLS as Distributed by MLS Grid
- 2012-03-03 Price Changed $36,500 NWMLS as Distributed by MLS Grid
- 2012-02-29 Price Changed $36,500 RMLS
- 2012-01-15 Listed $37,500 NWMLS as Distributed by MLS Grid
- 2011-12-31 Listed $37,500 RMLS
Property tax history
+1.5%/yrLatest (2026): $553 · -2.2% YoY. Source: county tax records.
Cash-flow waterfall
monthlySold comps — $/sqft
last 12 mo · ≤1 miLoading sold comps…