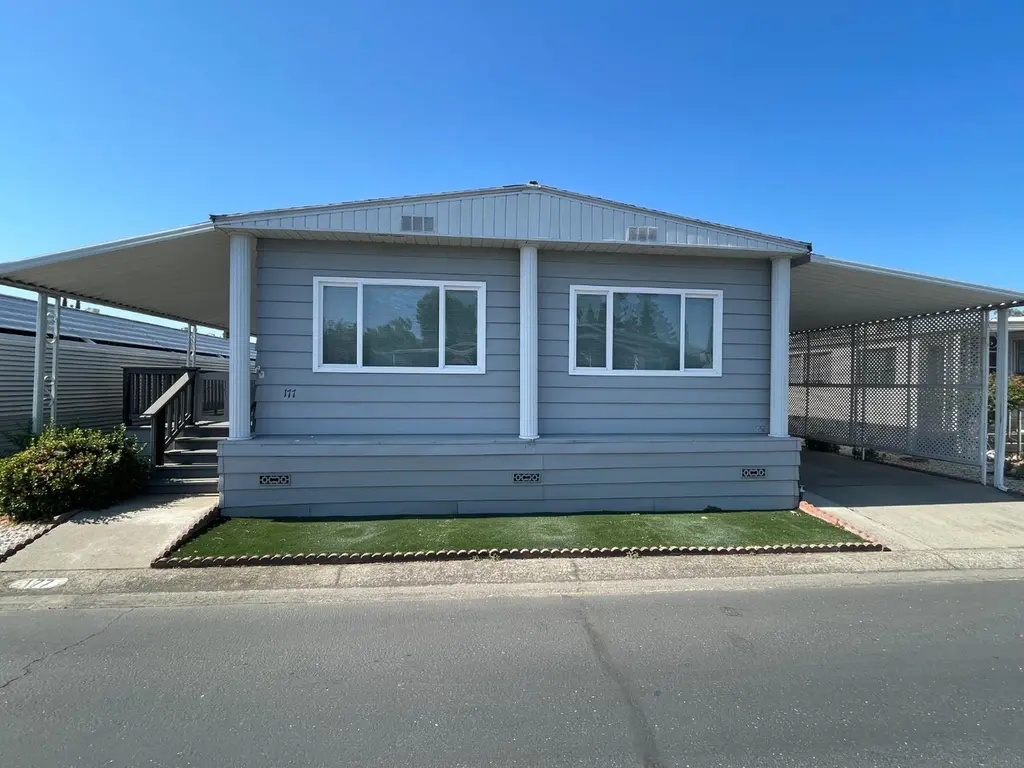
177 San Marcos Dr · Lodi, CA
Flood risk 1/10 · Minimal
- FEMA flood zone
- X (shaded)
- Chance of flooding over 30 yrs
- 0.0%
- Est. flood insurance / yr
- $507 – $1,088
Fire risk 4/10 · Minor
- Est. fire insurance / yr
- $659 – $1,223
Heat risk 7/10 · Major
- Hot days now (above 101°F)
- 6 days/yr
- Hot days in 30 yrs
- 13 days/yr
Wind risk 1/10 · Minimal
- Chance of severe wind over 30 yrs
- —
Air-quality risk 10/10 · Severe
- Unhealthy air days now
- 27 days/yr
- Unhealthy air days in 30 yrs
- 29 days/yr
Risk factors via First Street. Map © Google.
Why this score? — see what drove the C- grade
The composite is a weighted blend of 9 inputs, each scored 0–100. Each bar is that input's sub-score; the figure is the points it added to the 100-point composite (weight × sub-score).
- ARV discount +15.0/15.0
- Cash flow +12.6/30.0
- 1% rule +10.0/10.0
- DSCR +3.8/10.0
- Condition / age +3.8/5.0
- Rent growth +3.0/5.0
- Livability +2.9/5.0
- Schools +2.7/10.0
- Appreciation +0.0/10.0
$124,900
🖨 Deal sheet 📄 Offer letter ✓ Due diligence
Listing remarks
Welcome to this well-cared for and move in ready home located in the Senior Community of Casa De Lodi Mobile Park Estates. You will be minutes away from downtown, shopping centers, and restaurants. Easy access to Highway 99. Open floor plan with family room, kitchen, breakfast nook, living room, and dining room. This home also features built in selves for plenty of storage.
Key facts
- Open floor plan
- Built in selves
- Parking
Tags
Neighborhood map
What this means for you Summary
Snapshot
- This is a 2-bed/2.0-bath manufactured listed at $125k. Condition is rated good.
Deal economics
- At list price, monthly cash flow is $-15 ($-179/yr) — negative.
- To cash-flow at today's rent, offer at most $123k (1.7% below list).
- Meets the 1% rule at list price ($2k rent vs $125k).
- Recommended offer: $117k (6.0% below list) — sets the bar for market timing.
- Cap rate 6.1% vs local median 3.0% in Lodi — top-decile yield for the area; either an underpriced asset or a hidden risk that comps aren't pricing in. Stress-test before assuming the spread holds.
Location & tenants
- Location reads 58/100 on livability (#730 in CA) — a working-class tenant base; expect higher turnover. Strengths: housing A; Watch: schools C-, crime F, amenities F.
- Lodi Unified (urban): math 24% / reading 36% proficiency, ranked #325 of 517 in CA (top 63%) — families likely to look elsewhere, expect single-tenant / working-renter base with shorter leases.
- Market conditions: Rents rising (+2.1%/yr); 163 active listings in the ZIP; 6 comparable units currently listed for rent nearby; rentals lingering (median 44d on market — plan ~5-8 weeks vacancy on turnover, expect pricing pressure); 50% of comp listings sitting > 30 days — soft ceiling on asking rent; solid renter incomes; 3,779 units permitted in San Joaquin County in 2024 (0 in 5+ unit buildings).
- This rent runs 31% of the median local income ($82k/yr) — at the standard rent-burdened threshold; future hikes will face affordability resistance.
Forward outlook
- Local home prices are declining (-3.0%/yr); year-one equity from $864 of loan paydown is wiped out by about $4k of value loss. Plan a longer hold.
- San Joaquin County population projected at +17% by 2050 — long-run rental-demand tailwind backs the buy-and-hold thesis.
Negotiation context
- It's been on market 85 days — a 6% lower offer ($117k) is reasonable based on typical stale-listing flexibility.
Risks & watch-outs
- Watch-outs: HOA is 40% of rent.
- Climate carrying-cost: extreme-heat days projected 6→13/yr by 2055 (HVAC capex compounding) — expect insurance premiums to compound above CPI over the hold.
Questions for the listing agent
- What do current leases actually rent for vs. the listed asking? Can we see a recent rent roll and the last 12 months of T-12 income?
- It's been on market 85 days. Have you received any prior offers? Is the seller open to a 6% concession, seller financing, or rate buy-down credit?
- Built in 1973 — when were the roof, HVAC, electrical panel, plumbing, and water heater last replaced?
- What does the HOA fee cover, when was the last increase, and are there any pending special assessments or reserve-fund shortfalls?
- Why hasn't it sold? Are there any deal-killer items the seller is aware of (foundation, flood, title, zoning, code violations)?
- Is there a deadline driving the sale (1031 exchange, divorce, estate, relocation)? That informs how much negotiation room exists.
- Crime grade is F in this area — have there been break-ins, vandalism, or insurance claims at this property in the last 3 years? What carrier currently insures it and at what premium?
- What's the average days-on-market for RENTAL listings here right now (not sales)? A rising rental-DOM trend means longer vacancies and softer asking-rent achievability than the comps imply.
- What's the recent tenant-quality profile in this submarket — average credit score on applications, eviction rate, late-payment / NSF rate, and stable-employment percentage? A property-management company in the area should have these aggregated.
- How much new for-sale + rental construction is in the pipeline within 1–3 miles? Heavy new supply typically softens prices + rents 12–24 months out; constrained supply supports both.
Investment metrics
- 1% rule
- 1.72% ✓
- Cap rate
- 6.15%
- Cash-on-cash
- -0.51%
- DSCR
- 0.98
- GRM
- 4.8
CMA / ARV
- ARV (median comp)
- $152,890
- List price
- $124,900
- Delta
- -18.31%
- Verdict
- UNDERPRICED
- Comps
- 13 within 1.0 mi
Show comp detail 12 sales within ~0.75 mi
| Address | Dist | Beds/Ba | Sqft | Sold | Price | $/sf | Match |
|---|---|---|---|---|---|---|---|
| 60 Camino Real Dr | 0.14mi | 2/2.0 | 1,344 (0%) | 8mo | $90,000 | $67 | 86 |
| 63 Camino Real | 0.15mi | 2/2.0 | 1,344 (0%) | 9mo | $160,000 | $119 | 86 |
| 162 El Centro Dr | 0.03mi | 2/2.0 | 1,440 (+7%) | 7mo | $105,175 | $73 | 81 |
| 127 Camino Real | 0.07mi | 2/2.0 | 1,440 (+7%) | 5mo | $145,000 | $101 | 81 |
| 130 Camino Real Dr | 0.05mi | 2/2.0 | 1,440 (+7%) | 8mo | $168,000 | $117 | 79 |
| 55 Camino Real | 0.08mi | 2/2.0 | 1,440 (+7%) | 8mo | $170,000 | $118 | 78 |
| 140 Granada Dr #140 | 0.07mi | 2/2.0 | 1,440 (+7%) | 10mo | $155,000 | $108 | 77 |
| 202 Plaza Dr | 0.07mi | 2/2.0 | 1,464 (+9%) | 8mo | $165,000 | $113 | 75 |
| 21 Rio Vista Dr | 0.15mi | 2/2.0 | 1,440 (+7%) | 11mo | $315,000 | $219 | 72 |
| 90 Buena Vista Dr | 0.19mi | 2/2.0 | 1,248 (-7%) | 10mo | $190,000 | $152 | 71 |
| 216 San Juan Dr | 0.08mi | 3/2.0 (+1) | 1,200 (-11%) | 6mo | $119,742 | $100 | 68 |
| 232 Madera Dr | 0.19mi | 3/2.0 (+1) | 1,440 (+7%) | 9mo | $115,000 | $80 | 67 |
Match score weights: distance 35% · size 25% · config 20% · recency 20%. Top-matched comps best support the ARV.
Projected returns pro-forma
-3.0% appreciation · 2.08% rent growth · sell at horizon
- IRR
- -18.6%
- Equity multiple
- 0.35×
- Total profit
- $-22,605
- Equity at exit
- $18,623
- IRR
- -14.0%
- Equity multiple
- 0.24×
- Total profit
- $-26,594
- Equity at exit
- $10,799
Cash invested: $34,972 (down + closing). Projections, not guarantees.
Landlord ↔ Tenant lean methodology
- Overall (STATE)
- 18 Strongly Tenant-Friendly
- State California
- 18 Strongly Tenant-Friendly · D+13
- County
- — inherits STATE
- City
- — inherits STATE
ZIP-level market 95240
- Rents YoY
- 2.1%
- Active inventory
- 163
- Price-to-rent
- 4.8×
Monthly cashflow live
- Estimated rent
- $2,150 high interval (Pro) →
- Mortgage (P&I)
- −$655
- Tax est. 1.5%
- −$156 /mo · $1,874/yr
- Insurance
- −$52
- HOA
- −$850
- Vacancy / Maint / Mgmt
- −$451
- Net cashflow
- $-15
Break-even live
UW: 25.0% down · 7.5% · 30yr · 1.5% tax · 5.0% vac · 8.0% maint · 8.0% mgmt
Financing live
Cash to close
- Down payment
- $31,225
- Closing costs
- $3,747
- Reserves months
- —
- Total cash needed
- —
Loan-product check · same deal, 3 products live
Conventional
25% down · 7.5% · 30yr
- Down + closing
- —
- Monthly P&I
- —
- Monthly cashflow
- —
- DSCR
- —
- Eligible?
- —
Personal DTI + credit; lowest rate.
DSCR
20% down · 8.5% · 30yr
- Down + closing
- —
- Monthly P&I
- —
- Monthly cashflow
- —
- DSCR
- —
- Eligible?
- —
No personal income docs; deal must DSCR.
Hard money
10% down · 12.0% · 12mo
- Down + closing
- —
- Monthly P&I
- —
- Monthly cashflow
- —
- DSCR
- —
- Eligible?
- —
Short-term bridge; refi at stabilization.
Rent comps 6 comps
| Address | Beds | Baths | Sqft | Rent | $/sqft | DOM | Units | Dist |
|---|---|---|---|---|---|---|---|---|
| 500 Sonora Ave Lodi, CA | 3.0 | 1.0 | 1032 | $2,149 | $2.08 | 2d | 1 | 0.25mi |
| 15 Forrest Ave Lodi, CA | 3.0 | 2.0 | 1100 | $2,350 | $2.14 | 43d | 1 | 0.71mi |
| 308 Louie Ave Lodi, CA | 2.0 | 1.0 | 1000 | $2,000 | $2.00 | 43d | 1 | 0.98mi |
| 341 1st St Lodi, CA | 3.0 | 2.0 | 1356 | $2,600 | $1.92 | 14d | 1 | 1.07mi |
| 414 W Oak St Unit 414 Lodi, CA | 3.0 | 2.0 | 1420 | $2,750 | $1.94 | 23d | 1 | 1.31mi |
| 514 S School St Lodi, CA | 2.0 | 1.0 | 955 | $2,000 | $2.09 | 43d | 1 | 1.40mi |
HOA detail
- Monthly dues
- $850 · $10,200/yr
Climate risk First Street
- Flood 1/10 Low FEMA zone X (shaded) · 0% chance over 30 yrs
- Wildfire 4/10 Moderate
- Heat 7/10 Severe 6 d/yr ≥101°F today · 13 d/yr by 30 yrs out
- Wind 1/10 Low
- Air quality 10/10 Extreme 27 unhealthy d/yr today · 29 by 30 yrs out
Nearby sold comps map
Loading sold comps map…
Walkable amenities ~0.75 mi
Loading nearby amenities…
Taxation est. · year 1
- Rental income
- $25,796
- − Mortgage interest
- −$6,996
- − Property taxes
- −$1,874
- − Insurance
- −$624
- − Repairs & maintenance
- −$2,064
- − Management
- −$2,064
- − HOA
- −$10,200
- − Depreciation
- −$3,633
- Taxable loss
- −$1,659
- Est. tax savings @ 24.0%
- +$398
- After-tax cash flow
- $219/yr
For passive investors: Depreciation is non-cash, so a rental often shows a tax loss while cash-flowing — sheltering income. Rental losses are passive: they offset passive income freely, and up to $25,000/yr can offset ordinary (W-2) income if you actively participate and your MAGI is under $100k (phasing out to $0 by $150k); unused losses carry forward. On sale, claimed depreciation is recaptured at up to 25%, and gains may owe capital-gains tax (a 1031 exchange can defer both). Figures are a year-1 estimate at your 24.0% rate — not tax advice; consult a CPA.
Condition & rehab AI · 12 photos
This well-maintained and move-in ready manufactured home is in good condition with no major repairs needed. It offers a good investment opportunity with potential for value appreciation through cosmetic updates and improvements.
Value-add opportunities
- Both Painting the exterior and interior walls — Fresh paint can enhance the curb appeal and interior aesthetics.
- Both Updating the kitchen appliances — Modern appliances can improve the functionality and appeal of the kitchen.
- Both Upgrading the flooring — New flooring can improve the overall look and feel of the home.
- Both Updating the bathrooms with modern fixtures — Modern bathrooms can enhance the overall appeal and functionality of the home.
- Both Landscaping improvements — A well-maintained landscape can improve the curb appeal and add value to the home.
Renovation cost estimate screening
Value-add ROI direction
- Both Painting the exterior and interior walls — Fresh paint can enhance the curb appeal and interior aesthetics. ↑
- Both Updating the kitchen appliances — Modern appliances can improve the functionality and appeal of the kitchen. ↑
- Both Upgrading the flooring — New flooring can improve the overall look and feel of the home. ↑
- Both Updating the bathrooms with modern fixtures — Modern bathrooms can enhance the overall appeal and functionality of the home. ↑
- Both Landscaping improvements — A well-maintained landscape can improve the curb appeal and add value to the home. ↑
ⓘ Cost ranges are severity-bucket heuristics (US national rule-of-thumb). Get contractor quotes + a written scope before underwriting a rehab budget.
Schools (NCES district)
- District
- Lodi Unified
- NCES district ID
- 0622230
- Math proficiency
- 24% ▼ -8.00%
- Reading proficiency
- 36% ▼ -8.00%
- Median HH income
- $57,165
- Composite
- 26.84/100
- National rank
- #7108
- State rank
- #325 of 517 in CA
Livability — Lodi
- Score
- 58/100
- State rank
- #730
- US rank
- #21523
Category grades
Schools grade is shown separately in the Schools card above.
Census & demographics
- Census place
- Lodi, CA
- County
- San Joaquin County · 729,570 people
- City population
- 78,944
- Metro
- Stockton, CA
- Population (ZIP)
- 50,517
- Household income
- $82,137
- Rent vs Own
- Severe rent burden
- 1918.0
Population outlook (San Joaquin County) Hauer SSP2
- Today (2025)
- 796,965 people
- By 2030
- 828,849 · +4.0%
- By 2040
- 885,611 · +11.1%
- By 2050
- 929,798 · +16.7%
- By 2075
- 994,578 · +24.8%
- By 2100
- 971,291 · +21.9%
Race, ethnicity, and origin ACS 2023
- Neighborhood character
- Diverse neighborhood (Simpson 0.63)
- Race & ethnicity
- Hispanic / Latino 48% White 35% Two or more races 26% Asian 12% Native American 1%
- Hispanic origin (detail)
- Mexican 44% Puerto Rican 1%
- Common ancestry
- Italian 3% Lithuanian 1% Russian 1%
- Foreign-born
- 25% · Canada
- Languages at home
- 55% English-only · Spanish 35% Other Indo-European 7% Tagalog/Filipino 1%
Political lean MEDSL · San Joaquin
- 2024 margin
- Toss-up / Even · D 48.0% · R 48.9% · Other 3.0%
- 2008→2024 swing
- -11.6pp toward R · 2008: 10.7pp · 2024: -0.9pp
- All cycles
- 2024: R+0.9 2020: D+13.9 2016: D+12.9 2012: D+8.9 2008: D+10.7
Not yet ingested
- Civics
- —
Market trends
- HPI YoY
- ▼ -469.68%
- Current HPI
- 320.685
- Rent YoY
- ▲ 2.08%
- Metro
- Stockton, CA
- State GDP YoY
- ▲ 3.21%
- F500 in state
- 116
Industry mix (Fortune 500 HQ in CA)
| Industry | F500 HQs | Revenue |
|---|---|---|
| Technology | 27 | $1,492B |
|
||
| Financial Services | 3 | $174B |
|
||
| Retail | 3 | $44B |
|
||
| Insurance | 3 | $26B |
|
||
| Media / Entertainment | 2 | $115B |
|
||
| Pharmaceuticals / Biotech | 2 | $62B |
|
||
Cash-flow waterfall
monthlySold comps — $/sqft
last 12 mo · ≤1 miLoading sold comps…