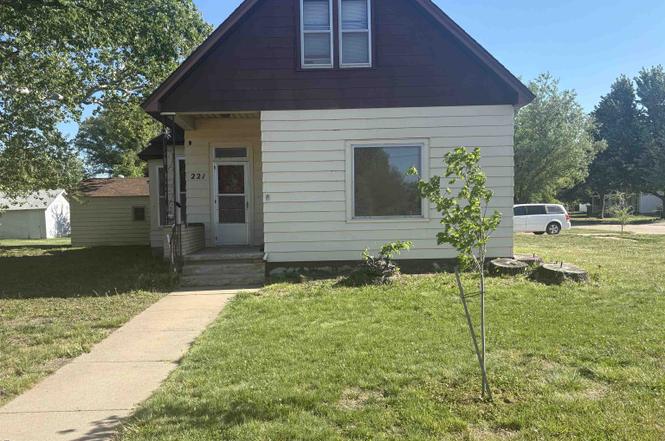
221 W Broadway St · Stafford, KS
Flood risk 1/10 · Minimal
- FEMA flood zone
- —
- Chance of flooding over 30 yrs
- 0.0%
- Est. flood insurance / yr
- —
Fire risk 1/10 · Minimal
- Est. fire insurance / yr
- $1,154 – $2,142
Heat risk 5/10 · Moderate
- Hot days now (above 105°F)
- 7 days/yr
- Hot days in 30 yrs
- 17 days/yr
Wind risk 2/10 · Minimal
- Chance of severe wind over 30 yrs
- —
Air-quality risk 2/10 · Minimal
- Unhealthy air days now
- 1 days/yr
- Unhealthy air days in 30 yrs
- 1 days/yr
Risk factors via First Street. Map © Google.
Why this score? — see what drove the B grade
The composite is a weighted blend of 9 inputs, each scored 0–100. Each bar is that input's sub-score; the figure is the points it added to the 100-point composite (weight × sub-score).
- Cash flow +30.0/30.0
- 1% rule +10.0/10.0
- DSCR +10.0/10.0
- ARV discount +7.5/15.0
- Appreciation +5.4/10.0
- Livability +3.3/5.0
- Rent growth +2.5/5.0
- Condition / age +2.5/5.0
- Schools +2.2/10.0
$68,000
🖨 Deal sheet (PDF) 📄 Offer letter ✓ Due diligence
Key facts
- Half bath
- New ac unit
- Recent upgrades
Tags
Property features AI
Exterior
- Parking: 1-car garage
- Utilities: Public water; Public sewer
- Home design: Residential property; Single-story
- Exterior features: Composition roof; Lot dimensions approximately 80 x 130; Approximately 0.25 acre lot; Zoned NC.1 / R-1
Interior
- Kitchen: Dishwasher; Range/Oven; Refrigerator
- Bedrooms: 2 main-level bedrooms
- Heating & cooling: Central heating (natural gas); Central air conditioning
- Interior features: Window coverings; Partial basement
- Laundry & utility: Washer; Dryer; Water softener
Neighborhood map
What this means for you Summary
Snapshot
- This is a 5-bed/2.5-bath single-family listed at $68k.
Deal economics
- At list price, monthly cash flow is $517 ($6k/yr) — positive.
- The deal already cash-flows at list — no discount required.
- Meets the 1% rule at list price ($1k rent vs $68k).
- Recommended offer: $60k (12.0% below list) — sets the bar for market timing.
Location & tenants
- Location reads 66/100 on livability (#264 in KS) — a middle-class / working-renter tenant base. Strengths: cost of living A+, health & safety A+; Watch: crime F, amenities F, commute F.
- Stafford (rural): math 20% / reading 25% proficiency, ranked #254 of 280 in KS (top 91%) — low school quality limits family demand, transient renter base, plan for 1-2y turnover.
- Zoned schools: Stafford Elementary (math 34% / reading 34%, grade F, #388 of 684 statewide, top 61%, 139 students, 66% FRL); Stafford Middle School/High School (math 5% / reading 15%, grade F, #289 of 327 statewide, top 93%, 95 students, 68% FRL) — zoned schools average 67% FRL vs 49% district-wide (18 pts higher); higher-poverty schools than district average — tighter screening recommended.
- Market conditions: 13 active listings in the ZIP; 8 units permitted in Stafford County in 2024 (0 in 5+ unit buildings).
Forward outlook
- In year one you build about $1k of equity ($470 loan paydown + $574 appreciation (0.8% local appreciation)).
- Stafford County population projected at -12% by 2050 — secular population decline; favor cash flow + early exit over multi-decade hold.
- At projected returns (0.8% appreciation + 3.0% rent growth), your $19k cash investment doubles in ~3 years — after that, you're playing with house money.
Negotiation context
- It's been on market 133 days — a 12% lower offer ($60k) is reasonable based on typical stale-listing flexibility.
Risks & watch-outs
- Watch-outs: built in 1908 — expect roof / HVAC / electrical / plumbing capex.
- Climate carrying-cost: extreme-heat days projected 7→17/yr by 2055 (HVAC capex compounding) — expect insurance premiums to compound above CPI over the hold.
Questions for the listing agent
- It's been on market 133 days. Have you received any prior offers? Is the seller open to a 12% concession, seller financing, or rate buy-down credit?
- Built in 1908 — when were the roof, HVAC, electrical panel, plumbing, and water heater last replaced?
- Why hasn't it sold? Are there any deal-killer items the seller is aware of (foundation, flood, title, zoning, code violations)?
- Is there a deadline driving the sale (1031 exchange, divorce, estate, relocation)? That informs how much negotiation room exists.
- Schools are F-rated, which usually means shorter tenancies and higher turnover. Who's the typical renter profile here, and what's been the actual vacancy rate?
- Crime grade is F in this area — have there been break-ins, vandalism, or insurance claims at this property in the last 3 years? What carrier currently insures it and at what premium?
- What's the average days-on-market for RENTAL listings here right now (not sales)? A rising rental-DOM trend means longer vacancies and softer asking-rent achievability than the comps imply.
- What's the recent tenant-quality profile in this submarket — average credit score on applications, eviction rate, late-payment / NSF rate, and stable-employment percentage? A property-management company in the area should have these aggregated.
- How much new for-sale + rental construction is in the pipeline within 1–3 miles? Heavy new supply typically softens prices + rents 12–24 months out; constrained supply supports both.
Investment metrics
- 1% rule
- 1.84% ✓
- Cap rate
- 15.42%
- Cash-on-cash
- 32.59%
- DSCR
- 2.45
- GRM
- 4.5
CMA / ARV
No comps found within radius.
Projected returns pro-forma
0.84% appreciation · 3.0% rent growth · sell at horizon
- IRR
- 34.7%
- Equity multiple
- 2.77×
- Total profit
- $33,712
- Equity at exit
- $22,664
- IRR
- 37.1%
- Equity multiple
- 5.41×
- Total profit
- $83,984
- Equity at exit
- $29,697
Cash invested: $19,040 (down + closing). Projections, not guarantees.
Landlord ↔ Tenant lean methodology
- Overall (STATE)
- 83 Strongly Landlord-Friendly
- State Kansas
- 83 Strongly Landlord-Friendly · R+10
- County
- — inherits STATE
- City
- — inherits STATE
ZIP-level market 67578
- Home prices YoY
- 0.6%
- Active inventory
- 13
- Price-to-rent
- 4.5×
Monthly cashflow live
- Estimated rent
- $1,250 medium interval (Pro) →
- Mortgage (P&I)
- −$357
- Tax est. 1.5%
- −$85 /mo · $1,020/yr
- Insurance
- −$28
- HOA
- −$0
- Vacancy / Maint / Mgmt
- −$262
- Net cashflow
- $517
Break-even live
Sensitivity live
| Price | -10% $564 | -5% $541 | +0% $517 | +5% $494 | +10% $470 |
|---|---|---|---|---|---|
| Rent | -10% $418 | -5% $468 | +0% $517 | +5% $567 | +10% $616 |
| Rate | -1.0pp $551 | -0.5pp $534 | base $517 | +0.5pp $500 | +1.0pp $482 |
UW: 25.0% down · 7.5% · 30yr · 1.5% tax · 5.0% vac · 8.0% maint · 8.0% mgmt
Financing live
Cash to close
- Down payment
- $17,000
- Closing costs
- $2,040
- Reserves months
- —
- Total cash needed
- —
Loan-product check · same deal, 3 products live
Conventional
25% down · 7.5% · 30yr
- Down + closing
- —
- Monthly P&I
- —
- Monthly cashflow
- —
- DSCR
- —
- Eligible?
- —
Personal DTI + credit; lowest rate.
DSCR
20% down · 8.5% · 30yr
- Down + closing
- —
- Monthly P&I
- —
- Monthly cashflow
- —
- DSCR
- —
- Eligible?
- —
No personal income docs; deal must DSCR.
Hard money
10% down · 12.0% · 12mo
- Down + closing
- —
- Monthly P&I
- —
- Monthly cashflow
- —
- DSCR
- —
- Eligible?
- —
Short-term bridge; refi at stabilization.
Listing history 2 events
-
2026-05-20status Pending
-
2026-01-06$68,000 Active
ⓘ Source: listings_history table (triggers on properties + properties_extension) + one-shot
backfill from property_details.listing_events for pre-trigger history.
Climate risk First Street
- Flood 1/10 Low 0% chance over 30 yrs
- Wildfire 1/10 Low
- Heat 5/10 Major 7 d/yr ≥105°F today · 17 d/yr by 30 yrs out
- Wind 2/10 Low
- Air quality 2/10 Low 1 unhealthy d/yr today · 1 by 30 yrs out
Nearby sold comps map
Loading sold comps map…
Walkable amenities ~0.75 mi
Loading nearby amenities…
Taxation est. · year 1
- Rental income
- $14,994
- − Mortgage interest
- −$3,809
- − Property taxes
- −$1,020
- − Insurance
- −$340
- − Repairs & maintenance
- −$1,200
- − Management
- −$1,200
- − Depreciation
- −$1,978
- Taxable income
- $5,448
- Est. tax owed @ 24.0%
- −$1,307
- After-tax cash flow
- $4,899/yr
For passive investors: Depreciation is non-cash, so a rental often shows a tax loss while cash-flowing — sheltering income. Rental losses are passive: they offset passive income freely, and up to $25,000/yr can offset ordinary (W-2) income if you actively participate and your MAGI is under $100k (phasing out to $0 by $150k); unused losses carry forward. On sale, claimed depreciation is recaptured at up to 25%, and gains may owe capital-gains tax (a 1031 exchange can defer both). Figures are a year-1 estimate at your 24.0% rate — not tax advice; consult a CPA.
Schools (NCES district)
- District
- Stafford
- NCES district ID
- 2011970
- Math proficiency
- 20% ▬ 0.00%
- Reading proficiency
- 25% ▲ 5.00%
- Median HH income
- $38,497
- Composite
- 22.02/100
- National rank
- #13537
- State rank
- #254 of 280 in KS
Livability — Stafford
- Score
- 66/100
- State rank
- #264
- US rank
- #11686
Category grades
Schools grade is shown separately in the Schools card above.
Census & demographics
- Census place
- Stafford, KS
- Population (ZIP)
- 1,033
Population outlook (Stafford County) Hauer SSP2
- Today (2025)
- 3,953 people
- By 2030
- 3,818 · -3.4%
- By 2040
- 3,609 · -8.7%
- By 2050
- 3,473 · -12.1%
- By 2075
- 3,300 · -16.5%
- By 2100
- 2,957 · -25.2%
Race, ethnicity, and origin ACS 2023
- Neighborhood character
- Predominantly White (92%)
- Race & ethnicity
- White 92% Two or more races 4% Hispanic / Latino 3%
- Common ancestry
- Iranian 3% Lithuanian 2% Slovak 2%
- Foreign-born
- 2% · Canada
- Languages at home
- 97% English-only · Spanish 1% German/W. Germanic 1%
Political lean MEDSL · Stafford
- 2024 margin
- Solid R (+64.0) · D 17.1% · R 81.1% · Other 1.8%
- 2008→2024 swing
- -18.1pp toward R · 2008: -46.0pp · 2024: -64.0pp
- All cycles
- 2024: R+64.0 2020: R+63.3 2016: R+62.7 2012: R+53.4 2008: R+46.0
Not yet ingested
- Civics
- —
Market trends
- HPI YoY
- ▲ 0.84%
- Current HPI
- 147.6352
- Rent YoY
- —
- Metro
- —
- State GDP YoY
- —
- F500 in state
- 0
Price history
2 events — show timeline
- 2026-05-20 Pending — Hays MLS
- 2026-01-06 Listed $68,000 Hays MLS
Cash-flow waterfall
monthlySold comps — $/sqft
last 12 mo · ≤1 miLoading sold comps…