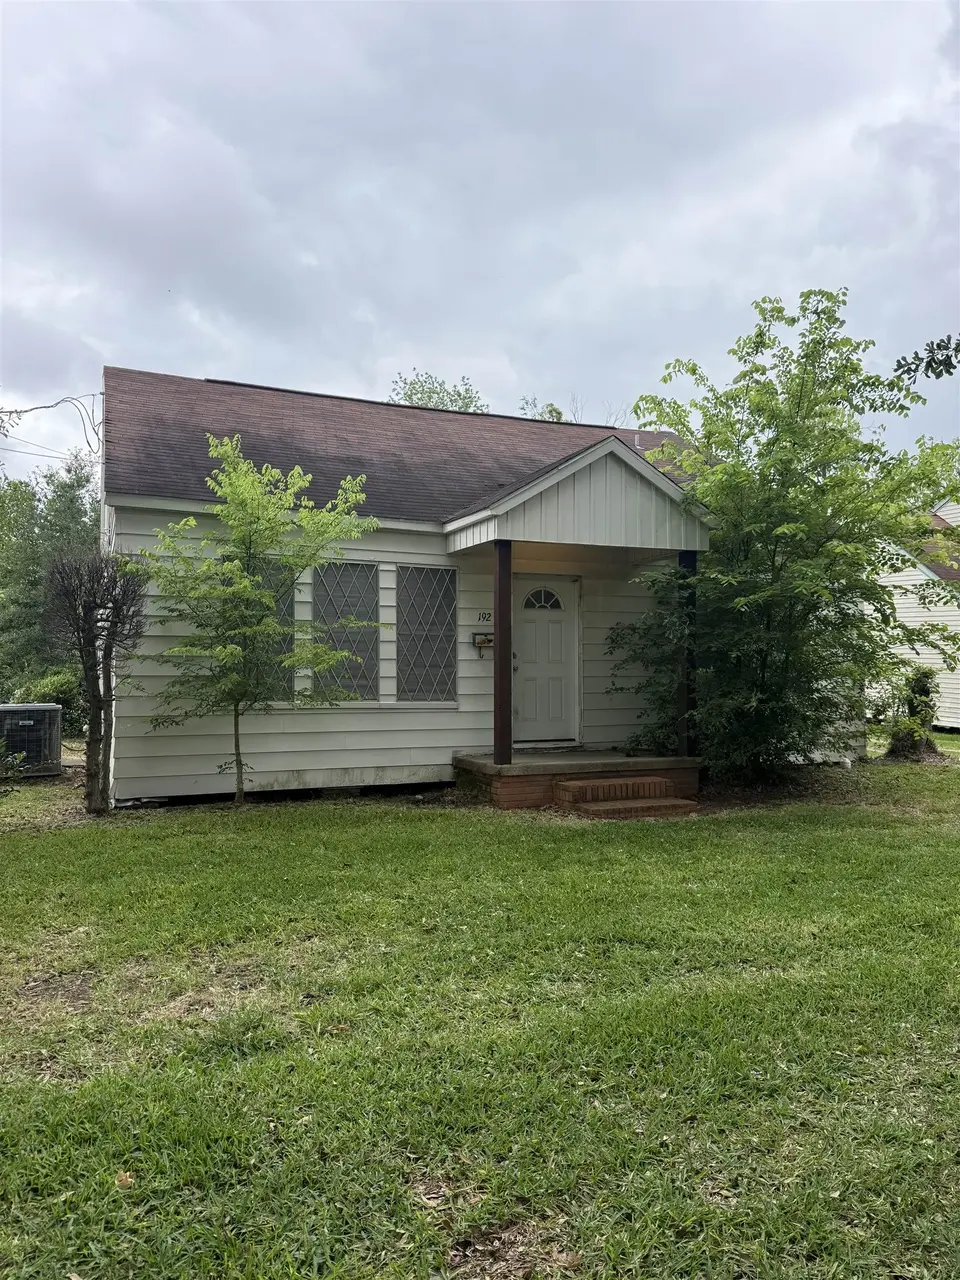
192 Hill Terrace Dr · Nederland, TX
Flood risk 7/10 · Major
- FEMA flood zone
- X
- Chance of flooding over 30 yrs
- 0.6%
- Est. flood insurance / yr
- $507 – $1,088
Fire risk 2/10 · Minimal
- Est. fire insurance / yr
- $1,222 – $2,270
Heat risk 9/10 · Severe
- Hot days now (above 110°F)
- 7 days/yr
- Hot days in 30 yrs
- 24 days/yr
Wind risk 9/10 · Severe
- Chance of severe wind over 30 yrs
- 99.0%
Air-quality risk 2/10 · Minimal
- Unhealthy air days now
- 1 days/yr
- Unhealthy air days in 30 yrs
- 1 days/yr
Risk factors via First Street. Map © Google.
Why this score? — see what drove the B- grade
The composite is a weighted blend of 9 inputs, each scored 0–100. Each bar is that input's sub-score; the figure is the points it added to the 100-point composite (weight × sub-score).
- Cash flow +21.8/30.0
- ARV discount +14.8/15.0
- DSCR +7.0/10.0
- 1% rule +6.4/10.0
- Rent growth +4.8/5.0
- Schools +4.5/10.0
- Livability +3.8/5.0
- Condition / age +2.5/5.0
- Appreciation +0.0/10.0
$115,000
🖨 Deal sheet (PDF) 📄 Offer letter ✓ Due diligence
Listing remarks MLS
This well cared for home would be perfect for an investment or starter home. Situated on a shaded lot close to everything. From the original hardwood floors throughout most of house, to the arches with beautiful wood trim going from living to dining room, this one has so much potential.
Key facts
- Large shaded lot
- Outdoor patio
- 0.25 acre lot
Tags
Property features AI
Exterior
- Parking: 1-car garage; 1-car carport
- Utilities: Public water; Public sewer
- Home design: Single-family residence; Single story
- Exterior features: Covered patio/porch; Public-maintained road
Interior
- Flooring: Wood
- Bathrooms: 1 full bathroom
- Heating & cooling: Central heating (Natural Gas); Central air conditioning
- Interior features: Wood floors; Covered porch/patio
Neighborhood map
What this means for you Summary
Snapshot
- This is a 2-bed/1.0-bath single-family listed at $115k.
Deal economics
- At list price, monthly cash flow is $113 ($1k/yr) — positive.
- The deal already cash-flows at list — no discount required.
- Meets the 1% rule at list price ($1k rent vs $115k).
- Recommended offer: $112k (3.0% below list) — sets the bar for market timing.
- Cap rate 8.2% vs local median 4.6% in Nederland — top-decile yield for the area; either an underpriced asset or a hidden risk that comps aren't pricing in. Stress-test before assuming the spread holds.
Location & tenants
- Location reads 75/100 on livability (#129 in TX, #3,906 nationally) — a middle-class / working-renter tenant base. Strengths: employment A+, cost of living A+, housing A+; Watch: amenities F, commute F.
- Nederland ISD (suburban): math 51% / reading 52% proficiency, ranked #138 of 826 in TX (top 17%) — acceptable for families but not a draw, mixed tenant base, ~2y average lease.
- Zoned schools: Hillcrest El (math 32% / reading 37%, grade F, #1,995 of 4,322 statewide, top 50%, 576 students, 69% FRL); Wilson Middle (math 61% / reading 53%, grade B, #212 of 1,662 statewide, top 13%, 812 students, 41% FRL); Nederland H S (math 49% / reading 61%, grade C, #373 of 1,632 statewide, top 23%, 1,439 students, 47% FRL) — zoned schools average 52% FRL vs 37% district-wide (15 pts higher); higher-poverty schools than district average — tighter screening recommended.
- Market conditions: Rents rising fast (+9.3%/yr); 111 active listings in the ZIP; 19 comparable units currently listed for rent nearby; rentals at typical pace (median 26d on market — plan ~3-4 weeks tenant-placement turnaround); solid renter incomes; 343 units permitted in Jefferson County in 2024 (0 in 5+ unit buildings).
Forward outlook
- Local home prices are declining (-3.0%/yr); year-one equity from $795 of loan paydown is wiped out by about $3k of value loss. Plan a longer hold.
- At projected returns (-3.0% appreciation + 8.0% rent growth), your $32k cash investment doubles in ~9 years — after that, you're playing with house money.
Negotiation context
- It's been on market 58 days — a 3% lower offer ($112k) is reasonable based on typical stale-listing flexibility.
- 2 sale attempts since 5y ago; this cycle's ask has dropped $10k (8%) from the opening price — seller is motivated, your offer sets the floor, not the list.
Risks & watch-outs
- Watch-outs: flood insurance adds $66/mo.
- Climate carrying-cost: major flood risk; severe wind risk, 99% chance of damaging wind over 30y; extreme-heat days projected 7→24/yr by 2055 (HVAC capex compounding) — expect insurance premiums to compound above CPI over the hold.
Questions for the listing agent
- It's been on market 58 days. Have you received any prior offers? Is the seller open to a 3% concession, seller financing, or rate buy-down credit?
- Built in 1962 — when were the roof, HVAC, electrical panel, plumbing, and water heater last replaced?
- What's the actual annual flood-insurance premium (NFIP or private), and is the property in a SFHA with mandatory coverage?
- Is there a deadline driving the sale (1031 exchange, divorce, estate, relocation)? That informs how much negotiation room exists.
- Schools are A-rated — typically a magnet for longer-tenancy family renters. What's the average tenant stay here, and is there a school-zone premium baked into asking?
- What's the average days-on-market for RENTAL listings here right now (not sales)? A rising rental-DOM trend means longer vacancies and softer asking-rent achievability than the comps imply.
- What's the recent tenant-quality profile in this submarket — average credit score on applications, eviction rate, late-payment / NSF rate, and stable-employment percentage? A property-management company in the area should have these aggregated.
- How much new for-sale + rental construction is in the pipeline within 1–3 miles? Heavy new supply typically softens prices + rents 12–24 months out; constrained supply supports both.
Investment metrics
- 1% rule
- 1.14% ✓
- Cap rate
- 8.16%
- Cash-on-cash
- 6.67%
- DSCR
- 1.30
- GRM
- 7.3
CMA / ARV
- ARV (median comp)
- $137,395
- List price
- $115,000
- Delta
- -16.30%
- Verdict
- UNDERPRICED
- Comps
- 13 within 1.0 mi
Show comp detail 2 sales within ~0.75 mi
| Address | Dist | Beds/Ba | Sqft | Sold | Price | $/sf | Match |
|---|---|---|---|---|---|---|---|
| 3023 Avenue G | 0.15mi | 3/1.0 (+1) | 1,000 (+1%) | 17mo | $165,000 | $165 | 72 |
| 2403 Avenue F | 0.61mi | 2/1.0 | 936 (-6%) | 22mo | $78,000 | $83 | 44 |
Match score weights: distance 35% · size 25% · config 20% · recency 20%. Top-matched comps best support the ARV.
Projected returns pro-forma
-3.0% appreciation · 8.0% rent growth · sell at horizon
- IRR
- -3.5%
- Equity multiple
- 0.86×
- Total profit
- $-4,448
- Equity at exit
- $17,147
- IRR
- 11.7%
- Equity multiple
- 2.16×
- Total profit
- $37,253
- Equity at exit
- $9,943
Cash invested: $32,200 (down + closing). Projections, not guarantees.
Landlord ↔ Tenant lean methodology
- Overall (STATE)
- 87 Strongly Landlord-Friendly
- State Texas
- 87 Strongly Landlord-Friendly · R+5
- County
- — inherits STATE
- City
- — inherits STATE
ZIP-level market 77627
- Rents YoY
- 9.3%
- Active inventory
- 111
- Price-to-rent
- 7.3×
Monthly cashflow live
- Estimated rent
- $1,310 high interval (Pro) →
- Mortgage (P&I)
- −$603
- Tax from tax record
- −$205 /mo · $2,454/yr
- Insurance
- −$48
- Flood insurance flood zone
- −$66 /mo · $798/yr
- HOA
- −$0
- Lot rent
- −$0
- Vacancy / Maint / Mgmt
- −$275
- Net cashflow
- $113
Break-even live
Sensitivity live
| Price | -10% $178 | -5% $145 | +0% $113 | +5% $80 | +10% $47 |
|---|---|---|---|---|---|
| Rent | -10% $9 | -5% $61 | +0% $113 | +5% $164 | +10% $216 |
| Rate | -1.0pp $170 | -0.5pp $142 | base $113 | +0.5pp $83 | +1.0pp $52 |
UW: 25.0% down · 7.5% · 30yr · 1.5% tax · 5.0% vac · 8.0% maint · 8.0% mgmt
Financing live
Cash to close
- Down payment
- $28,750
- Closing costs
- $3,450
- Reserves months
- —
- Total cash needed
- —
Loan-product check · same deal, 3 products live
Conventional
25% down · 7.5% · 30yr
- Down + closing
- —
- Monthly P&I
- —
- Monthly cashflow
- —
- DSCR
- —
- Eligible?
- —
Personal DTI + credit; lowest rate.
DSCR
20% down · 8.5% · 30yr
- Down + closing
- —
- Monthly P&I
- —
- Monthly cashflow
- —
- DSCR
- —
- Eligible?
- —
No personal income docs; deal must DSCR.
Hard money
10% down · 12.0% · 12mo
- Down + closing
- —
- Monthly P&I
- —
- Monthly cashflow
- —
- DSCR
- —
- Eligible?
- —
Short-term bridge; refi at stabilization.
Rent comps 19 comps
| Address | Beds | Baths | Sqft | Rent | $/sqft | DOM | Units | Dist |
|---|---|---|---|---|---|---|---|---|
| 1212 S 36th St Nederland, TX | 3.0 | 1.0 | 1000 | $1,650 | $1.65 | 16d | 1 | 0.28mi |
| 303 Hardy Ave Unit 3 Nederland, TX | 1.0 | 1.0 | 700 | $850 | $1.21 | 46d | 1 | 0.42mi |
| 224 S 35th St Nederland, TX | 3.0 | 1.0 | 1000 | $1,600 | $1.60 | 25d | 1 | 0.42mi |
| 531 S 28th St Unit B Nederland, TX | 1.0 | 1.0 | 600 | $750 | $1.25 | 16d | 1 | 0.46mi |
| 531 S 28th St Unit B Nederland, TX | 1.0 | 1.0 | 660 | $750 | $1.14 | 25d | 1 | 0.46mi |
| 2604 Avenue C Unit C Nederland, TX | 3.0 | 2.0 | 1008 | $1,795 | $1.78 | 46d | 1 | 0.61mi |
| 2561 95th St Port Arthur, TX | 1.0 | 1.0 | 579 | $985 | $1.70 | 16d | 1 | 0.62mi |
| 2555 95th St Port Arthur, TX | 1.0–2.0 | 1.0–2.0 | 831 | $1,490 | $1.79 | 16d | 61 | 0.64mi |
| 8849 Pinewood Dr Port Arthur, TX | 1.0–3.0 | 1.0–2.0 | 990 | $1,830 | $1.85 | 16d | 1 | 0.69mi |
| 1924 Avenue H Unit H Nederland, TX | 2.0 | 1.0 | 900 | $1,000 | $1.11 | 46d | 1 | 0.87mi |
| 209 N 22nd St Unit 1 Nederland, TX | 2.0 | 1.0 | 900 | $1,100 | $1.22 | 46d | 1 | 0.96mi |
| 1619 Avenue G Unit G Nederland, TX | 3.0 | 1.5 | 1100 | $1,750 | $1.59 | 25d | 1 | 1.01mi |
| 3527 Helena Ave Nederland, TX | 2.0 | 2.5 | 1088 | $1,200 | $1.10 | 46d | 1 | 1.01mi |
| 2901 Helena Ave Nederland, TX | 1.0 | 1.0 | 720 | $850 | $1.18 | 16d | 1 | 1.04mi |
| 7901 Heatherbrook Trl Unit 190 Port Arthur, TX | 2.0 | 1.0 | 988 | $1,425 | $1.44 | 23d | 1 | 1.38mi |
| 7901 Heatherbrook Trl Apt 3 Port Arthur, TX | 1.0 | 1.0 | 812 | $1,325 | $1.63 | 46d | 1 | 1.38mi |
| 7901 Heatherbrook Trl Unit 57 Port Arthur, TX | 2.0 | 1.0 | 988 | $1,425 | $1.44 | 16d | 1 | 1.39mi |
| 1820 Helena Ave Nederland, TX | 2.0 | 1.0 | 840 | $1,100 | $1.31 | 16d | 1 | 1.43mi |
| 1820 Helena Ave Nederland, TX | 2.0 | 1.0 | 820 | $1,150 | $1.40 | 46d | 1 | 1.43mi |
Listing history 21 events
-
2026-06-21days on market $115,000 Active 58 DOM
-
2026-06-18days on market $115,000 Active 55 DOM
-
2026-06-17days on market $115,000 Active 54 DOM
-
2026-06-16days on market $115,000 Active 53 DOM
-
2026-06-15days on market $115,000 Active 52 DOM
-
2026-06-14days on market $115,000 Active 50 DOM
-
2026-06-13days on market $115,000 Active 49 DOM
-
2026-06-10days on market $115,000 Active 47 DOM
-
2026-06-09days on market $115,000 Active 46 DOM
-
2026-06-08days on market $115,000 Active 45 DOM
-
2026-06-07days on market $115,000 Active 44 DOM
-
2026-06-05days on market $115,000 Active 41 DOM
-
2026-06-03days on market $115,000 Active 40 DOM
-
2026-06-02pricedays on market $115,000 Active 39 DOM
-
2026-06-01days on market $125,000 Active 38 DOM
-
2026-05-31days on market $125,000 Active 37 DOM
-
2026-05-30days on market $125,000 Active 36 DOM
-
2026-04-24$125,000 Active 263-char remark
-
2023-02-14soldstatus
-
2021-06-21soldstatus 287-char remark
Show marketing remark (287 chars)
This well cared for home would be perfect for an investment or starter home. Situated on a shaded lot close to everything. From the original hardwood floors throughout most of house, to the arches with beautiful wood trim going from living to dining room, this one has so much potential.
-
2021-06-10$69,000 287-char remark
Show marketing remark (287 chars)
This well cared for home would be perfect for an investment or starter home. Situated on a shaded lot close to everything. From the original hardwood floors throughout most of house, to the arches with beautiful wood trim going from living to dining room, this one has so much potential.
ⓘ Source: listings_history table (triggers on properties + properties_extension) + one-shot
backfill from property_details.listing_events for pre-trigger history.
Tax reassessment forecast TX · Resets to sale price
- Current annual tax
- $2,454 · $205/mo
- Projected year-2 tax
- $2,454 · $205/mo
- Expected delta
- $0/yr ($0/mo · 0.0%)
ⓘ Screening estimate from a state-policy table — verify with the county assessor before closing.
Climate risk First Street
- Flood 7/10 Severe FEMA zone X · 60% chance over 30 yrs
- Wildfire 2/10 Low
- Heat 9/10 Extreme 7 d/yr ≥110°F today · 24 d/yr by 30 yrs out
- Wind 9/10 Extreme 99% chance of damaging wind over 30 yrs
- Air quality 2/10 Low 1 unhealthy d/yr today · 1 by 30 yrs out
Nearby sold comps map
Loading sold comps map…
Walkable amenities ~0.75 mi
Loading nearby amenities…
Taxation est. · year 1
- Rental income
- $15,714
- − Mortgage interest
- −$6,442
- − Property taxes
- −$2,454
- − Insurance
- −$1,372
- − Repairs & maintenance
- −$1,257
- − Management
- −$1,257
- − Depreciation
- −$3,345
- Taxable loss
- −$414
- Est. tax savings @ 24.0%
- +$99
- After-tax cash flow
- $1,450/yr
For passive investors: Depreciation is non-cash, so a rental often shows a tax loss while cash-flowing — sheltering income. Rental losses are passive: they offset passive income freely, and up to $25,000/yr can offset ordinary (W-2) income if you actively participate and your MAGI is under $100k (phasing out to $0 by $150k); unused losses carry forward. On sale, claimed depreciation is recaptured at up to 25%, and gains may owe capital-gains tax (a 1031 exchange can defer both). Figures are a year-1 estimate at your 24.0% rate — not tax advice; consult a CPA.
Schools (NCES district)
- District
- Nederland ISD
- NCES district ID
- 4832280
- Math proficiency
- 51% ▼ -3.00%
- Reading proficiency
- 52% ▼ -3.00%
- Median HH income
- $59,647
- Composite
- 44.95/100
- National rank
- #2709
- State rank
- #138 of 826 in TX
Livability — Nederland
- Score
- 75/100
- State rank
- #129
- US rank
- #3906
Category grades
Schools grade is shown separately in the Schools card above.
Census & demographics
- Census place
- Nederland, TX
- County
- Jefferson County · 203,592 people
- City population
- 22,357
- Metro
- Beaumont-Port Arthur, TX
- Population (ZIP)
- 22,357
- Household income
- $78,001
- Rent vs Own
- Severe rent burden
- 572.0
Population outlook (Jefferson County) Hauer SSP2
- Today (2025)
- 259,015 people
- By 2030
- 260,685 · +0.6%
- By 2040
- 263,309 · +1.7%
- By 2050
- 265,237 · +2.4%
- By 2075
- 270,193 · +4.3%
- By 2100
- 255,628 · -1.3%
Race, ethnicity, and origin ACS 2023
- Neighborhood character
- Predominantly White (78%)
- Race & ethnicity
- White 78% Hispanic / Latino 12% Two or more races 8% Black 4% Asian 3%
- Hispanic origin (detail)
- Mexican 8%
- Common ancestry
- Lithuanian 10% Slovak 3% Italian 2%
- Foreign-born
- 5% · Canada, Vietnam
- Languages at home
- 87% English-only · Spanish 8% Other Indo-European 1% Vietnamese 1%
Political lean MEDSL · Jefferson
- 2024 margin
- Lean R (+8.9) · D 45.1% · R 54.0%
- 2008→2024 swing
- -11.1pp toward R · 2008: 2.2pp · 2024: -8.9pp
- All cycles
- 2024: R+8.9 2020: R+1.6 2016: R+0.5 2012: D+1.6 2008: D+2.2
Not yet ingested
- Civics
- —
Market trends
- HPI YoY
- ▼ -228.91%
- Current HPI
- 176.2132
- Rent YoY
- ▲ 9.27%
- Metro
- Beaumont-Port Arthur, TX
- State GDP YoY
- ▲ 3.95%
- F500 in state
- 110
Industry mix (Fortune 500 HQ in TX)
| Industry | F500 HQs | Revenue |
|---|---|---|
| Energy | 16 | $1,198B |
|
||
| Technology | 5 | $198B |
|
||
| Engineering / Construction | 4 | $72B |
|
||
| Energy Services | 3 | $60B |
|
||
| Utilities | 3 | $41B |
|
||
| Healthcare | 2 | $330B |
|
||
Price history
+66.7% since first listed5 events — show timeline
- 2026-06-01 Price Changed $115,000 BBOR
- 2026-04-24 Listed $125,000 BBOR
- 2023-02-14 Sold (Public Records) — Public Records
- 2021-06-21 Sold (MLS) — BBOR
- 2021-06-10 Listed $69,000 BBOR
Property tax history
+5.0%/yrLatest (2025): $2,454 · -2.3% YoY. Source: county tax records.
Cash-flow waterfall
monthlySold comps — $/sqft
last 12 mo · ≤1 miLoading sold comps…