487 County Road 585 · Cedar Bluff, AL
Flood risk 1/10 · Minimal
- FEMA flood zone
- X (unshaded)
- Chance of flooding over 30 yrs
- 0.0%
- Est. flood insurance / yr
- $473 – $860
Fire risk 4/10 · Minor
- Est. fire insurance / yr
- $916 – $1,700
Heat risk 5/10 · Moderate
- Hot days now (above 107°F)
- 7 days/yr
- Hot days in 30 yrs
- 18 days/yr
Wind risk 4/10 · Minor
- Chance of severe wind over 30 yrs
- 19.0%
Air-quality risk 2/10 · Minimal
- Unhealthy air days now
- 1 days/yr
- Unhealthy air days in 30 yrs
- 1 days/yr
Risk factors via First Street. Map © Google.
Why this score? — see what drove the D- grade
The composite is a weighted blend of 9 inputs, each scored 0–100. Each bar is that input's sub-score; the figure is the points it added to the 100-point composite (weight × sub-score).
- ARV discount +15.0/15.0
- Appreciation +10.0/10.0
- Cash flow +3.7/30.0
- Livability +3.2/5.0
- Schools +2.7/10.0
- Rent growth +2.5/5.0
- Condition / age +2.5/5.0
- 1% rule +0.0/10.0
- DSCR +0.0/10.0
$350,000
🖨 Deal sheet 📄 Offer letter ✓ Due diligence
Listing remarks
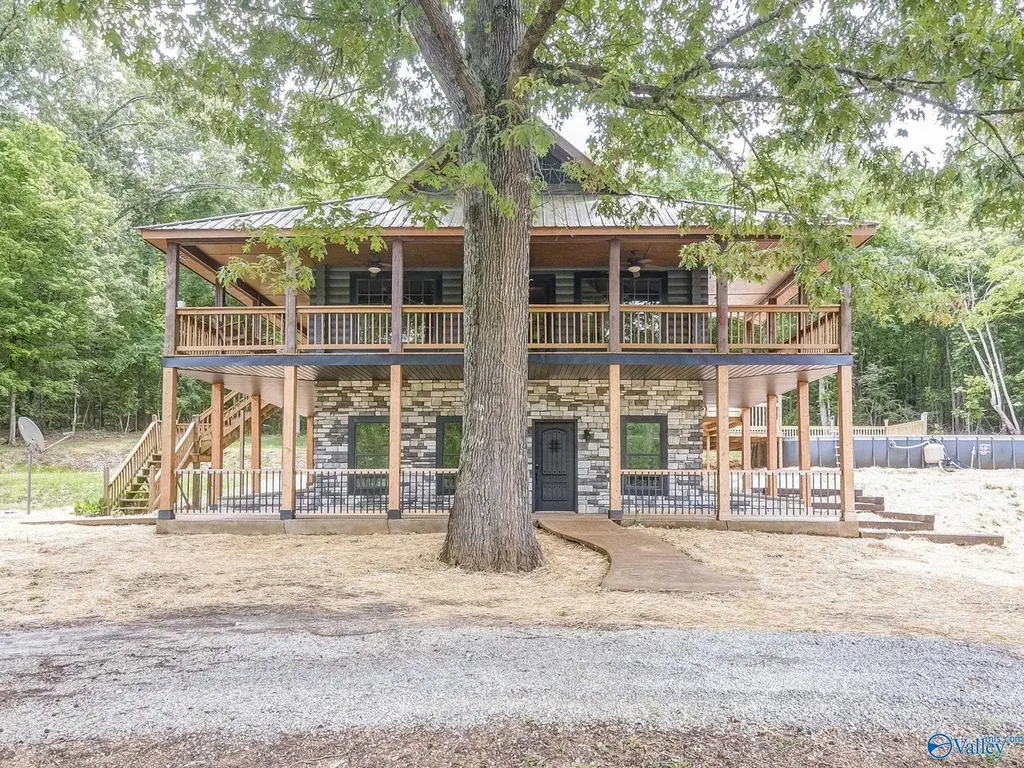
4 bed 2.5 bath home on 1.84 acres in Cedar Bluff, directly across from Weiss Lake! Incredible wraparound porches on both levels. The wood and rock siding add a unique, custom touch. Inside, you’ll find hardwood floors throughout, a kitchen featuring granite countertops and a new backsplash, and a stunning rock fireplace that serves as the focal point of the living room—complemented by abundant natural light. Master suite is located on the main level and includes a second living area, offering flexibility and comfort. Outside you will find the pool with a brand-new deck, a detached 3-bay garage, and beautifully matured trees that provide shade and enhance the natural beauty of th
Key facts
- 1.84 acre lot
- Garage
- Listed 44 days
Property features AI
Finance
- Other: Living area listed as 2,592 square feet
- HOA & community: No association; Subdivision: Metes And Bounds
Exterior
- Parking: Detached garage
- Utilities: Public water; Septic sewer
- Home design: Single-family residence; Three or more levels; Residential property; Not new construction
- Construction: Slab foundation
- Exterior features: Approximately 1.84-acre lot; Public water; Septic tank
Interior
- Bathrooms: Two full bathrooms; One half bathroom
- Heating & cooling: Central heating; Central cooling; Heating and cooling present
- Interior features: One fireplace
Neighborhood map
What this means for you Summary
Snapshot
- This is a 4-bed/2.0-bath single-family listed at $350k.
Deal economics
- At list price, monthly cash flow is $-1k ($-12k/yr) — negative.
- To cash-flow at today's rent, offer at most $169k (51.8% below list).
- To meet the 1% rule (rent ≥ 1% of price), the offer needs to be $132k (62.3% below list).
- Recommended offer: $132k (62.3% below list) — sets the bar for 1% rule.
- Cap rate 2.8% vs local median 0.9% in Cedar Bluff — top-decile yield for the area; either an underpriced asset or a hidden risk that comps aren't pricing in. Stress-test before assuming the spread holds.
Location & tenants
- Location reads 64/100 on livability (#152 in AL) — a middle-class / working-renter tenant base. Strengths: cost of living A+, housing A+; Watch: schools D, amenities F, commute F.
- Cherokee County (rural): math 21% / reading 45% proficiency, ranked #58 of 129 in AL (top 45%) — families likely to look elsewhere, expect single-tenant / working-renter base with shorter leases.
- Market conditions: 252 active listings in the ZIP; 39 units permitted in Cherokee County in 2024 (0 in 5+ unit buildings).
Forward outlook
- In year one you build about $37k of equity ($2k loan paydown + $35k appreciation (10.0% local appreciation)).
- Cherokee County population projected at -17% by 2050 — secular population decline; favor cash flow + early exit over multi-decade hold.
- By year 2, paydown + projected appreciation supports a ~$60k cash-out refi (75% LTV) — recoverable capital for the next deal without selling this one.
Negotiation context
- It's been on market 45 days — a 3% lower offer ($340k) is reasonable based on typical stale-listing flexibility.
Risks & watch-outs
- Climate carrying-cost: extreme-heat days projected 7→18/yr by 2055 (HVAC capex compounding) — expect insurance premiums to compound above CPI over the hold.
Questions for the listing agent
- What do current leases actually rent for vs. the listed asking? Can we see a recent rent roll and the last 12 months of T-12 income?
- It's been on market 45 days. Have you received any prior offers? Is the seller open to a 62% concession, seller financing, or rate buy-down credit?
- Is there a deadline driving the sale (1031 exchange, divorce, estate, relocation)? That informs how much negotiation room exists.
- Schools are D-rated, which usually means shorter tenancies and higher turnover. Who's the typical renter profile here, and what's been the actual vacancy rate?
- The area grade is low — what's the realistic commute time and amenity access for the typical tenant pool here? Any planned neighborhood developments (good or bad) we should know about?
- What's the average days-on-market for RENTAL listings here right now (not sales)? A rising rental-DOM trend means longer vacancies and softer asking-rent achievability than the comps imply.
- What's the recent tenant-quality profile in this submarket — average credit score on applications, eviction rate, late-payment / NSF rate, and stable-employment percentage? A property-management company in the area should have these aggregated.
- How much new for-sale + rental construction is in the pipeline within 1–3 miles? Heavy new supply typically softens prices + rents 12–24 months out; constrained supply supports both.
Investment metrics
- 1% rule
- 0.38% ✗
- Cap rate
- 2.77%
- Cash-on-cash
- -12.58%
- DSCR
- 0.44
- GRM
- 22.1
CMA / ARV
- ARV (median comp)
- $461,466
- List price
- $350,000
- Delta
- -24.15%
- Verdict
- UNDERPRICED
- Comps
- 6 within 1.0 mi
Show comp detail 1 sale within ~0.75 mi
| Address | Dist | Beds/Ba | Sqft | Sold | Price | $/sf | Match |
|---|---|---|---|---|---|---|---|
| 260 County Road 714 | 0.56mi | 3/2.0 (-1) | 2,192 (+1%) | 8mo | $207,000 | $94 | 60 |
Match score weights: distance 35% · size 25% · config 20% · recency 20%. Top-matched comps best support the ARV.
Projected returns pro-forma
10.0% appreciation · 3.0% rent growth · sell at horizon
- IRR
- 15.5%
- Equity multiple
- 2.28×
- Total profit
- $125,006
- Equity at exit
- $315,308
- IRR
- 15.0%
- Equity multiple
- 5.28×
- Total profit
- $419,177
- Equity at exit
- $679,973
Cash invested: $98,000 (down + closing). Projections, not guarantees.
Landlord ↔ Tenant lean methodology
- Overall (STATE)
- 90 Strongly Landlord-Friendly
- State Alabama
- 90 Strongly Landlord-Friendly · R+15
- County
- — inherits STATE
- City
- — inherits STATE
ZIP-level market 35959
- Home prices YoY
- 6.8%
- Active inventory
- 252
- Price-to-rent
- 22.1×
Monthly cashflow live
- Estimated rent
- $1,318 medium interval (Pro) →
- Mortgage (P&I)
- −$1,835
- Tax from tax record
- −$87 /mo · $1,046/yr
- Insurance
- −$146
- HOA
- −$0
- Vacancy / Maint / Mgmt
- −$277
- Net cashflow
- $-1,027
Break-even live
UW: 25.0% down · 7.5% · 30yr · 1.5% tax · 5.0% vac · 8.0% maint · 8.0% mgmt
Financing live
Cash to close
- Down payment
- $87,500
- Closing costs
- $10,500
- Reserves months
- —
- Total cash needed
- —
Loan-product check · same deal, 3 products live
Conventional
25% down · 7.5% · 30yr
- Down + closing
- —
- Monthly P&I
- —
- Monthly cashflow
- —
- DSCR
- —
- Eligible?
- —
Personal DTI + credit; lowest rate.
DSCR
20% down · 8.5% · 30yr
- Down + closing
- —
- Monthly P&I
- —
- Monthly cashflow
- —
- DSCR
- —
- Eligible?
- —
No personal income docs; deal must DSCR.
Hard money
10% down · 12.0% · 12mo
- Down + closing
- —
- Monthly P&I
- —
- Monthly cashflow
- —
- DSCR
- —
- Eligible?
- —
Short-term bridge; refi at stabilization.
Listing history 19 events
-
2026-06-19days on market $350,000 Active 45 DOM
-
2026-06-18days on market $350,000 Active 44 DOM
-
2026-06-17price $350,000 Active 43 DOM
-
2026-06-17days on market $375,000 Active 43 DOM
-
2026-06-16days on market $375,000 Active 42 DOM
-
2026-06-15days on market $375,000 Active 41 DOM
-
2026-06-14days on market $375,000 Active 39 DOM
-
2026-06-13days on market $375,000 Active 38 DOM
-
2026-06-10days on market $375,000 Active 36 DOM
-
2026-06-09days on market $375,000 Active 35 DOM
-
2026-06-08days on market $375,000 Active 34 DOM
-
2026-06-07days on market $375,000 Active 33 DOM
-
2026-06-05days on market $375,000 Active 30 DOM
-
2026-06-03days on market $375,000 Active 29 DOM
-
2026-06-02days on market $375,000 Active 28 DOM
-
2026-06-01days on market $375,000 Active 27 DOM
-
2026-05-31days on market $375,000 Active 26 DOM
-
2026-05-30days on market $375,000 Active 25 DOM
-
2026-05-05$375,000 Active 708-char remark
ⓘ Source: listings_history table (triggers on properties + properties_extension) + one-shot
backfill from property_details.listing_events for pre-trigger history.
Tax reassessment forecast AL · Resets to sale price
- Current annual tax
- $1,046 · $87/mo
- Projected year-2 tax
- $1,435 · $120/mo
- Expected delta
- +$389/yr (+$32/mo · 37.2%)
ⓘ Screening estimate from a state-policy table — verify with the county assessor before closing.
Climate risk First Street
- Flood 1/10 Low FEMA zone X (unshaded) · 0% chance over 30 yrs
- Wildfire 4/10 Moderate
- Heat 5/10 Major 7 d/yr ≥107°F today · 18 d/yr by 30 yrs out
- Wind 4/10 Moderate 19% chance of damaging wind over 30 yrs
- Air quality 2/10 Low 1 unhealthy d/yr today · 1 by 30 yrs out
Nearby sold comps map
Loading sold comps map…
Walkable amenities ~0.75 mi
Loading nearby amenities…
Taxation est. · year 1
- Rental income
- $15,817
- − Mortgage interest
- −$19,605
- − Property taxes
- −$1,046
- − Insurance
- −$1,750
- − Repairs & maintenance
- −$1,265
- − Management
- −$1,265
- − Depreciation
- −$10,182
- Taxable loss
- −$19,297
- Est. tax savings @ 24.0%
- +$4,631
- After-tax cash flow
- $-7,694/yr
For passive investors: Depreciation is non-cash, so a rental often shows a tax loss while cash-flowing — sheltering income. Rental losses are passive: they offset passive income freely, and up to $25,000/yr can offset ordinary (W-2) income if you actively participate and your MAGI is under $100k (phasing out to $0 by $150k); unused losses carry forward. On sale, claimed depreciation is recaptured at up to 25%, and gains may owe capital-gains tax (a 1031 exchange can defer both). Figures are a year-1 estimate at your 24.0% rate — not tax advice; consult a CPA.
Schools (NCES district)
- District
- Cherokee County
- NCES district ID
- 0100630
- Math proficiency
- 21% ▼ -25.00%
- Reading proficiency
- 45% ▲ 4.00%
- Median HH income
- $37,824
- Composite
- 27.43/100
- National rank
- #6965
- State rank
- #58 of 129 in AL
Livability — Cedar Bluff
- Score
- 64/100
- State rank
- #152
- US rank
- #13868
Category grades
Schools grade is shown separately in the Schools card above.
Census & demographics
- Population (ZIP)
- 4,431
Population outlook (Cherokee County) Hauer SSP2
- Today (2025)
- 24,929 people
- By 2030
- 24,177 · -3.0%
- By 2040
- 22,411 · -10.1%
- By 2050
- 20,595 · -17.4%
- By 2075
- 17,025 · -31.7%
- By 2100
- 13,700 · -45.0%
Race, ethnicity, and origin ACS 2023
- Neighborhood character
- Predominantly White (91%)
- Race & ethnicity
- White 91% Black 5% Two or more races 4% Hispanic / Latino 2%
- Common ancestry
- Iranian 3% Slovak 1% Lithuanian 1%
- Foreign-born
- 1%
- Languages at home
- 99% English-only · French/Haitian/Cajun 1%
Political lean MEDSL · Cherokee
- 2024 margin
- Solid R (+75.5) · D 12.0% · R 87.5%
- 2008→2024 swing
- -24.3pp toward R · 2008: -51.2pp · 2024: -75.5pp
- All cycles
- 2024: R+75.5 2020: R+72.8 2016: R+69.4 2012: R+55.0 2008: R+51.2
Not yet ingested
- Civics
- —
Market trends
- HPI YoY
- ▲ 20.20%
- Current HPI
- 318.9
- Rent YoY
- —
- Metro
- —
- State GDP YoY
- ▲ 2.94%
- F500 in state
- 4
Industry mix (Fortune 500 HQ in AL)
| Industry | F500 HQs | Revenue |
|---|---|---|
| Financial Services | 1 | $8B |
|
||
| Healthcare | 1 | $5B |
|
||
Price history
-6.7% since first listed2 events — show timeline
- 2026-06-17 Price Changed $350,000 VMLS
- 2026-05-05 Listed $375,000 VMLS
Property tax history
+4.1%/yrLatest (2025): $1,046 · +0.6% YoY. Source: county tax records.
Cash-flow waterfall
monthlySold comps — $/sqft
last 12 mo · ≤1 miLoading sold comps…