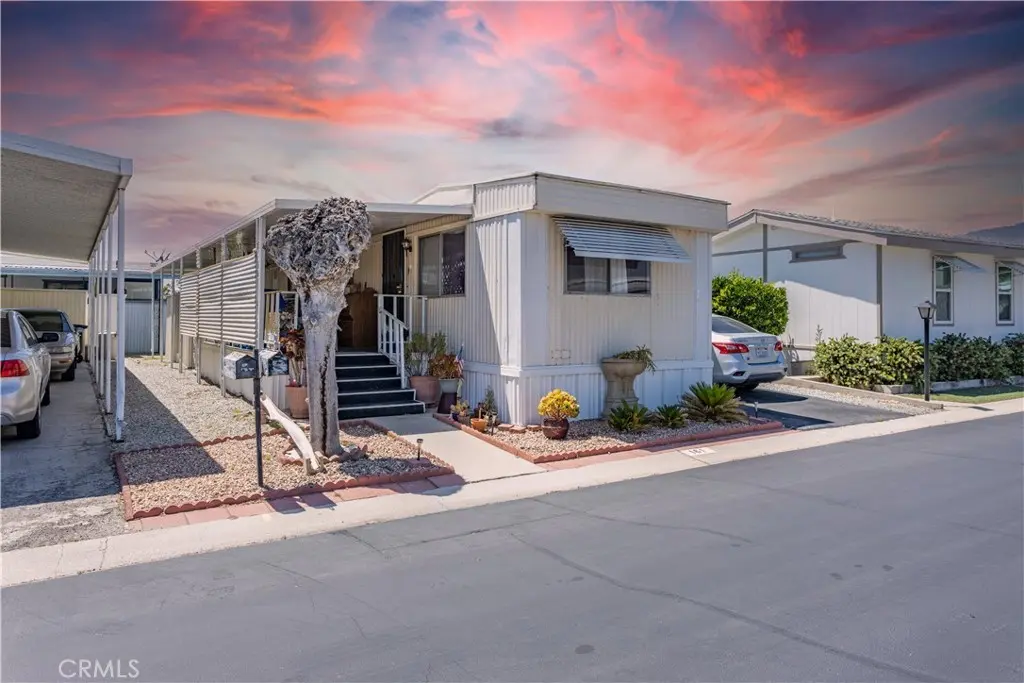
575 S Lyon Ave #161 · Hemet, CA
Flood risk 1/10 · Minimal
- FEMA flood zone
- X (unshaded)
- Chance of flooding over 30 yrs
- 0.0%
- Est. flood insurance / yr
- $507 – $1,088
Fire risk 6/10 · Moderate
- Est. fire insurance / yr
- $659 – $1,223
Heat risk 7/10 · Major
- Hot days now (above 104°F)
- 6 days/yr
- Hot days in 30 yrs
- 17 days/yr
Wind risk 1/10 · Minimal
- Chance of severe wind over 30 yrs
- —
Air-quality risk 6/10 · Moderate
- Unhealthy air days now
- 9 days/yr
- Unhealthy air days in 30 yrs
- 11 days/yr
Risk factors via First Street. Map © Google.
Why this score? — see what drove the D grade
The composite is a weighted blend of 9 inputs, each scored 0–100. Each bar is that input's sub-score; the figure is the points it added to the 100-point composite (weight × sub-score).
- Cash flow +15.0/30.0
- ARV discount +7.5/15.0
- 1% rule +5.0/10.0
- DSCR +5.0/10.0
- Rent growth +2.9/5.0
- Livability +2.6/5.0
- Schools +2.5/10.0
- Condition / age +2.5/5.0
- Appreciation +0.0/10.0
$39,000
🖨 Deal sheet (PDF) 📄 Offer letter ✓ Due diligence
Listing remarks MLS
Resort-Style Amenities, Perfect 55+ Retreat! Welcome, charming single-wide manufactured home, thoughtfully designed for comfort and convenience. Step inside and find vinyl flooring that offers the beauty of hardwood with easy upkeep. Custom countertops add a touch of elegance to your daily routine, while 2 cozy bedrooms & a well-appointed bathroom provide a right amount of space. Stay comfortable all year with central cooling/heating, enjoy the 2-car carport for sheltered parking. The community is a standout, with on-site management and maintenance team. Amenities: Clubhouse & Banquet Hall, perfect for socials & family gatherings. Billiard & Card Room, keep active and engaged. Heated Pool & Spa, relax in comfort any season. Picnic Area, enjoy alfresco dining in a peaceful setting. Laundry Facility, added convenience just steps away. Dog Park, your furry best friend is welcome too! Experience the best of 55+ livingwhere home is cozy, amenities are abundant, and you feel taken care of.
Key facts
- 2 car carport
- Vinyl flooring
- Laundry facility
Tags
Property features AI
Finance
- Other: Sidewalks in the community; Lot estimated at 0-1 unit/acre
- HOA & community: Part of an association (senior community); Monthly association fee of $625; Association amenities include: pool, club house, card room, sauna, billiard room, banquet facilities, recreational/multipurpose room, picnic area, dog park
Exterior
- Utilities: Public sewer; District/Public water
- Home design: Manufactured house; Single-story; Entry at front door
- Construction: No ADU; Public records used for year built
- Exterior features: Association pool
Interior
- Bedrooms: 2 bedrooms on the main level
- Flooring: Vinyl flooring
- Bathrooms: 1 full bathroom
- Heating & cooling: Central furnace heating; Central air conditioning
- Interior features: Front door entry; Single-level home (one story); All bedrooms on the main floor
- Laundry & utility: Community laundry
Neighborhood map
What this means for you Summary
Snapshot
- This is a 2-bed/2.0-bath manufactured listed at $39k.
Deal economics
- At list price, monthly cash flow is $462 ($6k/yr) — positive.
- The deal already cash-flows at list — no discount required.
- Meets the 1% rule at list price ($2k rent vs $39k).
- Recommended offer: $38k (1.5% below list) — sets the bar for market timing.
- Cap rate 20.5% vs local median 4.9% in Hemet — top-decile yield for the area; either an underpriced asset or a hidden risk that comps aren't pricing in. Stress-test before assuming the spread holds.
Location & tenants
- Location reads 51/100 on livability (#1,056 in CA) — a working-class tenant base; expect higher turnover. Strengths: housing A+; Watch: crime D+, schools F, amenities F.
- Hemet Unified (suburban): math 19% / reading 41% proficiency, ranked #360 of 517 in CA (top 70%) — families likely to look elsewhere, expect single-tenant / working-renter base with shorter leases; 66% free/reduced lunch — lower-income household profile, screen leases tightly.
- Market conditions: Rents rising (+1.8%/yr); 264 active listings in the ZIP; 15 comparable units currently listed for rent nearby; rentals leasing fast (median 3d on market — plan ~1-2 weeks tenant-placement turnaround); 9,195 units permitted in Riverside County in 2024 (1,512 in 5+ unit buildings).
- This rent runs 42% of the median local income ($49k/yr) — at the standard rent-burdened threshold; future hikes will face affordability resistance.
Forward outlook
- Local home prices are declining (-3.0%/yr); year-one equity from $270 of loan paydown is wiped out by about $1k of value loss. Plan a longer hold.
- Riverside County population projected at +22% by 2050 — long-run rental-demand tailwind backs the buy-and-hold thesis.
- At projected returns (-3.0% appreciation + 1.8% rent growth), your $11k cash investment doubles in ~3 years — after that, you're playing with house money.
Negotiation context
- It's been on market 30 days — a 2% lower offer ($38k) is reasonable based on typical stale-listing flexibility.
- 2 sale attempts with the ask held roughly flat each time — persistent listings suggest the price (not the market) is what's stuck; bring a comps-based counter.
Risks & watch-outs
- Watch-outs: HOA is 36% of rent.
- Climate carrying-cost: major wildfire risk; extreme-heat days projected 6→17/yr by 2055 (HVAC capex compounding) — expect insurance premiums to compound above CPI over the hold.
Questions for the listing agent
- Built in 1973 — when were the roof, HVAC, electrical panel, plumbing, and water heater last replaced?
- What does the HOA fee cover, when was the last increase, and are there any pending special assessments or reserve-fund shortfalls?
- Is there a deadline driving the sale (1031 exchange, divorce, estate, relocation)? That informs how much negotiation room exists.
- Schools are F-rated, which usually means shorter tenancies and higher turnover. Who's the typical renter profile here, and what's been the actual vacancy rate?
- Crime grade is D in this area — have there been break-ins, vandalism, or insurance claims at this property in the last 3 years? What carrier currently insures it and at what premium?
- The area grade is low — what's the realistic commute time and amenity access for the typical tenant pool here? Any planned neighborhood developments (good or bad) we should know about?
- What's the average days-on-market for RENTAL listings here right now (not sales)? A rising rental-DOM trend means longer vacancies and softer asking-rent achievability than the comps imply.
- What's the recent tenant-quality profile in this submarket — average credit score on applications, eviction rate, late-payment / NSF rate, and stable-employment percentage? A property-management company in the area should have these aggregated.
- How much new for-sale + rental construction is in the pipeline within 1–3 miles? Heavy new supply typically softens prices + rents 12–24 months out; constrained supply supports both.
Investment metrics
- 1% rule
- 4.40% ✓
- Cap rate
- 20.50%
- Cash-on-cash
- 50.72%
- DSCR
- 3.26
- GRM
- 1.9
CMA / ARV
- ARV (on-the-fly)
- $85,344
- Comps found
- 12
Show comp detail 12 sales within ~0.75 mi
| Address | Dist | Beds/Ba | Sqft | Sold | Price | $/sf | Match |
|---|---|---|---|---|---|---|---|
| 270 Santa Clara Cir | 0.51mi | 2/1.0 | 672 (0%) | 9mo | $103,000 | $153 | 65 |
| 281 Santa Clara Cir | 0.51mi | 2/1.0 | 684 (+2%) | 13mo | $139,000 | $203 | 58 |
| 1200 W Johnston | 0.54mi | 2/1.0 | 720 (+7%) | 1mo | $87,000 | $121 | 58 |
| 858 S Lyon Ave | 0.36mi | 2/1.0 | 720 (+7%) | 12mo | $63,000 | $88 | 57 |
| 590 Santa Clara Cir | 0.52mi | 2/1.0 | 640 (-5%) | 10mo | $120,000 | $188 | 56 |
| 893 S Palm | 0.69mi | 2/1.0 | 720 (+7%) | 3mo | $90,000 | $125 | 49 |
| 631 Santa Clara | 0.54mi | 1/1.0 (-1) | 750 (+12%) | 2mo | $118,000 | $157 | 45 |
| 2750 W Acacia Ave Unit M15 | 0.71mi | 1/1.0 (-1) | 650 (-3%) | 11mo | $44,000 | $68 | 43 |
| 1630 W Johnston Ave | 0.40mi | 2/1.0 | 760 (+13%) | 15mo | $65,000 | $86 | 43 |
| 851 San Rafael Dr | 0.71mi | 2/1.0 | 720 (+7%) | 10mo | $145,000 | $201 | 43 |
| 151 Santa Lucia Dr | 0.37mi | 1/1.0 (-1) | 588 (-12%) | 14mo | $74,900 | $127 | 41 |
| 1380 W Florida Ave #6 | 0.73mi | 1/1.0 (-1) | 572 (-15%) | 7mo | $42,000 | $73 | 26 |
Match score weights: distance 35% · size 25% · config 20% · recency 20%. Top-matched comps best support the ARV.
Projected returns pro-forma
-3.0% appreciation · 1.76% rent growth · sell at horizon
- IRR
- 46.4%
- Equity multiple
- 2.96×
- Total profit
- $21,373
- Equity at exit
- $5,815
- IRR
- 51.3%
- Equity multiple
- 5.55×
- Total profit
- $49,665
- Equity at exit
- $3,372
Cash invested: $10,920 (down + closing). Projections, not guarantees.
Landlord ↔ Tenant lean methodology
- Overall (STATE)
- 18 Strongly Tenant-Friendly
- State California
- 18 Strongly Tenant-Friendly · D+13
- County
- — inherits STATE
- City
- — inherits STATE
ZIP-level market 92543
- Home prices YoY
- -26.7%
- Rents YoY
- 1.8%
- Active inventory
- 264
- Price-to-rent
- 1.9×
Monthly cashflow live
- Estimated rent
- $1,717 high interval (Pro) →
- Mortgage (P&I)
- −$205
- Tax est. 1.5%
- −$49 /mo · $585/yr
- Insurance
- −$16
- HOA
- −$625
- Vacancy / Maint / Mgmt
- −$360
- Net cashflow
- $462
Break-even live
Sensitivity live
| Price | -10% $489 | -5% $475 | +0% $462 | +5% $448 | +10% $435 |
|---|---|---|---|---|---|
| Rent | -10% $326 | -5% $394 | +0% $462 | +5% $529 | +10% $597 |
| Rate | -1.0pp $481 | -0.5pp $472 | base $462 | +0.5pp $451 | +1.0pp $441 |
UW: 25.0% down · 7.5% · 30yr · 1.5% tax · 5.0% vac · 8.0% maint · 8.0% mgmt
Financing live
Cash to close
- Down payment
- $9,750
- Closing costs
- $1,170
- Reserves months
- —
- Total cash needed
- —
Loan-product check · same deal, 3 products live
Conventional
25% down · 7.5% · 30yr
- Down + closing
- —
- Monthly P&I
- —
- Monthly cashflow
- —
- DSCR
- —
- Eligible?
- —
Personal DTI + credit; lowest rate.
DSCR
20% down · 8.5% · 30yr
- Down + closing
- —
- Monthly P&I
- —
- Monthly cashflow
- —
- DSCR
- —
- Eligible?
- —
No personal income docs; deal must DSCR.
Hard money
10% down · 12.0% · 12mo
- Down + closing
- —
- Monthly P&I
- —
- Monthly cashflow
- —
- DSCR
- —
- Eligible?
- —
Short-term bridge; refi at stabilization.
Rent comps 15 comps
| Address | Beds | Baths | Sqft | Rent | $/sqft | DOM | Units | Dist |
|---|---|---|---|---|---|---|---|---|
| 2098 W Acacia Ave Hemet, CA | 1.0–3.0 | 1.0–2.0 | 895 | $2,035 | $2.27 | 0d | 1 | 0.38mi |
| 1074 W Johnston Ave Hemet, CA | 2.0 | 1.0 | 460 | $1,500 | $3.26 | 0d | 1 | 0.64mi |
| 893 S Palm Ave Hemet, CA | 2.0 | 2.0 | 720 | $1,375 | $1.91 | 5d | 1 | 0.72mi |
| 3030 W Acacia Ave Hemet, CA | 1.0–2.0 | 1.0–2.0 | 807 | $1,785 | $2.21 | 0d | 8 | 0.79mi |
| 201 N Valley View Dr Hemet, CA | 1.0 | 1.0 | 552 | $1,500 | $2.72 | 44d | 1 | 0.83mi |
| 1150 S Palm Ave Hemet, CA | 1.0 | 1.0 | 670 | $1,534 | $2.29 | 25d | 1 | 0.96mi |
| 1025 S Gilbert St Hemet, CA | 1.0–2.0 | 1.0–2.0 | 890 | $2,320 | $2.61 | 2d | 8 | 0.99mi |
| 2770 W Devonshire Ave Hemet, CA | 1.0–2.0 | 1.0–2.0 | 707 | $1,945 | $2.75 | 0d | 10 | 1.08mi |
| 1000 S Gilbert St Hemet, CA | 1.0–2.0 | 1.0 | 500 | $1,470 | $2.94 | 2d | 4 | 1.09mi |
| 1377 Provence Ct Hemet, CA | 1.0 | 1.0 | 650 | $1,900 | $2.92 | 25d | 1 | 1.11mi |
| 113 E Kimball Ave Unit 2 Hemet, CA | 2.0 | 1.0 | 500 | $1,295 | $2.59 | 44d | 1 | 1.23mi |
| 233 N Alessandro St Hemet, CA | 1.0 | 1.0 | 690 | $1,400 | $2.03 | 44d | 1 | 1.24mi |
| 199 N Inez St Apt D Hemet, CA | 1.0 | 1.0 | 650 | $1,300 | $2.00 | 8d | 1 | 1.25mi |
| 199 N Inez St Apt D Hemet, CA | 1.0 | 1.0 | 650 | $1,300 | $2.00 | 0d | 1 | 1.25mi |
| 3800 W Devonshire Ave Hemet, CA | 3.0 | 1.0–2.0 | 816 | $2,172 | $2.66 | 0d | 8 | 1.50mi |
HOA detail
- Monthly dues
- $625 · $7,500/yr
- Likely covers
- pool
Listing history 15 events
-
2026-06-18days on market $39,000 Active 30 DOM
-
2026-06-17days on market $39,000 Active 29 DOM
-
2026-06-16days on market $39,000 Active 28 DOM
-
2026-06-15days on market $39,000 Active 27 DOM
-
2026-06-13days on market $39,000 Active 25 DOM
-
2026-06-09days on market $39,000 Active 21 DOM
-
2026-06-08days on market $39,000 Active 20 DOM
-
2026-06-07days on market $39,000 Active 19 DOM
-
2026-06-04days on market $39,000 Active 16 DOM
-
2026-06-03days on market $39,000 Active 15 DOM
-
2026-06-02days on market $39,000 Active 14 DOM
-
2026-06-01days on market $39,000 Active 13 DOM
-
2026-05-31days on market $39,000 Active 12 DOM
-
2026-05-19$39,000 Active
-
2026-05-18$39,000 Active 1028-char remark
Show marketing remark (1028 chars)
Resort-Style Amenities, Perfect 55+ Retreat! Welcome, charming single-wide manufactured home, thoughtfully designed for comfort and convenience. Step inside and find vinyl flooring that offers the beauty of hardwood with easy upkeep. Custom countertops add a touch of elegance to your daily routine, while 2 cozy bedrooms & a well-appointed bathroom provide a right amount of space. Stay comfortable all year with central cooling/heating, enjoy the 2-car carport for sheltered parking. The community is a standout, with on-site management and maintenance team. Amenities: Clubhouse & Banquet Hall, perfect for socials & family gatherings. Billiard & Card Room, keep active and engaged. Heated Pool & Spa, relax in comfort any season. Picnic Area, enjoy alfresco dining in a peaceful setting. Laundry Facility, added convenience just steps away. Dog Park, your furry best friend is welcome too! Experience the best of 55+ livingwhere home is cozy, amenities are abundant, and you feel taken care of.
ⓘ Source: listings_history table (triggers on properties + properties_extension) + one-shot
backfill from property_details.listing_events for pre-trigger history.
Climate risk First Street
- Flood 1/10 Low FEMA zone X (unshaded) · 0% chance over 30 yrs
- Wildfire 6/10 Major
- Heat 7/10 Severe 6 d/yr ≥104°F today · 17 d/yr by 30 yrs out
- Wind 1/10 Low
- Air quality 6/10 Major 9 unhealthy d/yr today · 11 by 30 yrs out
Nearby sold comps map
Loading sold comps map…
Walkable amenities ~0.75 mi
Loading nearby amenities…
Taxation est. · year 1
- Rental income
- $20,599
- − Mortgage interest
- −$2,185
- − Property taxes
- −$585
- − Insurance
- −$195
- − Repairs & maintenance
- −$1,648
- − Management
- −$1,648
- − HOA
- −$7,500
- − Depreciation
- −$1,135
- Taxable income
- $5,704
- Est. tax owed @ 24.0%
- −$1,369
- After-tax cash flow
- $4,170/yr
For passive investors: Depreciation is non-cash, so a rental often shows a tax loss while cash-flowing — sheltering income. Rental losses are passive: they offset passive income freely, and up to $25,000/yr can offset ordinary (W-2) income if you actively participate and your MAGI is under $100k (phasing out to $0 by $150k); unused losses carry forward. On sale, claimed depreciation is recaptured at up to 25%, and gains may owe capital-gains tax (a 1031 exchange can defer both). Figures are a year-1 estimate at your 24.0% rate — not tax advice; consult a CPA.
Schools (NCES district)
- District
- Hemet Unified
- NCES district ID
- 0616920
- Math proficiency
- 19% ▼ -3.00%
- Reading proficiency
- 41% ▲ 4.00%
- Median HH income
- $39,962
- Composite
- 25.16/100
- National rank
- #7517
- State rank
- #360 of 517 in CA
Livability — Hemet
- Score
- 51/100
- State rank
- #1056
- US rank
- #25208
Category grades
Schools grade is shown separately in the Schools card above.
Census & demographics
- Census place
- Hemet, CA
- County
- Riverside County · 2,287,001 people
- City population
- 137,670
- Metro
- Riverside-San Bernardino-Ontario, CA
- Population (ZIP)
- 39,937
- Household income
- $49,396
- Rent vs Own
- Severe rent burden
- 2144.0
Population outlook (Riverside County) Hauer SSP2
- Today (2025)
- 2,664,475 people
- By 2030
- 2,802,692 · +5.2%
- By 2040
- 3,050,904 · +14.5%
- By 2050
- 3,256,783 · +22.2%
- By 2075
- 3,655,058 · +37.2%
- By 2100
- 3,766,594 · +41.4%
Race, ethnicity, and origin ACS 2023
- Neighborhood character
- Diverse neighborhood (Simpson 0.61)
- Race & ethnicity
- Hispanic / Latino 54% White 30% Two or more races 18% Black 10% Native American 2% Asian 2%
- Hispanic origin (detail)
- Mexican 48% Puerto Rican 1%
- Common ancestry
- Slovak 1% Romanian 1% Portuguese 1%
- Foreign-born
- 21% · Canada
- Languages at home
- 59% English-only · Spanish 38% Arabic 1% Tagalog/Filipino 1%
Political lean MEDSL · Riverside
- 2024 margin
- Toss-up / Even · D 48.0% · R 49.3% · Other 2.6%
- 2008→2024 swing
- -3.6pp toward R · 2008: 2.3pp · 2024: -1.3pp
- All cycles
- 2024: R+1.3 2020: D+8.0 2016: D+4.3 2012: R+0.4 2008: D+2.3
Not yet ingested
- Civics
- —
Market trends
- HPI YoY
- ▼ -147.46%
- Current HPI
- 405.1277
- Rent YoY
- ▲ 1.76%
- Metro
- Riverside-San Bernardino-Ontario, CA
- State GDP YoY
- ▲ 3.21%
- F500 in state
- 116
Industry mix (Fortune 500 HQ in CA)
| Industry | F500 HQs | Revenue |
|---|---|---|
| Technology | 27 | $1,492B |
|
||
| Financial Services | 3 | $174B |
|
||
| Retail | 3 | $44B |
|
||
| Insurance | 3 | $26B |
|
||
| Media / Entertainment | 2 | $115B |
|
||
| Pharmaceuticals / Biotech | 2 | $62B |
|
||
Price history
+0.0% since first listed2 events — show timeline
- 2026-05-19 Listed $39,000 CRMLS
- 2026-05-18 Listed $39,000 GEMLS
Property tax history
+3.2%/yrLatest (2025): $31 · -30.2% YoY. Source: county tax records.
Cash-flow waterfall
monthlySold comps — $/sqft
last 12 mo · ≤1 miLoading sold comps…