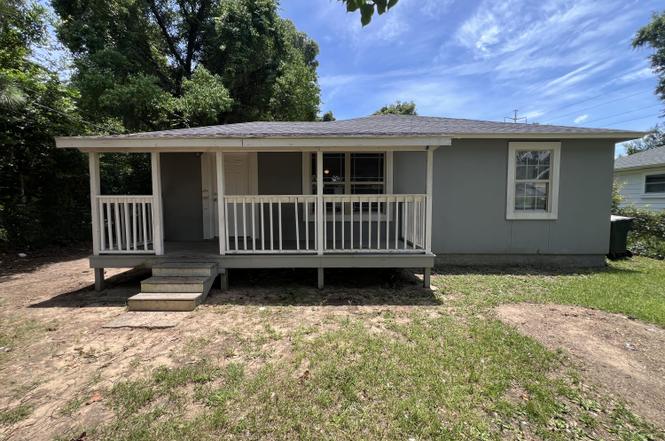
3315 W Lloyd St · West Pensacola, FL
Flood risk 1/10 · Minimal
- FEMA flood zone
- X (unshaded)
- Chance of flooding over 30 yrs
- 0.0%
- Est. flood insurance / yr
- $507 – $1,088
Fire risk 1/10 · Minimal
- Est. fire insurance / yr
- $947 – $1,759
Heat risk 10/10 · Severe
- Hot days now (above 105°F)
- 7 days/yr
- Hot days in 30 yrs
- 22 days/yr
Wind risk 9/10 · Severe
- Chance of severe wind over 30 yrs
- 99.0%
Air-quality risk 1/10 · Minimal
- Unhealthy air days now
- 0 days/yr
- Unhealthy air days in 30 yrs
- 0 days/yr
Risk factors via First Street. Map © Google.
Why this score? — see what drove the B- grade
The composite is a weighted blend of 9 inputs, each scored 0–100. Each bar is that input's sub-score; the figure is the points it added to the 100-point composite (weight × sub-score).
- Cash flow +24.8/30.0
- ARV discount +15.0/15.0
- DSCR +8.0/10.0
- 1% rule +6.1/10.0
- Rent growth +3.7/5.0
- Schools +3.6/10.0
- Livability +3.3/5.0
- Condition / age +2.5/5.0
- Appreciation +0.0/10.0
$138,000
🖨 Deal sheet 📄 Offer letter ✓ Due diligence
Listing remarks MLS
Great investment property, or a nice fixer upper for 1st time homebuyer. There is a large backyard for entertaining or pets. Seller recently put in a new A/C unit, and this home has large rooms and big windows.
Key facts
- Covered front porch
- Flex area
- Large concrete pad
Tags
Property features AI
Finance
- HOA & community: Subdivision: NORTH MULWORTH
Exterior
- Utilities: Septic tank
- Home design: Traditional style single-story home; Zoned for single-family residential
- Construction: Built in 1948; Stucco construction
- Exterior features: Interior lot; Paved road access
Interior
- Kitchen: Includes refrigerator
- Bedrooms: Three bedrooms, all on the first floor (approx. 9' x 12', 9' x 10', 9' x 10')
- Bathrooms: One full bathroom
- Heating & cooling: Central heating; Central air conditioning; Electric heat controls
- Interior features: Five total rooms
Neighborhood map
What this means for you Summary
Snapshot
- This is a 3-bed/1.0-bath single-family listed at $138k.
Deal economics
- At list price, monthly cash flow is $293 ($4k/yr) — positive.
- The deal already cash-flows at list — no discount required.
- Meets the 1% rule at list price ($2k rent vs $138k).
Location & tenants
- Location reads 66/100 on livability (#629 in FL) — a middle-class / working-renter tenant base. Strengths: cost of living A+, housing A+, health & safety B+; Watch: crime D, amenities F, commute F.
- Escambia (suburban): math 40% / reading 45% proficiency, ranked #56 of 73 in FL (top 77%) — families likely to look elsewhere, expect single-tenant / working-renter base with shorter leases.
- Zoned schools: Oakcrest Elementary School (math 32% / reading 15%, grade F, #2,061 of 2,144 statewide, top 96%, 491 students, 75% FRL); Pensacola High School (math 29% / reading 50%, grade F, #304 of 667 statewide, top 47%, 1,229 students, 55% FRL).
- Market conditions: Rents rising fast (+4.9%/yr); 198 active listings in the ZIP; 17 comparable units currently listed for rent nearby; rentals at typical pace (median 23d on market — plan ~3-4 weeks tenant-placement turnaround); lower-income renter base — watch delinquency; 1,479 units permitted in Escambia County in 2024 (0 in 5+ unit buildings).
- This rent runs 41% of the median local income ($45k/yr) — at the standard rent-burdened threshold; future hikes will face affordability resistance.
Forward outlook
- Local home prices are declining (-3.0%/yr); year-one equity from $954 of loan paydown is wiped out by about $4k of value loss. Plan a longer hold.
- Escambia County population projected at +13% by 2050 — modest demand growth; plan on rents tracking national, not racing it.
- At projected returns (-3.0% appreciation + 4.9% rent growth), your $39k cash investment doubles in ~10 years — after that, you're playing with house money.
Negotiation context
- Only 3 days on market — expect competitive offers; lowballing is unlikely to land.
- 2 sale attempts since 13y ago with the ask held roughly flat each time — persistent listings suggest the price (not the market) is what's stuck; bring a comps-based counter.
- Current owner paid $22k; list at $138k implies a 527% gain — meaningful room to come down on a strong offer.
Risks & watch-outs
- Watch-outs: built in 1948 — expect roof / HVAC / electrical / plumbing capex.
- Climate carrying-cost: severe wind risk, 99% chance of damaging wind over 30y; extreme-heat days projected 7→22/yr by 2055 (HVAC capex compounding) — expect insurance premiums to compound above CPI over the hold.
Questions for the listing agent
- Built in 1948 — when were the roof, HVAC, electrical panel, plumbing, and water heater last replaced?
- Is there a deadline driving the sale (1031 exchange, divorce, estate, relocation)? That informs how much negotiation room exists.
- Schools are F-rated, which usually means shorter tenancies and higher turnover. Who's the typical renter profile here, and what's been the actual vacancy rate?
- Crime grade is D in this area — have there been break-ins, vandalism, or insurance claims at this property in the last 3 years? What carrier currently insures it and at what premium?
- What's the average days-on-market for RENTAL listings here right now (not sales)? A rising rental-DOM trend means longer vacancies and softer asking-rent achievability than the comps imply.
- What's the recent tenant-quality profile in this submarket — average credit score on applications, eviction rate, late-payment / NSF rate, and stable-employment percentage? A property-management company in the area should have these aggregated.
- How much new for-sale + rental construction is in the pipeline within 1–3 miles? Heavy new supply typically softens prices + rents 12–24 months out; constrained supply supports both.
Investment metrics
- 1% rule
- 1.11% ✓
- Cap rate
- 8.84%
- Cash-on-cash
- 9.10%
- DSCR
- 1.40
- GRM
- 7.5
CMA / ARV
- ARV (on-the-fly)
- $196,560
- Comps found
- 12
Show comp detail 12 sales within ~0.75 mi
| Address | Dist | Beds/Ba | Sqft | Sold | Price | $/sf | Match |
|---|---|---|---|---|---|---|---|
| 2910 W Lee St | 0.34mi | 3/2.0 | 1,272 (+1%) | 7mo | $199,990 | $157 | 73 |
| 2920 W Gonzalez St | 0.32mi | 3/1.0 | 1,144 (-9%) | 2mo | $214,000 | $187 | 68 |
| 1719 Larry Ave | 0.37mi | 3/1.5 | 1,215 (-4%) | 11mo | $190,000 | $156 | 66 |
| 3907 W Blount St | 0.34mi | 3/1.0 | 1,160 (-8%) | 7mo | $150,000 | $129 | 65 |
| 3703 W Theresa St | 0.37mi | 3/1.0 | 1,137 (-10%) | 2mo | $52,100 | $46 | 65 |
| 3403 W Hernandez | 0.57mi | 3/1.0 | 1,280 (+2%) | 9mo | $147,000 | $115 | 63 |
| 2906 W Moreno St | 0.43mi | 3/2.0 | 1,314 (+4%) | 8mo | $113,500 | $86 | 63 |
| 2705 W Brainerd St | 0.47mi | 3/2.0 | 1,384 (+10%) | 1mo | $225,000 | $163 | 57 |
| 3215 Bayou Dr | 0.72mi | 3/2.0 | 1,204 (-4%) | 4mo | $215,000 | $179 | 52 |
| 2725 W Jackson St | 0.63mi | 3/2.0 | 1,144 (-9%) | 5mo | $220,000 | $192 | 47 |
| 1716 N S St | 0.74mi | 3/1.0 | 1,080 (-14%) | 4mo | $130,000 | $120 | 38 |
| 700 Lynch St | 0.63mi | 2/1.0 (-1) | 1,401 (+11%) | 10mo | $74,000 | $53 | 38 |
Match score weights: distance 35% · size 25% · config 20% · recency 20%. Top-matched comps best support the ARV.
Projected returns pro-forma
-3.0% appreciation · 4.92% rent growth · sell at horizon
- IRR
- -0.5%
- Equity multiple
- 0.98×
- Total profit
- $-687
- Equity at exit
- $20,576
- IRR
- 11.1%
- Equity multiple
- 1.94×
- Total profit
- $36,281
- Equity at exit
- $11,932
Cash invested: $38,640 (down + closing). Projections, not guarantees.
Landlord ↔ Tenant lean methodology
- Overall (STATE)
- 87 Strongly Landlord-Friendly
- State Florida
- 87 Strongly Landlord-Friendly · R+3
- County
- — inherits STATE
- City
- — inherits STATE
ZIP-level market 32505
- Home prices YoY
- -26.5%
- Rents YoY
- 4.9%
- Active inventory
- 198
- Price-to-rent
- 7.5×
Monthly cashflow live
- Estimated rent
- $1,529 high interval (Pro) →
- Mortgage (P&I)
- −$724
- Tax from tax record
- −$134 /mo · $1,604/yr
- Insurance
- −$58
- HOA
- −$0
- Vacancy / Maint / Mgmt
- −$321
- Net cashflow
- $293
Break-even live
UW: 25.0% down · 7.5% · 30yr · 1.5% tax · 5.0% vac · 8.0% maint · 8.0% mgmt
Financing live
Cash to close
- Down payment
- $34,500
- Closing costs
- $4,140
- Reserves months
- —
- Total cash needed
- —
Loan-product check · same deal, 3 products live
Conventional
25% down · 7.5% · 30yr
- Down + closing
- —
- Monthly P&I
- —
- Monthly cashflow
- —
- DSCR
- —
- Eligible?
- —
Personal DTI + credit; lowest rate.
DSCR
20% down · 8.5% · 30yr
- Down + closing
- —
- Monthly P&I
- —
- Monthly cashflow
- —
- DSCR
- —
- Eligible?
- —
No personal income docs; deal must DSCR.
Hard money
10% down · 12.0% · 12mo
- Down + closing
- —
- Monthly P&I
- —
- Monthly cashflow
- —
- DSCR
- —
- Eligible?
- —
Short-term bridge; refi at stabilization.
Rent comps 17 comps
| Address | Beds | Baths | Sqft | Rent | $/sqft | DOM | Units | Dist |
|---|---|---|---|---|---|---|---|---|
| 852 Garnet St Pensacola, FL | 3.0 | 1.5 | 1150 | $1,150 | $1.00 | 13d | 1 | 0.32mi |
| 2802 W Gonzalez St Pensacola, FL | 3.0 | 2.0 | 1824 | $1,600 | $0.88 | 23d | 1 | 0.42mi |
| 419 N Wentworth St Pensacola, FL | 2.0 | 1.0 | 1100 | $1,195 | $1.09 | 23d | 1 | 0.55mi |
| 3740 Frontera Cir Pensacola, FL | 3.0 | 1.0 | 1024 | $1,295 | $1.26 | 23d | 1 | 0.64mi |
| 2303 W Brainerd St Pensacola, FL | 2.0 | 1.0 | 955 | $1,100 | $1.15 | 23d | 1 | 0.74mi |
| 3418 Luke St Pensacola, FL | 4.0 | 2.0 | 1620 | $1,800 | $1.11 | 23d | 1 | 0.91mi |
| 3417 W Fisher St Unit C Pensacola, FL | 3.0 | 2.0 | 1106 | $1,350 | $1.22 | 23d | 1 | 1.00mi |
| 315 N Pace Blvd Unit b Pensacola, FL | 3.0 | 2.0 | 1342 | $1,650 | $1.23 | 23d | 1 | 1.08mi |
| 315 N Pace Blvd Unit A Pensacola, FL | 3.0 | 2.0 | 1342 | $1,850 | $1.38 | 23d | 1 | 1.08mi |
| 309 N Pace Blvd Unit B Pensacola, FL | 3.0 | 2.0 | 1342 | $1,650 | $1.23 | 23d | 1 | 1.10mi |
| 2108 W Bobe St Pensacola, FL | 4.0 | 2.0 | 1752 | $2,100 | $1.20 | 23d | 1 | 1.13mi |
| 707 New York Dr Pensacola, FL | 2.0 | 1.0 | 1266 | $1,185 | $0.94 | 23d | 1 | 1.16mi |
| 1717 W Cervantes St Pensacola, FL | 2.0 | 2.0 | 974 | $1,169 | $1.20 | 13d | 3 | 1.19mi |
| 1804 W Belmont St Unit A Pensacola, FL | 3.0 | 1.0 | 925 | $995 | $1.08 | 21d | 1 | 1.22mi |
| 4519 Martha Ave Pensacola, FL | 3.0 | 1.0 | 1104 | $1,600 | $1.45 | 23d | 1 | 1.27mi |
| 239 N K St Pensacola, FL | 3.0 | 2.0 | 1392 | $1,950 | $1.40 | 23d | 1 | 1.34mi |
| 101 Vanderbilt Rd Pensacola, FL | 3.0 | 2.0 | 1104 | $1,850 | $1.68 | 21d | 1 | 1.46mi |
Listing history 4 events
-
2026-06-18days on market $138,000 Active 3 DOM
-
2026-06-17days on market $138,000 Active 2 DOM
-
2026-06-16remarks 699-char remark
-
2026-06-16$138,000 Active 1 DOM
ⓘ Source: listings_history table (triggers on properties + properties_extension) + one-shot
backfill from property_details.listing_events for pre-trigger history.
Tax reassessment forecast FL · Resets to sale price
- Current annual tax
- $1,604 · $134/mo
- Projected year-2 tax
- $1,604 · $134/mo
- Expected delta
- $0/yr ($0/mo · 0.0%)
ⓘ Screening estimate from a state-policy table — verify with the county assessor before closing.
Climate risk First Street
- Flood 1/10 Low FEMA zone X (unshaded) · 0% chance over 30 yrs
- Wildfire 1/10 Low
- Heat 10/10 Extreme 7 d/yr ≥105°F today · 22 d/yr by 30 yrs out
- Wind 9/10 Extreme 99% chance of damaging wind over 30 yrs
- Air quality 1/10 Low 0 unhealthy d/yr today · 0 by 30 yrs out
Nearby sold comps map
Loading sold comps map…
Walkable amenities ~0.75 mi
Loading nearby amenities…
Taxation est. · year 1
- Rental income
- $18,348
- − Mortgage interest
- −$7,730
- − Property taxes
- −$1,604
- − Insurance
- −$690
- − Repairs & maintenance
- −$1,468
- − Management
- −$1,468
- − Depreciation
- −$4,015
- Taxable income
- $1,374
- Est. tax owed @ 24.0%
- −$330
- After-tax cash flow
- $3,187/yr
For passive investors: Depreciation is non-cash, so a rental often shows a tax loss while cash-flowing — sheltering income. Rental losses are passive: they offset passive income freely, and up to $25,000/yr can offset ordinary (W-2) income if you actively participate and your MAGI is under $100k (phasing out to $0 by $150k); unused losses carry forward. On sale, claimed depreciation is recaptured at up to 25%, and gains may owe capital-gains tax (a 1031 exchange can defer both). Figures are a year-1 estimate at your 24.0% rate — not tax advice; consult a CPA.
Schools (NCES district)
- District
- Escambia
- NCES district ID
- 1200510
- Math proficiency
- 40% ▼ -9.00%
- Reading proficiency
- 45% ▼ -4.00%
- Median HH income
- $44,649
- Composite
- 36.04/100
- National rank
- #4773
- State rank
- #56 of 73 in FL
Livability — West Pensacola
- Score
- 66/100
- State rank
- #629
- US rank
- #12275
Category grades
Schools grade is shown separately in the Schools card above.
Census & demographics
- Census place
- West Pensacola, FL
- County
- Escambia County · 301,722 people
- Metro
- Pensacola-Ferry Pass-Brent, FL
- Population (ZIP)
- 27,877
- Household income
- $44,783
- Rent vs Own
- Severe rent burden
- 1458.0
Population outlook (Escambia County) Hauer SSP2
- Today (2025)
- 334,637 people
- By 2030
- 345,779 · +3.3%
- By 2040
- 364,828 · +9.0%
- By 2050
- 378,514 · +13.1%
- By 2075
- 403,220 · +20.5%
- By 2100
- 386,125 · +15.4%
Race, ethnicity, and origin ACS 2023
- Neighborhood character
- Diverse neighborhood (Simpson 0.66)
- Race & ethnicity
- Black 48% White 32% Hispanic / Latino 11% Two or more races 9% Asian 2%
- Hispanic origin (detail)
- Mexican 5% Cuban 2%
- Common ancestry
- Slovak 2% Italian 1% Serbian 1%
- Foreign-born
- 9% · Canada, Vietnam
- Languages at home
- 87% English-only · Spanish 9% Other Indo-European 1% Vietnamese 1%
Political lean MEDSL · Escambia
- 2024 margin
- R (+19.5) · D 39.7% · R 59.2% · Other 1.1%
- 2008→2024 swing
- -0.2pp no change · 2008: -19.3pp · 2024: -19.5pp
- All cycles
- 2024: R+19.5 2020: R+15.1 2016: R+20.6 2012: R+20.6 2008: R+19.3
Not yet ingested
- Civics
- —
Market trends
- HPI YoY
- ▼ -74.10%
- Current HPI
- 205.45
- Rent YoY
- ▲ 4.92%
- Metro
- Pensacola-Ferry Pass-Brent, FL
- State GDP YoY
- ▲ 3.28%
- F500 in state
- 36
Industry mix (Fortune 500 HQ in FL)
| Industry | F500 HQs | Revenue |
|---|---|---|
| Industrial Technology | 2 | $29B |
|
||
| Insurance | 2 | $17B |
|
||
| Retail | 1 | $60B |
|
||
| Technology Distribution | 1 | $58B |
|
||
| Homebuilding | 1 | $35B |
|
||
| Technology Manufacturing | 1 | $35B |
|
||
Price history
+670.9% since first listed5 events — show timeline
- 2026-06-15 Listed $138,000 ECAR
- 2014-03-10 Sold (MLS) $22,000 PARMLS
- 2013-09-14 Listed $35,000 PARMLS
- 1989-03-01 Sold (Public Records) $30,000 Public Records
- 1984-06-01 Sold (Public Records) $17,900 Public Records
Property tax history
+8.1%/yrLatest (2025): $1,604 · +17.1% YoY. Source: county tax records.
Cash-flow waterfall
monthlySold comps — $/sqft
last 12 mo · ≤1 miLoading sold comps…