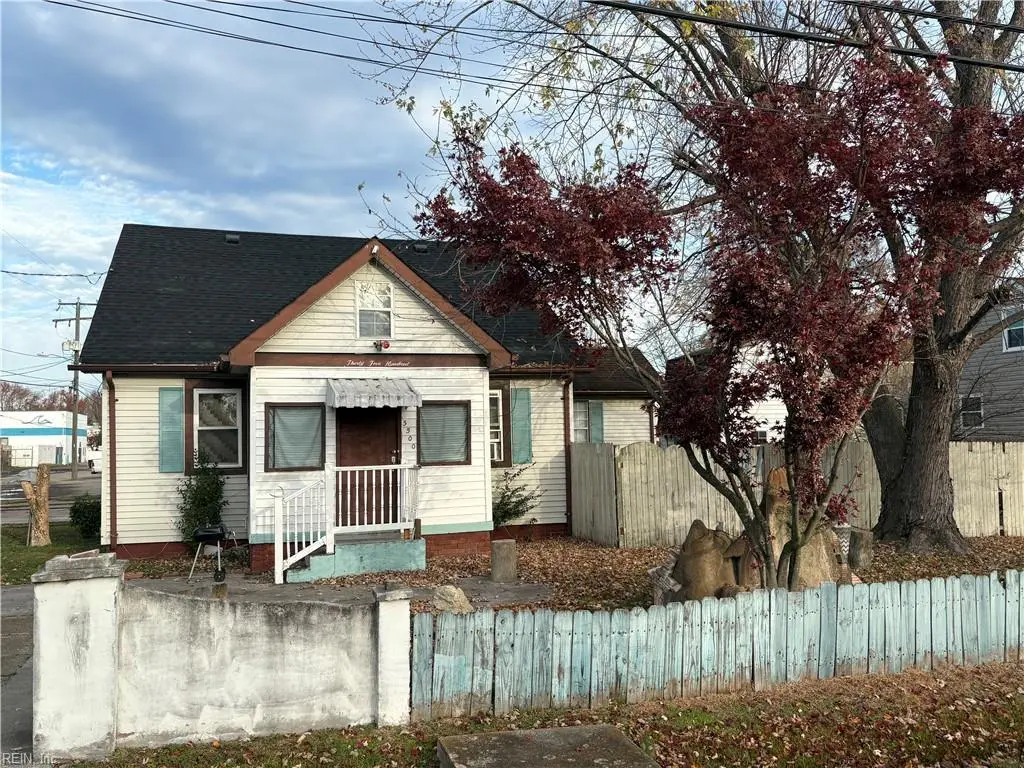
3500 Tait Ter · Norfolk, VA
Flood risk 1/10 · Minimal
- FEMA flood zone
- X (unshaded)
- Chance of flooding over 30 yrs
- 0.0%
- Est. flood insurance / yr
- $507 – $1,088
Fire risk 1/10 · Minimal
- Est. fire insurance / yr
- $666 – $1,236
Heat risk 9/10 · Severe
- Hot days now (above 105°F)
- 7 days/yr
- Hot days in 30 yrs
- 16 days/yr
Wind risk 8/10 · Major
- Chance of severe wind over 30 yrs
- 80.0%
Air-quality risk 3/10 · Minor
- Unhealthy air days now
- 2 days/yr
- Unhealthy air days in 30 yrs
- 3 days/yr
Risk factors via First Street. Map © Google.
Why this score? — see what drove the B+ grade
The composite is a weighted blend of 9 inputs, each scored 0–100. Each bar is that input's sub-score; the figure is the points it added to the 100-point composite (weight × sub-score).
- Cash flow +29.0/30.0
- ARV discount +15.0/15.0
- DSCR +10.0/10.0
- 1% rule +8.3/10.0
- Livability +4.2/5.0
- Schools +3.5/10.0
- Rent growth +3.4/5.0
- Condition / age +2.5/5.0
- Appreciation +0.0/10.0
$175,000
🖨 Deal sheet 📄 Offer letter ✓ Due diligence
Listing remarks MLS
This property is a great Investment opportunity. The house is offered together with adjacent lot 3504 Tait Terrance priced separately. There is great potential for this nice corner lot. Selling as-is where-is; seller to do no repairs. Rehab loan or Cash only.
Key facts
- Corner lot
- Built 1937
- Listed 198 days
Tags
Neighborhood map
What this means for you Summary
Snapshot
- This is a 4-bed/2.0-bath single-family listed at $175k.
Deal economics
- At list price, monthly cash flow is $602 ($7k/yr) — positive.
- The deal already cash-flows at list — no discount required.
- Meets the 1% rule at list price ($2k rent vs $175k).
- Recommended offer: $154k (12.0% below list) — sets the bar for market timing.
- Cap rate 10.4% vs local median 4.0% in Norfolk — top-decile yield for the area; either an underpriced asset or a hidden risk that comps aren't pricing in. Stress-test before assuming the spread holds.
Location & tenants
- Location reads 83/100 on livability (#43 in VA, #1,026 nationally) — a professional / high-income tenant draw. Strengths: amenities A+, commute A+, health & safety A+; Watch: employment C-, crime F.
- Norfolk City Public School District (urban): math 27% / reading 56% proficiency, ranked #118 of 131 in VA (top 90%) — families likely to look elsewhere, expect single-tenant / working-renter base with shorter leases.
- Market conditions: Rents rising (+3.4%/yr); 132 active listings in the ZIP; 34 comparable units currently listed for rent nearby; rentals at typical pace (median 24d on market — plan ~3-4 weeks tenant-placement turnaround); 44% of comp listings sitting > 30 days — soft ceiling on asking rent; 438 units permitted in Norfolk city in 2024 (273 in 5+ unit buildings).
- This rent runs 41% of the median local income ($68k/yr) — at the standard rent-burdened threshold; future hikes will face affordability resistance.
Forward outlook
- Local home prices are declining (-3.0%/yr); year-one equity from $1k of loan paydown is wiped out by about $5k of value loss. Plan a longer hold.
- At projected returns (-3.0% appreciation + 3.4% rent growth), your $49k cash investment doubles in ~8 years — after that, you're playing with house money.
Negotiation context
- It's been on market 198 days — a 12% lower offer ($154k) is reasonable based on typical stale-listing flexibility.
- 2 sale attempts since 2y ago with the ask held roughly flat each time — persistent listings suggest the price (not the market) is what's stuck; bring a comps-based counter.
Risks & watch-outs
- Watch-outs: built in 1937 — expect roof / HVAC / electrical / plumbing capex.
- Climate carrying-cost: severe wind risk, 80% chance of damaging wind over 30y; extreme-heat days projected 7→16/yr by 2055 (HVAC capex compounding) — expect insurance premiums to compound above CPI over the hold.
Questions for the listing agent
- It's been on market 198 days. Have you received any prior offers? Is the seller open to a 12% concession, seller financing, or rate buy-down credit?
- Built in 1937 — when were the roof, HVAC, electrical panel, plumbing, and water heater last replaced?
- Why hasn't it sold? Are there any deal-killer items the seller is aware of (foundation, flood, title, zoning, code violations)?
- Is there a deadline driving the sale (1031 exchange, divorce, estate, relocation)? That informs how much negotiation room exists.
- Schools are A-rated — typically a magnet for longer-tenancy family renters. What's the average tenant stay here, and is there a school-zone premium baked into asking?
- Crime grade is F in this area — have there been break-ins, vandalism, or insurance claims at this property in the last 3 years? What carrier currently insures it and at what premium?
- What's the average days-on-market for RENTAL listings here right now (not sales)? A rising rental-DOM trend means longer vacancies and softer asking-rent achievability than the comps imply.
- What's the recent tenant-quality profile in this submarket — average credit score on applications, eviction rate, late-payment / NSF rate, and stable-employment percentage? A property-management company in the area should have these aggregated.
- How much new for-sale + rental construction is in the pipeline within 1–3 miles? Heavy new supply typically softens prices + rents 12–24 months out; constrained supply supports both.
Investment metrics
- 1% rule
- 1.33% ✓
- Cap rate
- 10.42%
- Cash-on-cash
- 14.73%
- DSCR
- 1.66
- GRM
- 6.3
CMA / ARV
- ARV (median comp)
- $301,416
- List price
- $175,000
- Delta
- -41.94%
- Verdict
- UNDERPRICED
- Comps
- 20 within 1.0 mi
Show comp detail 12 sales within ~0.75 mi
| Address | Dist | Beds/Ba | Sqft | Sold | Price | $/sf | Match |
|---|---|---|---|---|---|---|---|
| 3608 Tait Ter | 0.07mi | 4/2.5 | 1,864 (-2%) | 3mo | $380,000 | $204 | 89 |
| 3012 Ballentine Blvd | 0.44mi | 4/2.0 | 1,840 (-3%) | 2mo | $325,000 | $177 | 73 |
| 3853 Robin Hood Rd | 0.50mi | 3/2.0 (-1) | 1,830 (-4%) | 2mo | $317,500 | $173 | 64 |
| 2908 Tait Ter | 0.48mi | 4/3.0 | 1,994 (+5%) | 2mo | $329,900 | $165 | 63 |
| 3763 Cape Henry Ave | 0.42mi | 4/2.5 | 1,722 (-9%) | 1mo | $359,000 | $208 | 62 |
| 4514 Denver Ave | 0.54mi | 4/2.0 | 2,049 (+8%) | 2mo | $154,000 | $75 | 60 |
| 3856 Peterson St | 0.39mi | 4/3.0 | 1,710 (-10%) | 3mo | $359,000 | $210 | 59 |
| 3772 Larkin St | 0.25mi | 3/2.5 (-1) | 1,630 (-14%) | 3mo | $325,000 | $199 | 55 |
| 3107 Overbrook Ave | 0.44mi | 4/2.0 | 1,638 (-14%) | 2mo | $315,000 | $192 | 55 |
| 3425 E Bonner Dr | 0.54mi | 4/2.0 | 2,116 (+11%) | 3mo | $263,000 | $124 | 54 |
| 3852 Krick St | 0.42mi | 3/2.0 (-1) | 1,650 (-13%) | 3mo | $319,900 | $194 | 51 |
| 2312 Birch St | 0.55mi | 3/2.5 (-1) | 1,632 (-14%) | 4mo | $345,000 | $211 | 41 |
Match score weights: distance 35% · size 25% · config 20% · recency 20%. Top-matched comps best support the ARV.
Projected returns pro-forma
-3.0% appreciation · 3.42% rent growth · sell at horizon
- IRR
- 5.7%
- Equity multiple
- 1.22×
- Total profit
- $10,999
- Equity at exit
- $26,093
- IRR
- 15.6%
- Equity multiple
- 2.29×
- Total profit
- $63,227
- Equity at exit
- $15,131
Cash invested: $49,000 (down + closing). Projections, not guarantees.
Landlord ↔ Tenant lean methodology
- Overall (STATE)
- 55 Moderately Landlord-Leaning
- State Virginia
- 55 Moderately Landlord-Leaning · D+2
- County
- — inherits STATE
- City
- — inherits STATE
ZIP-level market 23513
- Home prices YoY
- -9.3%
- Rents YoY
- 3.4%
- Active inventory
- 132
- Price-to-rent
- 6.3×
Monthly cashflow live
- Estimated rent
- $2,332 high interval (Pro) →
- Mortgage (P&I)
- −$918
- Tax from tax record
- −$250 /mo · $2,999/yr
- Insurance
- −$73
- HOA
- −$0
- Vacancy / Maint / Mgmt
- −$490
- Net cashflow
- $602
Break-even live
UW: 25.0% down · 7.5% · 30yr · 1.5% tax · 5.0% vac · 8.0% maint · 8.0% mgmt
Financing live
Cash to close
- Down payment
- $43,750
- Closing costs
- $5,250
- Reserves months
- —
- Total cash needed
- —
Loan-product check · same deal, 3 products live
Conventional
25% down · 7.5% · 30yr
- Down + closing
- —
- Monthly P&I
- —
- Monthly cashflow
- —
- DSCR
- —
- Eligible?
- —
Personal DTI + credit; lowest rate.
DSCR
20% down · 8.5% · 30yr
- Down + closing
- —
- Monthly P&I
- —
- Monthly cashflow
- —
- DSCR
- —
- Eligible?
- —
No personal income docs; deal must DSCR.
Hard money
10% down · 12.0% · 12mo
- Down + closing
- —
- Monthly P&I
- —
- Monthly cashflow
- —
- DSCR
- —
- Eligible?
- —
Short-term bridge; refi at stabilization.
Rent comps 34 comps
| Address | Beds | Baths | Sqft | Rent | $/sqft | DOM | Units | Dist |
|---|---|---|---|---|---|---|---|---|
| 2531 Vincent Ave Norfolk, VA | 3.0 | 2.0 | 1600 | $2,195 | $1.37 | 44d | 1 | 0.43mi |
| 2537 McKann Ave Norfolk, VA | 4.0 | 2.5 | 2321 | $2,695 | $1.16 | 15d | 1 | 0.56mi |
| 3640 Robin Hood Rd Norfolk, VA | 4.0 | 2.5 | 1400 | $2,999 | $2.14 | 17d | 1 | 0.58mi |
| 3126 Marne Ave Norfolk, VA | 5.0 | 2.0 | 1943 | $3,000 | $1.54 | 44d | 1 | 0.60mi |
| 1531 Spruce St Unit B Norfolk, VA | 3.0 | 2.0 | 1304 | $1,600 | $1.23 | 44d | 1 | 0.61mi |
| 1531 Spruce St Unit B Norfolk, VA | 3.0 | 2.0 | 1304 | $1,600 | $1.23 | 24d | 1 | 0.61mi |
| 3653 Nottaway St Norfolk, VA | 3.0 | 1.5 | 1564 | $2,200 | $1.41 | 17d | 1 | 0.62mi |
| 3477 E Bonner Dr Norfolk, VA | 3.0 | 1.0 | 1304 | $2,000 | $1.53 | 24d | 1 | 0.64mi |
| 2920 Cape Henry Ave Unit A Norfolk, VA | 3.0 | 1.5 | 2331 | $1,900 | $0.82 | 2d | 1 | 0.72mi |
| 2660 Chesapeake Blvd Norfolk, VA | 3.0 | 2.0 | 1375 | $2,100 | $1.53 | 17d | 1 | 0.75mi |
| 4563 Shoshone Ct Norfolk, VA | 3.0 | 2.0 | 1600 | $2,500 | $1.56 | 44d | 1 | 0.78mi |
| 3504 Chesapeake Blvd Norfolk, VA | 3.0 | 2.0 | 1624 | $1,995 | $1.23 | 44d | 1 | 0.78mi |
| 3504 Chesapeake Blvd Norfolk, VA | 3.0 | 2.0 | 1624 | $1,995 | $1.23 | 24d | 1 | 0.78mi |
| 2914 Peronne Ave Norfolk, VA | 4.0 | 2.0 | 1764 | $2,495 | $1.41 | 24d | 1 | 0.83mi |
| 3541 Chesapeake Blvd Norfolk, VA | 5.0 | 1.0 | 1476 | $1,275 | $0.86 | 7d | 1 | 0.88mi |
| 1562 Norcova Ave Norfolk, VA | 3.0 | 1.0 | 1288 | $2,000 | $1.55 | 17d | 1 | 0.97mi |
| 2605 Bapaume Ave Norfolk, VA | 3.0 | 2.0 | 2004 | $2,295 | $1.15 | 44d | 1 | 0.99mi |
| 2201 Pershing Ave Norfolk, VA | 3.0 | 2.5 | 1455 | $2,250 | $1.55 | 4d | 1 | 0.99mi |
| 3521 Brest Ave Norfolk, VA | 3.0 | 2.0 | 1234 | $2,300 | $1.86 | 44d | 1 | 1.01mi |
| 3301 Vimy Ridge Ave Norfolk, VA | 4.0 | 2.0 | 1300 | $2,150 | $1.65 | 4d | 1 | 1.07mi |
| 2729 Somme Ave Norfolk, VA | 3.0 | 2.5 | 1524 | $2,295 | $1.51 | 15d | 1 | 1.07mi |
| 1801 Saint Denis Ave Unit 3 Norfolk, VA | 4.0 | 2.0 | 1500 | $2,400 | $1.60 | 24d | 1 | 1.15mi |
| 1714 Bellevue Ave Norfolk, VA | 3.0 | 1.5 | 1500 | $1,799 | $1.20 | 44d | 1 | 1.18mi |
| 3776 Wayne Cir Norfolk, VA | 4.0 | 3.0 | 2301 | $2,795 | $1.21 | 44d | 1 | 1.19mi |
| 1323 W Norcova Dr Norfolk, VA | 3.0 | 1.0 | 1410 | $2,500 | $1.77 | 44d | 1 | 1.20mi |
| 3414 Tidewater Dr Norfolk, VA | 4.0 | 2.5 | 2200 | $3,000 | $1.36 | 44d | 1 | 1.21mi |
| 1751 Fontainebleau Cres Norfolk, VA | 3.0 | 2.0 | 1231 | $2,350 | $1.91 | 44d | 1 | 1.23mi |
| 1403 Lead St Norfolk, VA | 4.0 | 2.5 | 1854 | $2,550 | $1.38 | 44d | 1 | 1.27mi |
| 2529 Tidewater Dr Norfolk, VA | 3.0 | 2.5 | 2025 | $2,370 | $1.17 | 24d | 1 | 1.27mi |
| 3819 Pamlico Cir Norfolk, VA | 3.0 | 1.0 | 1250 | $2,000 | $1.60 | 12d | 1 | 1.31mi |
| 1022 Kenton Ave Norfolk, VA | 3.0 | 2.0 | 1400 | $2,400 | $1.71 | 10d | 1 | 1.40mi |
| 2700 Myrtle Ave Norfolk, VA | 3.0 | 3.0 | 1888 | $2,600 | $1.38 | 44d | 1 | 1.42mi |
| 3114 Luxembourg Ave Norfolk, VA | 4.0 | 2.5 | 2300 | $3,100 | $1.35 | 17d | 1 | 1.44mi |
| 1320 Gabriel Dr Norfolk, VA | 4.0 | 1.5 | 1812 | $2,495 | $1.38 | 44d | 1 | 1.47mi |
Listing history 19 events
-
2026-06-18days on market $175,000 Active 198 DOM
-
2026-06-17days on market $175,000 Active 197 DOM
-
2026-06-16days on market $175,000 Active 196 DOM
-
2026-06-15days on market $175,000 Active 195 DOM
-
2026-06-13days on market $175,000 Active 193 DOM
-
2026-06-09days on market $175,000 Active 189 DOM
-
2026-06-08days on market $175,000 Active 188 DOM
-
2026-06-07days on market $175,000 Active 187 DOM
-
2026-06-03days on market $175,000 Active 183 DOM
-
2026-06-02days on market $175,000 Active 182 DOM
-
2026-06-01days on market $175,000 Active 181 DOM
-
2026-05-31days on market $175,000 Active 180 DOM
-
2025-12-02$175,000 Active 259-char remark
Show marketing remark (259 chars)
This property is a great Investment opportunity. The house is offered together with adjacent lot 3504 Tait Terrance priced separately. There is great potential for this nice corner lot. Selling as-is where-is; seller to do no repairs. Rehab loan or Cash only.
-
2025-04-25historical
-
2025-02-07historical Active Under Contract
-
2024-10-25$175,000 Active
-
2006-01-11soldstatus $155,000
-
2004-06-23soldstatus $115,000
-
1993-10-19soldstatus $62,500
ⓘ Source: listings_history table (triggers on properties + properties_extension) + one-shot
backfill from property_details.listing_events for pre-trigger history.
Tax reassessment forecast VA · Resets to sale price
- Current annual tax
- $2,999 · $250/mo
- Projected year-2 tax
- $2,999 · $250/mo
- Expected delta
- $0/yr ($0/mo · 0.0%)
ⓘ Screening estimate from a state-policy table — verify with the county assessor before closing.
Climate risk First Street
- Flood 1/10 Low FEMA zone X (unshaded) · 0% chance over 30 yrs
- Wildfire 1/10 Low
- Heat 9/10 Extreme 7 d/yr ≥105°F today · 16 d/yr by 30 yrs out
- Wind 8/10 Severe 80% chance of damaging wind over 30 yrs
- Air quality 3/10 Moderate 2 unhealthy d/yr today · 3 by 30 yrs out
Nearby sold comps map
Loading sold comps map…
Walkable amenities ~0.75 mi
Loading nearby amenities…
Taxation est. · year 1
- Rental income
- $27,981
- − Mortgage interest
- −$9,803
- − Property taxes
- −$2,999
- − Insurance
- −$875
- − Repairs & maintenance
- −$2,238
- − Management
- −$2,238
- − Depreciation
- −$5,091
- Taxable income
- $4,737
- Est. tax owed @ 24.0%
- −$1,137
- After-tax cash flow
- $6,082/yr
For passive investors: Depreciation is non-cash, so a rental often shows a tax loss while cash-flowing — sheltering income. Rental losses are passive: they offset passive income freely, and up to $25,000/yr can offset ordinary (W-2) income if you actively participate and your MAGI is under $100k (phasing out to $0 by $150k); unused losses carry forward. On sale, claimed depreciation is recaptured at up to 25%, and gains may owe capital-gains tax (a 1031 exchange can defer both). Figures are a year-1 estimate at your 24.0% rate — not tax advice; consult a CPA.
Schools (NCES district)
- District
- Norfolk City Public School District
- NCES district ID
- 5102670
- Math proficiency
- 27% ▼ -44.00%
- Reading proficiency
- 56% ▼ -10.00%
- Median HH income
- $44,358
- Composite
- 35.08/100
- National rank
- #5026
- State rank
- #118 of 131 in VA
Livability — Norfolk
- Score
- 83/100
- State rank
- #43
- US rank
- #1026
Category grades
Schools grade is shown separately in the Schools card above.
Census & demographics
- Census place
- Norfolk, VA
- County
- Norfolk City · 214,042 people
- City population
- 214,042
- Metro
- Virginia Beach-Norfolk-Newport News, VA-NC
- Population (ZIP)
- 28,628
- Household income
- $68,380
- Rent vs Own
- Severe rent burden
- 1342.0
Population outlook (Norfolk County) Hauer SSP2
- Today (2025)
- 249,032 people
- By 2030
- 252,347 · +1.3%
- By 2040
- 253,644 · +1.9%
- By 2050
- 251,913 · +1.2%
- By 2075
- 245,281 · -1.5%
- By 2100
- 219,548 · -11.8%
Race, ethnicity, and origin ACS 2023
- Neighborhood character
- Diverse neighborhood (Simpson 0.63)
- Race & ethnicity
- Black 55% White 23% Hispanic / Latino 11% Two or more races 7% Asian 5%
- Hispanic origin (detail)
- Mexican 4% Puerto Rican 3%
- Common ancestry
- Romanian 1% Slovak 1% Lithuanian 0%
- Foreign-born
- 10% · Canada
- Languages at home
- 87% English-only · Spanish 6% Tagalog/Filipino 4% French/Haitian/Cajun 1%
Political lean MEDSL · Norfolk
- 2024 margin
- Solid D (+41.5) · D 70.0% · R 28.5% · Other 1.6%
- 2008→2024 swing
- -1.4pp toward R · 2008: 43.0pp · 2024: 41.5pp
- All cycles
- 2024: D+41.5 2020: D+45.6 2016: D+42.0 2012: D+44.0 2008: D+43.0
Not yet ingested
- Civics
- —
Market trends
- HPI YoY
- ▼ -33.67%
- Current HPI
- 329.2241
- Rent YoY
- ▲ 3.42%
- Metro
- Virginia Beach-Norfolk-Newport News, VA-NC
- State GDP YoY
- ▲ 2.40%
- F500 in state
- 50
Industry mix (Fortune 500 HQ in VA)
| Industry | F500 HQs | Revenue |
|---|---|---|
| Aerospace / Defense | 4 | $236B |
|
||
| Technology / Defense | 3 | $32B |
|
||
| Financial Services | 2 | $176B |
|
||
| Utilities | 2 | $27B |
|
||
| Insurance | 2 | $25B |
|
||
| Technology | 2 | $15B |
|
||
Price history
+180.0% since first listed7 events — show timeline
- 2025-12-02 Listed $175,000 REINMLS
- 2025-04-25 Listing Removed — REINMLS
- 2025-02-07 Contingent — REINMLS
- 2024-10-25 Listed $175,000 REINMLS
- 2006-01-11 Sold (Public Records) $155,000 Public Records
- 2004-06-23 Sold (Public Records) $115,000 Public Records
- 1993-10-19 Sold (Public Records) $62,500 Public Records
Property tax history
+4.9%/yrLatest (2025): $2,999 · +5.8% YoY. Source: county tax records.
Cash-flow waterfall
monthlySold comps — $/sqft
last 12 mo · ≤1 miLoading sold comps…