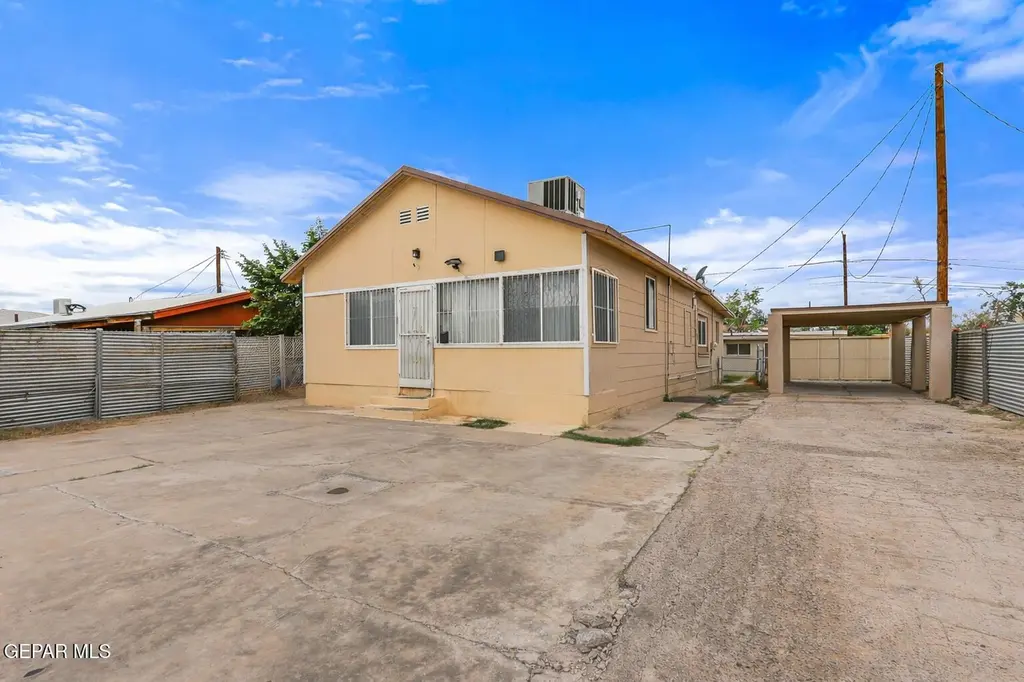
209 N Seville Dr · El Paso, TX
Flood risk 4/10 · Minor
- FEMA flood zone
- AH
- Chance of flooding over 30 yrs
- 0.24%
- Est. flood insurance / yr
- $1,142 – $2,507
Fire risk 1/10 · Minimal
- Est. fire insurance / yr
- $1,222 – $2,270
Heat risk 6/10 · Moderate
- Hot days now (above 102°F)
- 7 days/yr
- Hot days in 30 yrs
- 25 days/yr
Wind risk 1/10 · Minimal
- Chance of severe wind over 30 yrs
- —
Air-quality risk 2/10 · Minimal
- Unhealthy air days now
- 1 days/yr
- Unhealthy air days in 30 yrs
- 2 days/yr
Risk factors via First Street. Map © Google.
Why this score? — see what drove the F grade
The composite is a weighted blend of 9 inputs, each scored 0–100. Each bar is that input's sub-score; the figure is the points it added to the 100-point composite (weight × sub-score).
- Appreciation +10.0/10.0
- ARV discount +7.5/15.0
- Livability +4.0/5.0
- Schools +2.7/10.0
- Rent growth +2.5/5.0
- Condition / age +2.5/5.0
- Cash flow +0.1/30.0
- 1% rule +0.0/10.0
- DSCR +0.0/10.0
$174,900
🖨 Deal sheet 📄 Offer letter ✓ Due diligence
Listing remarks MLS
Income-producing triplex offering a strong opportunity for investors seeking diversified unit sizes and rental flexibility. The property features three separate units consisting of approximately 1,250 sq ft, 550 sq ft, and 350 sq ft, providing a desirable mix for tenant demand and optimized cash flow. The larger unit offers a more spacious layout suitable for long-term occupancy, while the two smaller units are ideal for efficient rentals with lower operating costs. This configuration allows investors to balance rental income across multiple tenant profiles and mitigate vacancy risk. Whether you are looking to add a cash-flowing asset to your portfolio, pursue a value-add strategy, or house-hack with supplemental income, this triplex presents a compelling opportunity. Convenient layout, multiple income streams, and strong rental potential make this property a solid investment option.
Key facts
- 6,098 sq ft lot
- Built 1941
- Listed 119 days
Neighborhood map
What this means for you Summary
Snapshot
- This is a ?-bed/1.0-bath single-family listed at $175k.
Deal economics
- At list price, monthly cash flow is $-943 ($-11k/yr) — negative.
- To cash-flow at today's rent, offer at most $73k (58.4% below list).
- To meet the 1% rule (rent ≥ 1% of price), the offer needs to be $83k (52.6% below list).
- Recommended offer: $73k (58.4% below list) — sets the bar for cash-flow.
Location & tenants
- Location reads 81/100 on livability (#23 in TX, #1,375 nationally) — a professional / high-income tenant draw. Strengths: commute A+, cost of living A+, housing A+; Watch: employment D+.
- El Paso ISD (urban): math 27% / reading 37% proficiency, ranked #591 of 826 in TX (top 72%) — families likely to look elsewhere, expect single-tenant / working-renter base with shorter leases; 65% free/reduced lunch — lower-income household profile, screen leases tightly.
- Market conditions: 60 active listings in the ZIP; 5 comparable units currently listed for rent nearby; rentals at typical pace (median 24d on market — plan ~3-4 weeks tenant-placement turnaround); 40% of comp listings sitting > 30 days — soft ceiling on asking rent; 2,196 units permitted in El Paso County in 2024 (143 in 5+ unit buildings).
Forward outlook
- In year one you build about $19k of equity ($1k loan paydown + $17k appreciation (10.0% local appreciation)).
- El Paso County population projected at +10% by 2050 — modest demand growth; plan on rents tracking national, not racing it.
- By year 2, paydown + projected appreciation supports a ~$30k cash-out refi (75% LTV) — recoverable capital for the next deal without selling this one.
Negotiation context
- It's been on market 119 days — a 9% lower offer ($159k) is reasonable based on typical stale-listing flexibility.
- 11 sale attempts since 11y ago; this cycle's ask is 24886% above the opening price — seller raised mid-cycle; expect resistance to lowballs.
Risks & watch-outs
- Watch-outs: property tax is 3.1% of price; flood insurance adds $152/mo; built in 1941 — expect roof / HVAC / electrical / plumbing capex.
- Climate carrying-cost: in FEMA flood zone AH (mandatory federal flood insurance); extreme-heat days projected 7→25/yr by 2055 (HVAC capex compounding) — expect insurance premiums to compound above CPI over the hold.
Questions for the listing agent
- What do current leases actually rent for vs. the listed asking? Can we see a recent rent roll and the last 12 months of T-12 income?
- It's been on market 119 days. Have you received any prior offers? Is the seller open to a 58% concession, seller financing, or rate buy-down credit?
- Built in 1941 — when were the roof, HVAC, electrical panel, plumbing, and water heater last replaced?
- Property tax is high relative to price — has the assessment been appealed recently, and will the sale trigger a re-assessment?
- What's the actual annual flood-insurance premium (NFIP or private), and is the property in a SFHA with mandatory coverage?
- Why hasn't it sold? Are there any deal-killer items the seller is aware of (foundation, flood, title, zoning, code violations)?
- Is there a deadline driving the sale (1031 exchange, divorce, estate, relocation)? That informs how much negotiation room exists.
- Schools are B-rated — typically a magnet for longer-tenancy family renters. What's the average tenant stay here, and is there a school-zone premium baked into asking?
- The area grade is low — what's the realistic commute time and amenity access for the typical tenant pool here? Any planned neighborhood developments (good or bad) we should know about?
- What's the average days-on-market for RENTAL listings here right now (not sales)? A rising rental-DOM trend means longer vacancies and softer asking-rent achievability than the comps imply.
- What's the recent tenant-quality profile in this submarket — average credit score on applications, eviction rate, late-payment / NSF rate, and stable-employment percentage? A property-management company in the area should have these aggregated.
- How much new for-sale + rental construction is in the pipeline within 1–3 miles? Heavy new supply typically softens prices + rents 12–24 months out; constrained supply supports both.
Investment metrics
- 1% rule
- 0.47% ✗
- Cap rate
- 0.87%
- Cash-on-cash
- -19.38%
- DSCR
- 0.14
- GRM
- 17.6
CMA / ARV
No comps found within radius.
Projected returns pro-forma
10.0% appreciation · 3.0% rent growth · sell at horizon
- IRR
- 8.6%
- Equity multiple
- 1.72×
- Total profit
- $35,453
- Equity at exit
- $157,564
- IRR
- 10.4%
- Equity multiple
- 4.11×
- Total profit
- $152,130
- Equity at exit
- $339,792
Cash invested: $48,972 (down + closing). Projections, not guarantees.
Landlord ↔ Tenant lean methodology
- Overall (STATE)
- 87 Strongly Landlord-Friendly
- State Texas
- 87 Strongly Landlord-Friendly · R+5
- County
- — inherits STATE
- City
- — inherits STATE
ZIP-level market 79905
- Home prices YoY
- 12.8%
- Active inventory
- 60
- Price-to-rent
- 17.6×
Monthly cashflow live
- Estimated rent
- $829 high interval (Pro) →
- Mortgage (P&I)
- −$917
- Tax from tax record
- −$456 /mo · $5,466/yr
- Insurance
- −$73
- Flood insurance flood zone
- −$152 /mo · $1,824/yr
- HOA
- −$0
- Vacancy / Maint / Mgmt
- −$174
- Net cashflow
- $-943
Break-even live
UW: 25.0% down · 7.5% · 30yr · 1.5% tax · 5.0% vac · 8.0% maint · 8.0% mgmt
Financing live
Cash to close
- Down payment
- $43,725
- Closing costs
- $5,247
- Reserves months
- —
- Total cash needed
- —
Loan-product check · same deal, 3 products live
Conventional
25% down · 7.5% · 30yr
- Down + closing
- —
- Monthly P&I
- —
- Monthly cashflow
- —
- DSCR
- —
- Eligible?
- —
Personal DTI + credit; lowest rate.
DSCR
20% down · 8.5% · 30yr
- Down + closing
- —
- Monthly P&I
- —
- Monthly cashflow
- —
- DSCR
- —
- Eligible?
- —
No personal income docs; deal must DSCR.
Hard money
10% down · 12.0% · 12mo
- Down + closing
- —
- Monthly P&I
- —
- Monthly cashflow
- —
- DSCR
- —
- Eligible?
- —
Short-term bridge; refi at stabilization.
Rent comps 5 comps
| Address | Beds | Baths | Sqft | Rent | $/sqft | DOM | Units | Dist |
|---|---|---|---|---|---|---|---|---|
| 209 N Seville Dr Unit B El Paso, TX | 1.0 | 1.0 | 550 | $850 | $1.55 | 2d | 1 | 0.02mi |
| 6155 Cleveland Ave Unit Back El Paso, TX | 1.0 | 1.0 | 520 | $850 | $1.63 | 2d | 1 | 0.66mi |
| 205 N Little Flower Rd Unit B El Paso, TX | 1.0 | 1.0 | 420 | $725 | $1.73 | 43d | 1 | 0.96mi |
| 6400 Edgemere Blvd Unit 23 El Paso, TX | 1.0 | 1.0 | 626 | $800 | $1.28 | 43d | 1 | 1.16mi |
| 6400 Edgemere Blvd Unit 8A El Paso, TX | 1.0 | 1.0 | 626 | $695 | $1.11 | 23d | 1 | 1.16mi |
Listing history 29 events
-
2026-02-24price $189,400 902-char remark
Show marketing remark (902 chars)
Income-producing triplex offering a strong opportunity for investors seeking diversified unit sizes and rental flexibility. The property features three separate units consisting of approximately 1,250 sq ft, 550 sq ft, and 350 sq ft, providing a desirable mix for tenant demand and optimized cash flow. The larger unit offers a more spacious layout suitable for long-term occupancy, while the two smaller units are ideal for efficient rentals with lower operating costs. This configuration allows investors to balance rental income across multiple tenant profiles and mitigate vacancy risk. Whether you are looking to add a cash-flowing asset to your portfolio, pursue a value-add strategy, or house-hack with supplemental income, this triplex presents a compelling opportunity. Convenient layout, multiple income streams, and strong rental potential make this property a solid investment option.
-
2026-02-11price $194,400 902-char remark
Show marketing remark (902 chars)
Income-producing triplex offering a strong opportunity for investors seeking diversified unit sizes and rental flexibility. The property features three separate units consisting of approximately 1,250 sq ft, 550 sq ft, and 350 sq ft, providing a desirable mix for tenant demand and optimized cash flow. The larger unit offers a more spacious layout suitable for long-term occupancy, while the two smaller units are ideal for efficient rentals with lower operating costs. This configuration allows investors to balance rental income across multiple tenant profiles and mitigate vacancy risk. Whether you are looking to add a cash-flowing asset to your portfolio, pursue a value-add strategy, or house-hack with supplemental income, this triplex presents a compelling opportunity. Convenient layout, multiple income streams, and strong rental potential make this property a solid investment option.
-
2026-02-10$700
-
2026-02-10historical $750
-
2026-01-28$204,900 Active 902-char remark
Show marketing remark (902 chars)
Income-producing triplex offering a strong opportunity for investors seeking diversified unit sizes and rental flexibility. The property features three separate units consisting of approximately 1,250 sq ft, 550 sq ft, and 350 sq ft, providing a desirable mix for tenant demand and optimized cash flow. The larger unit offers a more spacious layout suitable for long-term occupancy, while the two smaller units are ideal for efficient rentals with lower operating costs. This configuration allows investors to balance rental income across multiple tenant profiles and mitigate vacancy risk. Whether you are looking to add a cash-flowing asset to your portfolio, pursue a value-add strategy, or house-hack with supplemental income, this triplex presents a compelling opportunity. Convenient layout, multiple income streams, and strong rental potential make this property a solid investment option.
-
2026-01-10historical
-
2026-01-08price $209,900
-
2026-01-07$750
-
2026-01-06$1,290
-
2025-12-18price $229,900
-
2025-10-28price $239,900
-
2025-10-17price $260,000
-
2025-10-02price $270,000
-
2025-07-22$275,000 Active
-
2019-11-13soldstatus
-
2019-11-06status Pending
-
2019-09-07$115,000 Active
-
2018-12-07historical
-
2017-01-22historical
-
2017-01-22historical
-
2016-04-23status Active
-
2016-04-23status Active
-
2016-03-18historical
-
2016-03-18historical
-
2016-03-08$115,000 Active
-
2016-01-23$115,000 Active
-
2015-01-13$129,000
-
2014-08-22soldstatus
-
2014-08-22soldstatus
ⓘ Source: listings_history table (triggers on properties + properties_extension) + one-shot
backfill from property_details.listing_events for pre-trigger history.
Tax reassessment forecast TX · Resets to sale price
- Current annual tax
- $5,466 · $456/mo
- Projected year-2 tax
- $5,466 · $456/mo
- Expected delta
- $0/yr ($0/mo · 0.0%)
ⓘ Screening estimate from a state-policy table — verify with the county assessor before closing.
Climate risk First Street
- Flood 4/10 Moderate FEMA zone AH · 24% chance over 30 yrs
- Wildfire 1/10 Low
- Heat 6/10 Major 7 d/yr ≥102°F today · 25 d/yr by 30 yrs out
- Wind 1/10 Low
- Air quality 2/10 Low 1 unhealthy d/yr today · 2 by 30 yrs out
Nearby sold comps map
Loading sold comps map…
Walkable amenities ~0.75 mi
Loading nearby amenities…
Taxation est. · year 1
- Rental income
- $9,945
- − Mortgage interest
- −$9,797
- − Property taxes
- −$5,466
- − Insurance
- −$2,699
- − Repairs & maintenance
- −$796
- − Management
- −$796
- − Depreciation
- −$5,088
- Taxable loss
- −$14,696
- Est. tax savings @ 24.0%
- +$3,527
- After-tax cash flow
- $-7,788/yr
For passive investors: Depreciation is non-cash, so a rental often shows a tax loss while cash-flowing — sheltering income. Rental losses are passive: they offset passive income freely, and up to $25,000/yr can offset ordinary (W-2) income if you actively participate and your MAGI is under $100k (phasing out to $0 by $150k); unused losses carry forward. On sale, claimed depreciation is recaptured at up to 25%, and gains may owe capital-gains tax (a 1031 exchange can defer both). Figures are a year-1 estimate at your 24.0% rate — not tax advice; consult a CPA.
Schools (NCES district)
- District
- El Paso ISD
- NCES district ID
- 4818300
- Math proficiency
- 27% ▼ -24.00%
- Reading proficiency
- 37% ▼ -7.00%
- Median HH income
- $38,704
- Composite
- 26.75/100
- National rank
- #7138
- State rank
- #591 of 826 in TX
Livability — El Paso
- Score
- 81/100
- State rank
- #23
- US rank
- #1375
Category grades
Schools grade is shown separately in the Schools card above.
Census & demographics
- Census place
- El Paso, TX
- City population
- 630,223
- Population (ZIP)
- 22,062
Population outlook (El Paso County) Hauer SSP2
- Today (2025)
- 897,899 people
- By 2030
- 922,694 · +2.8%
- By 2040
- 960,492 · +7.0%
- By 2050
- 982,919 · +9.5%
- By 2075
- 997,266 · +11.1%
- By 2100
- 900,630 · +0.3%
Race, ethnicity, and origin ACS 2023
- Neighborhood character
- Predominantly Hispanic (93%)
- Race & ethnicity
- Hispanic / Latino 93% Two or more races 50% White 2% Native American 1% Pacific Islander 1%
- Hispanic origin (detail)
- Mexican 89%
- Foreign-born
- 32% · Canada
- Languages at home
- 14% English-only · Spanish 86%
Political lean MEDSL · El Paso
- 2024 margin
- D (+15.1) · D 57.0% · R 41.8% · Other 1.2%
- 2008→2024 swing
- -17.4pp toward R · 2008: 32.5pp · 2024: 15.1pp
- All cycles
- 2024: D+15.1 2020: D+35.1 2016: D+43.2 2012: D+32.6 2008: D+32.5
Not yet ingested
- Civics
- —
Market trends
- HPI YoY
- ▲ 29.29%
- Current HPI
- 258.3487
- Rent YoY
- —
- Metro
- —
- State GDP YoY
- ▲ 3.95%
- F500 in state
- 110
Industry mix (Fortune 500 HQ in TX)
| Industry | F500 HQs | Revenue |
|---|---|---|
| Energy | 16 | $1,198B |
|
||
| Technology | 5 | $198B |
|
||
| Engineering / Construction | 4 | $72B |
|
||
| Energy Services | 3 | $60B |
|
||
| Utilities | 3 | $41B |
|
||
| Healthcare | 2 | $330B |
|
||
Price history
+46.8% since first listed29 events — show timeline
- 2026-02-24 Price Changed $189,400 GEPARMLS
- 2026-02-11 Price Changed $194,400 GEPARMLS
- 2026-02-10 Listed for Rent $700 GEPARMLS
- 2026-02-10 Rental Removed $750 GEPARMLS
- 2026-01-28 Listed $204,900 GEPARMLS
- 2026-01-10 Listing Removed — GEPARMLS
- 2026-01-08 Price Changed $209,900 GEPARMLS
- 2026-01-07 Listed for Rent $750 GEPARMLS
- 2026-01-06 Listed for Rent $1,290 GEPARMLS
- 2025-12-18 Price Changed $229,900 GEPARMLS
- 2025-10-28 Price Changed $239,900 GEPARMLS
- 2025-10-17 Price Changed $260,000 GEPARMLS
- 2025-10-02 Price Changed $270,000 GEPARMLS
- 2025-07-22 Listed $275,000 GEPARMLS
- 2019-11-13 Sold (Public Records) — Public Records
- 2019-11-06 Pending — GEPARMLS
- 2019-09-07 Listed $115,000 GEPARMLS
- 2018-12-07 Listing Removed — GEPARMLS
- 2017-01-22 Listing Removed — GEPARMLS
- 2017-01-22 Listing Removed — GEPARMLS
- 2016-04-23 Relisted — GEPARMLS
- 2016-04-23 Relisted — GEPARMLS
- 2016-03-18 Listing Removed — GEPARMLS
- 2016-03-18 Listing Removed — GEPARMLS
- 2016-03-08 Listed $115,000 GEPARMLS
- 2016-01-23 Listed $115,000 GEPARMLS
- 2015-01-13 Listed $129,000 GEPARMLS
- 2014-08-22 Sold (Public Records) — Public Records
- 2014-08-22 Sold (Public Records) — Public Records
Property tax history
+9.0%/yrLatest (2025): $5,466 · +22.2% YoY. Source: county tax records.
Cash-flow waterfall
monthlySold comps — $/sqft
last 12 mo · ≤1 miLoading sold comps…