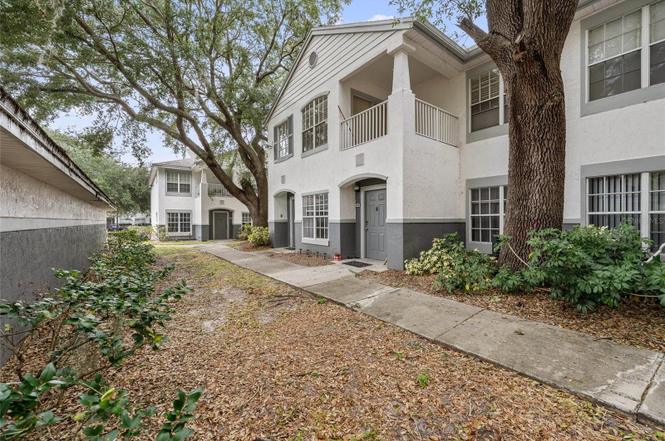
4356 S Kirkman Rd #514 · Orlando, FL
Flood risk No data
- FEMA flood zone
- —
- Chance of flooding over 30 yrs
- —
- Est. flood insurance / yr
- —
Fire risk No data
- Est. fire insurance / yr
- —
Heat risk No data
- Hot days now (above threshold)
- —
- Hot days in 30 yrs
- —
Wind risk No data
- Chance of severe wind over 30 yrs
- —
Air-quality risk No data
- Unhealthy air days now
- —
- Unhealthy air days in 30 yrs
- —
Risk factors via First Street. Map © Google.
Why this score? — see what drove the D grade
The composite is a weighted blend of 9 inputs, each scored 0–100. Each bar is that input's sub-score; the figure is the points it added to the 100-point composite (weight × sub-score).
- Cash flow +12.1/30.0
- 1% rule +7.9/10.0
- ARV discount +7.5/15.0
- Livability +4.3/5.0
- Schools +4.1/10.0
- DSCR +3.6/10.0
- Rent growth +2.5/5.0
- Condition / age +2.5/5.0
- Appreciation +0.0/10.0
$165,000
🖨 Deal sheet (PDF) 📄 Offer letter ✓ Due diligence
Listing remarks
Spacious two-bedroom, two-bath walk-up condominium with a den and private balcony, featuring high ceilings and a one-car garage, in the Sunset Lake community of MetroWest. The open living room and den create a flexible, inviting layout filled with abundant natural light, while the kitchen features granite countertops for added style and functionality. The unit includes a new air conditioner installed Aug. 30, 2022, and offers low-maintenance condominium living ideal for everyday convenience and long-term ownership. Community amenities include a fitness center, swimming pool, clubhouse and outdoor grilling area overlooking a scenic 89-acre lake. Publix Super Market is within short distance,
Key facts
- Fitness center
- Clubhouse
- Private balcony
Tags
Property features AI
Finance
- Other: Unit is unfurnished
- Financial info: Total annual HOA/fees $6,253.08; Lease restrictions apply
- HOA & community: Monthly HOA dues of $521.09 (includes building and grounds maintenance, management, and pool); Association approval required; Community clubhouse and pool; Pets allowed
Exterior
- Parking: 1-car garage
- Utilities: Public water; Public sewer; Public utilities
- Home design: Condominium; 2 total stories; South-facing
- Construction: Stucco and frame construction; Shingle roof; Slab foundation; Building identified as BLDG 5; Built as part of a multi-building condominium community
- Exterior features: Exterior lighting; Playground; Sidewalks; Asphalt road access
Interior
- Kitchen: Dishwasher; Microwave; Range hood; Refrigerator
- Bedrooms: 2 bedrooms (Unit on 2nd floor)
- Flooring: Laminate; Tile
- Bathrooms: 2 full bathrooms
- Heating & cooling: Central heating; Central air conditioning
- Interior features: Ceiling fans
- Laundry & utility: Laundry closet
Neighborhood map
What this means for you Summary
Snapshot
- This is a 2-bed/2.0-bath condo listed at $165k.
Deal economics
- At list price, monthly cash flow is $-37 ($-447/yr) — negative.
- To cash-flow at today's rent, offer at most $158k (4.0% below list).
- Meets the 1% rule at list price ($2k rent vs $165k).
- Recommended offer: $145k (12.0% below list) — sets the bar for market timing.
- Cap rate 6.0% vs local median 3.0% in Orlando — top-decile yield for the area; either an underpriced asset or a hidden risk that comps aren't pricing in. Stress-test before assuming the spread holds.
Location & tenants
- Location reads 86/100 on livability (#12 in FL, #360 nationally) — a professional / high-income tenant draw. Strengths: amenities A+, commute A+, housing A+.
- Orange (suburban): math 46% / reading 51% proficiency, ranked #43 of 73 in FL (top 59%) — families likely to look elsewhere, expect single-tenant / working-renter base with shorter leases.
- Zoned schools: Windy Ridge K-8 (math 68% / reading 68%, grade B+, #425 of 2,144 statewide, top 20%, 1,173 students, 41% FRL); Chain of Lakes Middle (math 39% / reading 37%, grade F, #388 of 571 statewide, top 69%, 1,209 students, 46% FRL); Olympia High (math 24% / reading 52%, grade F, #328 of 667 statewide, top 50%, 2,969 students, 47% FRL).
- Market conditions: Rents flat; 241 active listings in the ZIP; 40 comparable units currently listed for rent nearby; rentals at typical pace (median 20d on market — plan ~3-4 weeks tenant-placement turnaround); 8,053 units permitted in Orange County in 2024 (3,133 in 5+ unit buildings).
- At $2,123/mo this rent would consume 47% of the median local household income ($54k/yr) (locally 2728% of renters already pay >50% of income on rent) — very limited rent-growth headroom before tenants either downsize or default.
Forward outlook
- Local home prices are declining (-3.0%/yr); year-one equity from $1k of loan paydown is wiped out by about $5k of value loss. Plan a longer hold.
- Orange County population projected at +52% by 2050 — long-run rental-demand tailwind backs the buy-and-hold thesis.
Negotiation context
- It's been on market 152 days — a 12% lower offer ($145k) is reasonable based on typical stale-listing flexibility.
Risks & watch-outs
- Watch-outs: HOA is 25% of rent.
Questions for the listing agent
- What do current leases actually rent for vs. the listed asking? Can we see a recent rent roll and the last 12 months of T-12 income?
- It's been on market 152 days. Have you received any prior offers? Is the seller open to a 12% concession, seller financing, or rate buy-down credit?
- What does the HOA fee cover, when was the last increase, and are there any pending special assessments or reserve-fund shortfalls?
- Any open or pending special assessments — roof, HVAC, plumbing, elevator, façade? What's the per-unit balance and payoff schedule, and is the seller paying it off at close or rolling it to the buyer?
- Why hasn't it sold? Are there any deal-killer items the seller is aware of (foundation, flood, title, zoning, code violations)?
- Is there a deadline driving the sale (1031 exchange, divorce, estate, relocation)? That informs how much negotiation room exists.
- Schools are B-rated — typically a magnet for longer-tenancy family renters. What's the average tenant stay here, and is there a school-zone premium baked into asking?
- The area grade is low — what's the realistic commute time and amenity access for the typical tenant pool here? Any planned neighborhood developments (good or bad) we should know about?
- What's the average days-on-market for RENTAL listings here right now (not sales)? A rising rental-DOM trend means longer vacancies and softer asking-rent achievability than the comps imply.
- What's the recent tenant-quality profile in this submarket — average credit score on applications, eviction rate, late-payment / NSF rate, and stable-employment percentage? A property-management company in the area should have these aggregated.
- How much new apartment / multifamily construction is in the pipeline within 1–3 miles? Heavy new supply (>2% of stock underway) typically softens rents 12–24 months out; light construction supports rent growth.
Investment metrics
- 1% rule
- 1.29% ✓
- Cap rate
- 6.02%
- Cash-on-cash
- -0.97%
- DSCR
- 0.96
- GRM
- 6.5
CMA / ARV
No comps found within radius.
Projected returns pro-forma
-3.0% appreciation · 0.15% rent growth · sell at horizon
- IRR
- -22.6%
- Equity multiple
- 0.25×
- Total profit
- $-34,642
- Equity at exit
- $24,602
- IRR
- -34.9%
- Equity multiple
- -0.18×
- Total profit
- $-54,597
- Equity at exit
- $14,266
Cash invested: $46,200 (down + closing). Projections, not guarantees.
Landlord ↔ Tenant lean methodology
- Overall (STATE)
- 87 Strongly Landlord-Friendly
- State Florida
- 87 Strongly Landlord-Friendly · R+3
- County
- — inherits STATE
- City
- — inherits STATE
ZIP-level market 32811
- Home prices YoY
- -33.8%
- Rents YoY
- 0.1%
- Active inventory
- 241
- Price-to-rent
- 6.5×
Monthly cashflow live
- Estimated rent
- $2,123 high interval (Pro) →
- Mortgage (P&I)
- −$865
- Tax from tax record
- −$259 /mo · $3,109/yr
- Insurance
- −$69
- HOA
- −$521
- Vacancy / Maint / Mgmt
- −$446
- Net cashflow
- $-37
Break-even live
Sensitivity live
| Price | -10% $56 | -5% $9 | +0% $-37 | +5% $-84 | +10% $-131 |
|---|---|---|---|---|---|
| Rent | -10% $-205 | -5% $-121 | +0% $-37 | +5% $47 | +10% $130 |
| Rate | -1.0pp $46 | -0.5pp $5 | base $-37 | +0.5pp $-80 | +1.0pp $-123 |
UW: 25.0% down · 7.5% · 30yr · 1.5% tax · 5.0% vac · 8.0% maint · 8.0% mgmt
Financing live
Cash to close
- Down payment
- $41,250
- Closing costs
- $4,950
- Reserves months
- —
- Total cash needed
- —
Loan-product check · same deal, 3 products live
Conventional
25% down · 7.5% · 30yr
- Down + closing
- —
- Monthly P&I
- —
- Monthly cashflow
- —
- DSCR
- —
- Eligible?
- —
Personal DTI + credit; lowest rate.
DSCR
20% down · 8.5% · 30yr
- Down + closing
- —
- Monthly P&I
- —
- Monthly cashflow
- —
- DSCR
- —
- Eligible?
- —
No personal income docs; deal must DSCR.
Hard money
10% down · 12.0% · 12mo
- Down + closing
- —
- Monthly P&I
- —
- Monthly cashflow
- —
- DSCR
- —
- Eligible?
- —
Short-term bridge; refi at stabilization.
Rent comps 40 comps
| Address | Beds | Baths | Sqft | Rent | $/sqft | DOM | Units | Dist |
|---|---|---|---|---|---|---|---|---|
| 4356 S Kirkman Rd Orlando, FL | 2.0 | 2.0 | 996 | $2,300 | $2.31 | 25d | 2 | 0.02mi |
| 4332 S Kirkman Rd #1003 Orlando, FL | 1.0 | 1.0 | 729 | $1,350 | $1.85 | 5d | 1 | 0.07mi |
| 4352 S Kirkman Rd #1203 Orlando, FL | 2.0 | 2.0 | 1200 | $3,000 | $2.50 | 23d | 1 | 0.08mi |
| 4352 S Kirkman Rd Orlando, FL | 1.0–2.0 | 1.0–2.0 | 964 | $3,000 | $3.11 | 4d | 2 | 0.08mi |
| 4352 S Kirkman Rd Orlando, FL | 1.0–2.0 | 1.0–2.0 | 964 | $3,000 | $3.11 | 0d | 2 | 0.08mi |
| 4324 S Kirkman Rd Orlando, FL | 1.0 | 1.0 | 730 | $2,700 | $3.70 | 25d | 1 | 0.11mi |
| 4312 S Kirkman Rd Orlando, FL | 3.0 | 2.0 | 1200 | $3,300 | $2.75 | 25d | 1 | 0.12mi |
| 4312 S Kirkman Rd Orlando, FL | 2.0 | 2.0 | 1000 | $3,000 | $3.00 | 12d | 1 | 0.12mi |
| 4368 S Kirkman Rd Orlando, FL | 1.0 | 1.0 | 730 | $2,700 | $3.70 | 25d | 1 | 0.12mi |
| 4368 S Kirkman Rd Orlando, FL | 1.0–2.0 | 1.0–2.0 | 863 | $2,700 | $3.13 | 16d | 2 | 0.12mi |
| 4320 S Kirkman Rd #1508 Orlando, FL | 2.0 | 2.0 | 1042 | $1,600 | $1.54 | 23d | 1 | 0.14mi |
| 6025 Oakshadow St Orlando, FL | 1.0–3.0 | 1.0–2.0 | 949 | $1,786 | $1.88 | 0d | 48 | 0.19mi |
| 4401 S Kirkman Rd Orlando, FL | 1.0–3.0 | 1.0–2.0 | 950 | $1,774 | $1.87 | 6d | 9 | 0.27mi |
| 5628 Blue Shadows Ct Unit 2 Orlando, FL | 2.0 | 2.0 | 1000 | $1,550 | $1.55 | 25d | 1 | 0.28mi |
| 5606 Blue Shadows Ct #10 Orlando, FL | 2.0 | 2.0 | 963 | $1,900 | $1.97 | 25d | 1 | 0.28mi |
| 4323 Pinebark Ave Unit 77-1 Orlando, FL | 2.0 | 2.0 | 963 | $1,450 | $1.51 | 19d | 1 | 0.36mi |
| 4448 Pinebark Ave Unit 56/1 Orlando, FL | 2.0 | 2.0 | 965 | $1,890 | $1.96 | 25d | 1 | 0.37mi |
| 4448 Pinebark Ave Orlando, FL | 2.0 | 2.0 | 965 | $1,890 | $1.96 | 18d | 1 | 0.39mi |
| 5501 Conroy Rd Orlando, FL | 2.0 | 1.5 | 930 | $1,399 | $1.50 | 0d | 3 | 0.43mi |
| 4434 Middlebrook Rd Unit 4 Orlando, FL | 3.0 | 3.0 | 1447 | $2,300 | $1.59 | 25d | 1 | 0.48mi |
| 4454 Middlebrook Rd #4454 Orlando, FL | 1.0 | 1.5 | 848 | $1,380 | $1.63 | 25d | 1 | 0.50mi |
| 4618 Middlebrook Rd Orlando, FL | 2.0 | 1.0–2.0 | 710 | $1,999 | $2.82 | 0d | 28 | 0.51mi |
| 4356 Middlebrook Rd Unit 3 Orlando, FL | 1.0 | 1.5 | 994 | $1,395 | $1.40 | 3d | 1 | 0.51mi |
| 4354 Middlebrook Rd #4354 Orlando, FL | 1.0 | 1.5 | 848 | $1,449 | $1.71 | 9d | 1 | 0.51mi |
| 6421 Conroy Rd Orlando, FL | 1.0–2.0 | 1.0–2.0 | 847 | $1,970 | $2.32 | 0d | 20 | 0.51mi |
| 5055 Eaglesmere Dr Unit D-04 Orlando, FL | 2.0 | 1.5 | 999 | $1,800 | $1.80 | 25d | 1 | 0.55mi |
| 5371 Bamboo Ct #401 Orlando, FL | 2.0 | 2.5 | 1285 | $1,000 | $0.78 | 25d | 1 | 0.56mi |
| 5349 Bamboo Ct #416 Orlando, FL | 2.0 | 2.5 | 1285 | $2,150 | $1.67 | 25d | 1 | 0.60mi |
| 5303 Indian Creek Dr Orlando, FL | 2.0 | 2.0 | 1123 | $1,500 | $1.34 | 4d | 1 | 0.61mi |
| 5082 Ernst Ct Orlando, FL | 2.0 | 2.5 | 1250 | $2,250 | $1.80 | 25d | 1 | 0.61mi |
| 4881 Cypress Woods Dr Orlando, FL | 2.0–3.0 | 2.0 | 1268 | $1,700 | $1.34 | 25d | 2 | 0.66mi |
| 5269 Middle Ct #130 Orlando, FL | 2.0 | 2.5 | 1285 | $1,800 | $1.40 | 19d | 1 | 0.68mi |
| 5755 Peregrine Ave Orlando, FL | 2.0 | 2.0 | 1139 | $1,600 | $1.40 | 6d | 1 | 0.68mi |
| 3355 S Kirkman Rd #1315 Orlando, FL | 2.0 | 1.0 | 890 | $1,650 | $1.85 | 0d | 1 | 0.69mi |
| 5932 Peregrine Ave Unit 22D Orlando, FL | 2.0 | 1.5 | 999 | $1,690 | $1.69 | 4d | 1 | 0.69mi |
| 3361 S Kirkman Rd Orlando, FL | 2.0–4.0 | 2.0 | 1411 | $1,595 | $1.13 | 25d | 2 | 0.69mi |
| 4849 Cypress Woods Dr #1102 Orlando, FL | 2.0 | 2.0 | 1107 | $1,925 | $1.74 | 25d | 1 | 0.70mi |
| 5942 Peregrine Ave Unit 22C Orlando, FL | 2.0 | 2.0 | 1139 | $1,495 | $1.31 | 16d | 1 | 0.71mi |
| 3397 S Kirkman Rd #1418 Orlando, FL | 3.0 | 2.0 | 1431 | $1,995 | $1.39 | 25d | 1 | 0.71mi |
| 3301 S Kirkman Rd Orlando, FL | 1.0–4.0 | 1.0–2.0 | 1288 | $1,825 | $1.42 | 0d | 20 | 0.71mi |
HOA detail condo
- Monthly dues
- $521 · $6,252/yr
- Likely covers
- poolgym
- Assessments
- None detected in remarks — confirm with the listing agent.
Listing history 19 events
-
2026-06-21days on market $165,000 Active 152 DOM
-
2026-06-18days on market $165,000 Active 149 DOM
-
2026-06-17days on market $165,000 Active 148 DOM
-
2026-06-16days on market $165,000 Active 147 DOM
-
2026-06-15days on market $165,000 Active 146 DOM
-
2026-06-13days on market $165,000 Active 144 DOM
-
2026-06-13days on market $165,000 Active 143 DOM
-
2026-06-09days on market $165,000 Active 140 DOM
-
2026-06-08days on market $165,000 Active 139 DOM
-
2026-06-07days on market $165,000 Active 138 DOM
-
2026-06-04days on market $165,000 Active 135 DOM
-
2026-06-03days on market $165,000 Active 134 DOM
-
2026-06-02days on market $165,000 Active 133 DOM
-
2026-06-02days on market $165,000 Active 132 DOM
-
2026-05-31days on market $165,000 Active 131 DOM
-
2026-05-08price $165,000
-
2026-04-08price $175,000
-
2026-01-20$185,000 Active
-
2022-12-15soldstatus $199,000
ⓘ Source: listings_history table (triggers on properties + properties_extension) + one-shot
backfill from property_details.listing_events for pre-trigger history.
Tax reassessment forecast FL · Resets to sale price
- Current annual tax
- $3,109 · $259/mo
- Projected year-2 tax
- $3,109 · $259/mo
- Expected delta
- $0/yr ($0/mo · 0.0%)
ⓘ Screening estimate from a state-policy table — verify with the county assessor before closing.
Nearby sold comps map
Loading sold comps map…
Walkable amenities ~0.75 mi
Loading nearby amenities…
Taxation est. · year 1
- Rental income
- $25,471
- − Mortgage interest
- −$9,243
- − Property taxes
- −$3,109
- − Insurance
- −$825
- − Repairs & maintenance
- −$2,038
- − Management
- −$2,038
- − HOA
- −$6,252
- − Depreciation
- −$4,800
- Taxable loss
- −$2,833
- Est. tax savings @ 24.0%
- +$680
- After-tax cash flow
- $233/yr
For passive investors: Depreciation is non-cash, so a rental often shows a tax loss while cash-flowing — sheltering income. Rental losses are passive: they offset passive income freely, and up to $25,000/yr can offset ordinary (W-2) income if you actively participate and your MAGI is under $100k (phasing out to $0 by $150k); unused losses carry forward. On sale, claimed depreciation is recaptured at up to 25%, and gains may owe capital-gains tax (a 1031 exchange can defer both). Figures are a year-1 estimate at your 24.0% rate — not tax advice; consult a CPA.
Schools (NCES district)
- District
- Orange
- NCES district ID
- 1201440
- Math proficiency
- 46% ▼ -9.00%
- Reading proficiency
- 51% ▼ -2.00%
- Median HH income
- $49,350
- Composite
- 41.47/100
- National rank
- #3461
- State rank
- #43 of 73 in FL
Livability — Orlando
- Score
- 86/100
- State rank
- #12
- US rank
- #360
Category grades
Schools grade is shown separately in the Schools card above.
Census & demographics
- Census place
- Orlando, FL
- County
- Orange County · 1,471,359 people
- City population
- 964,969
- Metro
- Orlando-Kissimmee-Sanford, FL
- Population (ZIP)
- 41,475
- Household income
- $54,082
- Rent vs Own
- Severe rent burden
- 2728.0
Population outlook (Orange County) Hauer SSP2
- Today (2025)
- 1,618,226 people
- By 2030
- 1,787,404 · +10.5%
- By 2040
- 2,125,621 · +31.4%
- By 2050
- 2,454,016 · +51.6%
- By 2075
- 3,173,711 · +96.1%
- By 2100
- 3,607,781 · +122.9%
Race, ethnicity, and origin ACS 2023
- Neighborhood character
- Diverse neighborhood (Simpson 0.66)
- Race & ethnicity
- Black 50% Hispanic / Latino 27% Two or more races 17% White 12% Asian 2%
- Hispanic origin (detail)
- Mexican 2% Puerto Rican 8% Dominican 2%
- Common ancestry
- Hispanic 7% Estonian 4% Russian 1%
- Foreign-born
- 31% · Canada, Jamaica, China
- Languages at home
- 62% English-only · Spanish 21% French/Haitian/Cajun 8% Other Indo-European 6%
Political lean MEDSL · Orange
- 2024 margin
- D (+13.6) · D 56.1% · R 42.5% · Other 1.3%
- 2008→2024 swing
- -5.0pp toward R · 2008: 18.6pp · 2024: 13.6pp
- All cycles
- 2024: D+13.6 2020: D+23.1 2016: D+24.6 2012: D+18.2 2008: D+18.6
Not yet ingested
- Civics
- —
Market trends
- HPI YoY
- ▼ -145.37%
- Current HPI
- 284.9191
- Rent YoY
- ▲ 0.15%
- Metro
- Orlando-Kissimmee-Sanford, FL
- State GDP YoY
- ▲ 3.28%
- F500 in state
- 36
Industry mix (Fortune 500 HQ in FL)
| Industry | F500 HQs | Revenue |
|---|---|---|
| Industrial Technology | 2 | $29B |
|
||
| Insurance | 2 | $17B |
|
||
| Retail | 1 | $60B |
|
||
| Technology Distribution | 1 | $58B |
|
||
| Homebuilding | 1 | $35B |
|
||
| Technology Manufacturing | 1 | $35B |
|
||
Price history
-17.1% since first listed4 events — show timeline
- 2026-05-08 Price Changed $165,000 Stellar MLS as Distributed by MLS Grid
- 2026-04-08 Price Changed $175,000 Stellar MLS as Distributed by MLS Grid
- 2026-01-20 Listed $185,000 Stellar MLS as Distributed by MLS Grid
- 2022-12-15 Sold (Public Records) $199,000 Public Records
Property tax history
+19.1%/yrLatest (2025): $3,109 · +0.7% YoY. Source: county tax records.
Cash-flow waterfall
monthlySold comps — $/sqft
last 12 mo · ≤1 miLoading sold comps…