 🏗️ New Construction
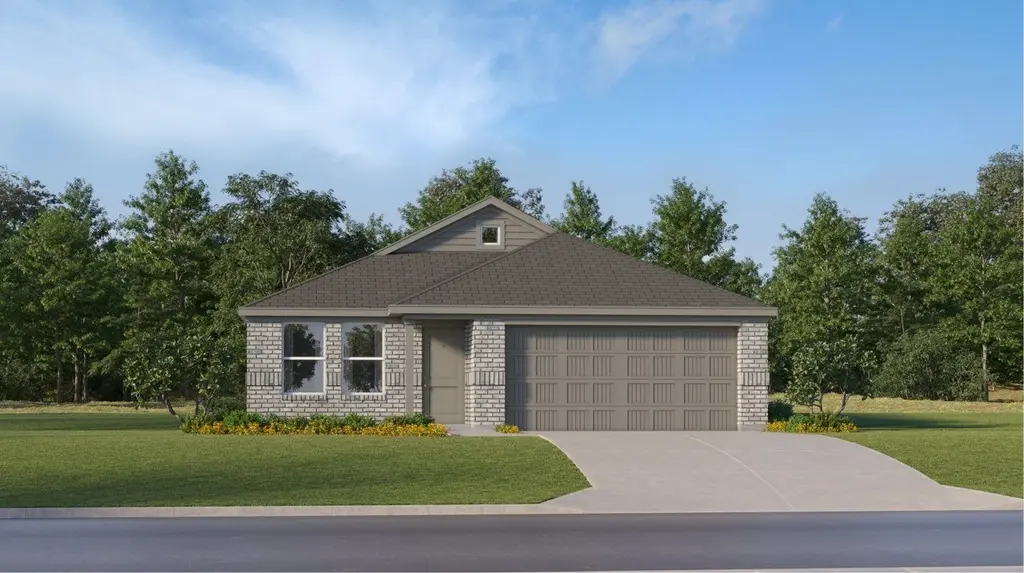
1825 Taggart Trl · Bryan, TX
Flood risk 1/10 · Minimal
- FEMA flood zone
- X (unshaded)
- Chance of flooding over 30 yrs
- 0.0%
- Est. flood insurance / yr
- $507 – $1,088
Fire risk 4/10 · Minor
- Est. fire insurance / yr
- $1,222 – $2,270
Heat risk 8/10 · Major
- Hot days now (above 110°F)
- 7 days/yr
- Hot days in 30 yrs
- 24 days/yr
Wind risk 8/10 · Major
- Chance of severe wind over 30 yrs
- 80.0%
Air-quality risk 1/10 · Minimal
- Unhealthy air days now
- 0 days/yr
- Unhealthy air days in 30 yrs
- 0 days/yr
Risk factors via First Street. Map © Google.
Why this score? — see what drove the D- grade
The composite is a weighted blend of 9 inputs, each scored 0–100. Each bar is that input's sub-score; the figure is the points it added to the 100-point composite (weight × sub-score).
- Cash flow +11.0/30.0
- ARV discount +7.5/15.0
- Condition / age +4.8/5.0
- Livability +3.8/5.0
- 1% rule +3.5/10.0
- DSCR +3.2/10.0
- Schools +2.6/10.0
- Rent growth +2.5/5.0
- Appreciation +0.0/10.0
$247,540
🖨 Deal sheet 📄 Offer letter ✓ Due diligence
Listing remarks MLS
This single-level home showcases a spacious open floorplan shared between the kitchen, dining area and family room for easy entertaining. An owner's suite enjoys a private location in a rear corner of the home, complemented by an en-suite bathroom and walk-in closet. There are two secondary bedrooms at the front of the home, which are comfortable spaces for household members and overnight guests.
Key facts
- Walk-in closet
- Open floorplan
- Secondary bedrooms
Tags
Property features AI
Finance
- HOA & community: Association with annual fee of $650; Association managed by BHHS Caliber Realty
Exterior
- Parking: Attached 2-car garage
- Utilities: Public water; Public sewer
- Home design: Residential property; Under construction (new construction); Slab foundation; Composition roof; Built in 2026
- Construction: Brick and cement siding
- Exterior features: Back yard fence; Association pool; Community trails
Interior
- Kitchen: Dishwasher; Electric oven; Electric range; Gas oven; Gas range
- Bedrooms: Primary bedroom on the first floor (13 x 14); Bedroom on the first floor (11 x 10); Bedroom on the first floor (10 x 11)
- Flooring: Carpet; Vinyl
- Bathrooms: 2 full bathrooms
- Heating & cooling: Central heating (electric and gas); Central air conditioning (electric and gas)
- Interior features: Breakfast bar; Kitchen and family room combo; Kitchen and dining combo; Separate shower; Tub/shower
- Laundry & utility: Washer hookup; Electric dryer hookup; Gas dryer hookup
Neighborhood map
What this means for you Summary
Snapshot
- This is a 3-bed/2.0-bath single-family listed at $248k. Condition is rated excellent.
Deal economics
- At list price, monthly cash flow is $-111 ($-1k/yr) — negative.
- To cash-flow at today's rent, offer at most $242k (2.1% below list).
- To meet the 1% rule (rent ≥ 1% of price), the offer needs to be $219k (11.6% below list).
- Recommended offer: $219k (11.6% below list) — sets the bar for 1% rule.
- Cap rate 5.8% vs local median 4.0% in Bryan — top-decile yield for the area; either an underpriced asset or a hidden risk that comps aren't pricing in. Stress-test before assuming the spread holds.
Location & tenants
- Location reads 76/100 on livability (#99 in TX, #3,341 nationally) — a middle-class / working-renter tenant base. Strengths: cost of living A+, housing A+, health & safety A+; Watch: crime C-, amenities C-, employment D+.
- Bryan ISD (urban): math 30% / reading 32% proficiency, ranked #608 of 826 in TX (top 74%) — families likely to look elsewhere, expect single-tenant / working-renter base with shorter leases; 68% free/reduced lunch — lower-income household profile, screen leases tightly.
- Zoned schools: Stephen F Austin (math 25% / reading 36%, grade F, #1,036 of 1,662 statewide, top 63%, 1,206 students, 76% FRL).
- Market conditions: 303 active listings in the ZIP; 6 comparable units currently listed for rent nearby; rentals at typical pace (median 21d on market — plan ~3-4 weeks tenant-placement turnaround); 2,211 units permitted in Brazos County in 2024 (768 in 5+ unit buildings).
- This rent runs 35% of the median local income ($74k/yr) — at the standard rent-burdened threshold; future hikes will face affordability resistance.
Forward outlook
- Local home prices are declining (-3.0%/yr); year-one equity from $2k of loan paydown is wiped out by about $8k of value loss. Plan a longer hold.
- Brazos County population projected at +55% by 2050 — long-run rental-demand tailwind backs the buy-and-hold thesis.
Negotiation context
- It's been on market 20 days — a 2% lower offer ($244k) is reasonable based on typical stale-listing flexibility.
- 2 sale attempts; this cycle's ask has dropped $15k (6%) from the opening price — seller is motivated, your offer sets the floor, not the list.
Risks & watch-outs
- Climate carrying-cost: severe wind risk, 80% chance of damaging wind over 30y; extreme-heat days projected 7→24/yr by 2055 (HVAC capex compounding) — expect insurance premiums to compound above CPI over the hold.
Questions for the listing agent
- What do current leases actually rent for vs. the listed asking? Can we see a recent rent roll and the last 12 months of T-12 income?
- What does the HOA fee cover, when was the last increase, and are there any pending special assessments or reserve-fund shortfalls?
- Is there a deadline driving the sale (1031 exchange, divorce, estate, relocation)? That informs how much negotiation room exists.
- The area grade is low — what's the realistic commute time and amenity access for the typical tenant pool here? Any planned neighborhood developments (good or bad) we should know about?
- What's the average days-on-market for RENTAL listings here right now (not sales)? A rising rental-DOM trend means longer vacancies and softer asking-rent achievability than the comps imply.
- What's the recent tenant-quality profile in this submarket — average credit score on applications, eviction rate, late-payment / NSF rate, and stable-employment percentage? A property-management company in the area should have these aggregated.
- How much new for-sale + rental construction is in the pipeline within 1–3 miles? Heavy new supply typically softens prices + rents 12–24 months out; constrained supply supports both.
Investment metrics
- 1% rule
- 0.85% ✗
- Cap rate
- 5.78%
- Cash-on-cash
- -1.83%
- DSCR
- 0.92
- GRM
- 9.8
CMA / ARV
- ARV (on-the-fly)
- $258,216
- Comps found
- 12
Show comp detail 12 sales within ~0.75 mi
| Address | Dist | Beds/Ba | Sqft | Sold | Price | $/sf | Match |
|---|---|---|---|---|---|---|---|
| 1819 Taggart Trl | 0.02mi | 3/2.0 | 1,484 (0%) | 0mo | $239,990 | $162 | 99 |
| 2210 Jeter Dr | 0.14mi | 3/2.0 | 1,484 (0%) | 1mo | $252,990 | $170 | 93 |
| 5419 Bear Run | 0.22mi | 3/2.0 | 1,501 (+1%) | 1mo | $273,490 | $182 | 87 |
| 2201 Jeter Dr | 0.31mi | 3/2.0 | 1,484 (0%) | 2mo | $244,990 | $165 | 84 |
| 5441 Bear Run | 0.36mi | 3/2.0 | 1,484 (0%) | 3mo | $215,090 | $145 | 81 |
| 5415 Bear Run | 0.23mi | 3/2.0 | 1,415 (-5%) | 2mo | $267,890 | $189 | 80 |
| 5417 Smith Lake Blvd | 0.28mi | 3/2.0 | 1,564 (+5%) | 1mo | $289,990 | $185 | 77 |
| 2206 Jeter Dr | 0.32mi | 3/2.0 | 1,564 (+5%) | 1mo | $252,990 | $162 | 75 |
| 2209 Jeter Dr | 0.31mi | 3/2.0 | 1,269 (-14%) | 2mo | $252,990 | $199 | 60 |
| 2226 Jeter Dr | 0.32mi | 4/2.0 (+1) | 1,665 (+12%) | 1mo | $293,490 | $176 | 59 |
| 2212 Jeter Dr | 0.32mi | 4/2.0 (+1) | 1,676 (+13%) | 1mo | $252,390 | $151 | 58 |
| 5222 Montague Loop | 0.65mi | 3/2.0 | 1,605 (+8%) | 3mo | $280,000 | $174 | 54 |
Match score weights: distance 35% · size 25% · config 20% · recency 20%. Top-matched comps best support the ARV.
Projected returns pro-forma
-3.0% appreciation · 3.0% rent growth · sell at horizon
- IRR
- -19.3%
- Equity multiple
- 0.32×
- Total profit
- $-48,816
- Equity at exit
- $38,501
- IRR
- -11.9%
- Equity multiple
- 0.29×
- Total profit
- $-51,304
- Equity at exit
- $22,326
Cash invested: $72,300 (down + closing). Projections, not guarantees.
Landlord ↔ Tenant lean methodology
- Overall (STATE)
- 87 Strongly Landlord-Friendly
- State Texas
- 87 Strongly Landlord-Friendly · R+5
- County
- — inherits STATE
- City
- — inherits STATE
ZIP-level market 77807
- Active inventory
- 303
- Price-to-rent
- 9.4×
Monthly cashflow live
- Estimated rent
- $2,187 high interval (Pro) →
- Mortgage (P&I)
- −$1,354
- Tax est. 1.5%
- −$323 /mo · $3,873/yr
- Insurance
- −$108
- HOA
- −$54
- Vacancy / Maint / Mgmt
- −$459
- Net cashflow
- $-111
Break-even live
UW: 25.0% down · 7.5% · 30yr · 1.5% tax · 5.0% vac · 8.0% maint · 8.0% mgmt
Financing live
Cash to close
- Down payment
- $64,554
- Closing costs
- $7,746
- Reserves months
- —
- Total cash needed
- —
Loan-product check · same deal, 3 products live
Conventional
25% down · 7.5% · 30yr
- Down + closing
- —
- Monthly P&I
- —
- Monthly cashflow
- —
- DSCR
- —
- Eligible?
- —
Personal DTI + credit; lowest rate.
DSCR
20% down · 8.5% · 30yr
- Down + closing
- —
- Monthly P&I
- —
- Monthly cashflow
- —
- DSCR
- —
- Eligible?
- —
No personal income docs; deal must DSCR.
Hard money
10% down · 12.0% · 12mo
- Down + closing
- —
- Monthly P&I
- —
- Monthly cashflow
- —
- DSCR
- —
- Eligible?
- —
Short-term bridge; refi at stabilization.
Rent comps 6 comps
| Address | Beds | Baths | Sqft | Rent | $/sqft | DOM | Units | Dist |
|---|---|---|---|---|---|---|---|---|
| 5433 Bear RUN Bryan, TX | 4.0 | 2.0 | 1745 | $2,195 | $1.26 | 43d | 1 | 0.35mi |
| 1971 Chief St Bryan, TX | 3.0 | 2.0 | 1517 | $2,100 | $1.38 | 21d | 1 | 0.40mi |
| 2010 Chief St Bryan, TX | 3.0 | 2.0 | 1603 | $2,250 | $1.40 | 43d | 1 | 0.48mi |
| 2148 Chief St Bryan, TX | 4.0 | 2.0 | 1568 | $2,000 | $1.28 | 13d | 1 | 0.49mi |
| 2119 Chief St Bryan, TX | 4.0 | 2.0 | 1568 | $2,400 | $1.53 | 13d | 1 | 0.64mi |
| 2111 Chief St Bryan, TX | 3.0 | 2.0 | 1370 | $2,150 | $1.57 | 13d | 1 | 0.67mi |
HOA detail
- Monthly dues
- $54 · $648/yr
Listing history 15 events
-
2026-06-13status $247,540 Pending 20 DOM
-
2026-06-10days on market $247,540 Active 20 DOM
-
2026-06-09days on market $247,540 Active 19 DOM
-
2026-06-09price $247,540 Active 18 DOM
-
2026-06-08days on market $251,440 Active 18 DOM
-
2026-06-07days on market $251,440 Active 17 DOM
-
2026-06-03days on market $251,440 Active 13 DOM
-
2026-06-02days on market $251,440 Active 12 DOM
-
2026-06-01days on market $251,440 Active 11 DOM
-
2026-05-31days on market $251,440 Active 10 DOM
-
2026-05-30days on market $251,440 Active 9 DOM
-
2026-05-22price $251,440
Show marketing remark (399 chars)
This single-level home showcases a spacious open floorplan shared between the kitchen, dining area and family room for easy entertaining. An owner's suite enjoys a private location in a rear corner of the home, complemented by an en-suite bathroom and walk-in closet. There are two secondary bedrooms at the front of the home, which are comfortable spaces for household members and overnight guests.
-
2026-05-22price $251,440 399-char remark
Show marketing remark (399 chars)
This single-level home showcases a spacious open floorplan shared between the kitchen, dining area and family room for easy entertaining. An owner's suite enjoys a private location in a rear corner of the home, complemented by an en-suite bathroom and walk-in closet. There are two secondary bedrooms at the front of the home, which are comfortable spaces for household members and overnight guests.
-
2026-05-21$262,990 Active 399-char remark
Show marketing remark (399 chars)
This single-level home showcases a spacious open floorplan shared between the kitchen, dining area and family room for easy entertaining. An owner's suite enjoys a private location in a rear corner of the home, complemented by an en-suite bathroom and walk-in closet. There are two secondary bedrooms at the front of the home, which are comfortable spaces for household members and overnight guests.
-
2026-05-21$262,990 Active
Show marketing remark (399 chars)
This single-level home showcases a spacious open floorplan shared between the kitchen, dining area and family room for easy entertaining. An owner's suite enjoys a private location in a rear corner of the home, complemented by an en-suite bathroom and walk-in closet. There are two secondary bedrooms at the front of the home, which are comfortable spaces for household members and overnight guests.
ⓘ Source: listings_history table (triggers on properties + properties_extension) + one-shot
backfill from property_details.listing_events for pre-trigger history.
Climate risk First Street
- Flood 1/10 Low FEMA zone X (unshaded) · 0% chance over 30 yrs
- Wildfire 4/10 Moderate
- Heat 8/10 Severe 7 d/yr ≥110°F today · 24 d/yr by 30 yrs out
- Wind 8/10 Severe 80% chance of damaging wind over 30 yrs
- Air quality 1/10 Low 0 unhealthy d/yr today · 0 by 30 yrs out
Nearby sold comps map
Loading sold comps map…
Walkable amenities ~0.75 mi
Loading nearby amenities…
Taxation est. · year 1
- Rental income
- $26,247
- − Mortgage interest
- −$14,464
- − Property taxes
- −$3,873
- − Insurance
- −$1,291
- − Repairs & maintenance
- −$2,100
- − Management
- −$2,100
- − HOA
- −$648
- − Depreciation
- −$7,512
- Taxable loss
- −$5,740
- Est. tax savings @ 24.0%
- +$1,378
- After-tax cash flow
- $51/yr
For passive investors: Depreciation is non-cash, so a rental often shows a tax loss while cash-flowing — sheltering income. Rental losses are passive: they offset passive income freely, and up to $25,000/yr can offset ordinary (W-2) income if you actively participate and your MAGI is under $100k (phasing out to $0 by $150k); unused losses carry forward. On sale, claimed depreciation is recaptured at up to 25%, and gains may owe capital-gains tax (a 1031 exchange can defer both). Figures are a year-1 estimate at your 24.0% rate — not tax advice; consult a CPA.
Condition & rehab AI · 18 photos
This single-level home showcases a spacious open floorplan with modern finishes and excellent condition. It is move-in ready and ready for minor updates to enhance its value.
Value-add opportunities
- Both Painting the exterior and interior walls — Fresh paint can enhance curb appeal and interior aesthetics
- Both Updating the kitchen backsplash — A new backsplash can add a modern touch and increase the home's value
- Both Upgrading the flooring in the bathrooms — Replacing old flooring with a more durable and stylish option can improve both resale and rental value
Renovation cost estimate screening
Value-add ROI direction
- Both Painting the exterior and interior walls — Fresh paint can enhance curb appeal and interior aesthetics ↑
- Both Updating the kitchen backsplash — A new backsplash can add a modern touch and increase the home's value ↑
- Both Upgrading the flooring in the bathrooms — Replacing old flooring with a more durable and stylish option can improve both resale and rental value ↑
ⓘ Cost ranges are severity-bucket heuristics (US national rule-of-thumb). Get contractor quotes + a written scope before underwriting a rehab budget.
Schools (NCES district)
- District
- Bryan ISD
- NCES district ID
- 4811790
- Math proficiency
- 30% ▼ -8.00%
- Reading proficiency
- 32% ▼ -3.00%
- Median HH income
- $41,895
- Composite
- 26.26/100
- National rank
- #7253
- State rank
- #608 of 826 in TX
Livability — Bryan
- Score
- 76/100
- State rank
- #99
- US rank
- #3341
Category grades
Schools grade is shown separately in the Schools card above.
Census & demographics
- Census place
- Bryan, TX
- County
- Brazos County · 233,400 people
- City population
- 101,772
- Metro
- College Station-Bryan, TX
- Population (ZIP)
- 13,227
- Household income
- $74,375
- Rent vs Own
- Severe rent burden
- 629.0
Population outlook (Brazos County) Hauer SSP2
- Today (2025)
- 267,942 people
- By 2030
- 296,630 · +10.7%
- By 2040
- 354,560 · +32.3%
- By 2050
- 414,616 · +54.7%
- By 2075
- 562,158 · +109.8%
- By 2100
- 678,828 · +153.3%
Race, ethnicity, and origin ACS 2023
- Neighborhood character
- Diverse neighborhood (Simpson 0.67)
- Race & ethnicity
- White 45% Hispanic / Latino 32% Two or more races 18% Black 14% Native American 3% Asian 2%
- Hispanic origin (detail)
- Mexican 29%
- Common ancestry
- Romanian 2% Lithuanian 2% Italian 2%
- Foreign-born
- 16% · Canada, Guatemala, Vietnam
- Languages at home
- 71% English-only · Spanish 24% Other Asian/Pacific 1% French/Haitian/Cajun 1%
Political lean MEDSL · Brazos
- 2024 margin
- Strong R (+24.9) · D 36.9% · R 61.7% · Other 1.4%
- 2008→2024 swing
- +4.1pp toward D · 2008: -28.9pp · 2024: -24.9pp
- All cycles
- 2024: R+24.9 2020: R+14.3 2016: R+23.7 2012: R+35.3 2008: R+28.9
Not yet ingested
- Civics
- —
Market trends
- HPI YoY
- ▼ -114.38%
- Current HPI
- 186.1387
- Rent YoY
- —
- Metro
- College Station-Bryan, TX
- State GDP YoY
- ▲ 3.95%
- F500 in state
- 110
Industry mix (Fortune 500 HQ in TX)
| Industry | F500 HQs | Revenue |
|---|---|---|
| Energy | 16 | $1,198B |
|
||
| Technology | 5 | $198B |
|
||
| Engineering / Construction | 4 | $72B |
|
||
| Energy Services | 3 | $60B |
|
||
| Utilities | 3 | $41B |
|
||
| Healthcare | 2 | $330B |
|
||
Price history
-4.4% since first listed4 events — show timeline
- 2026-05-22 Price Changed $251,440 HARMLS
- 2026-05-22 Price Changed $251,440 Zillow
- 2026-05-21 Listed $262,990 Zillow
- 2026-05-21 Listed $262,990 HARMLS
Cash-flow waterfall
monthlySold comps — $/sqft
last 12 mo · ≤1 miLoading sold comps…