 🔨 Auction
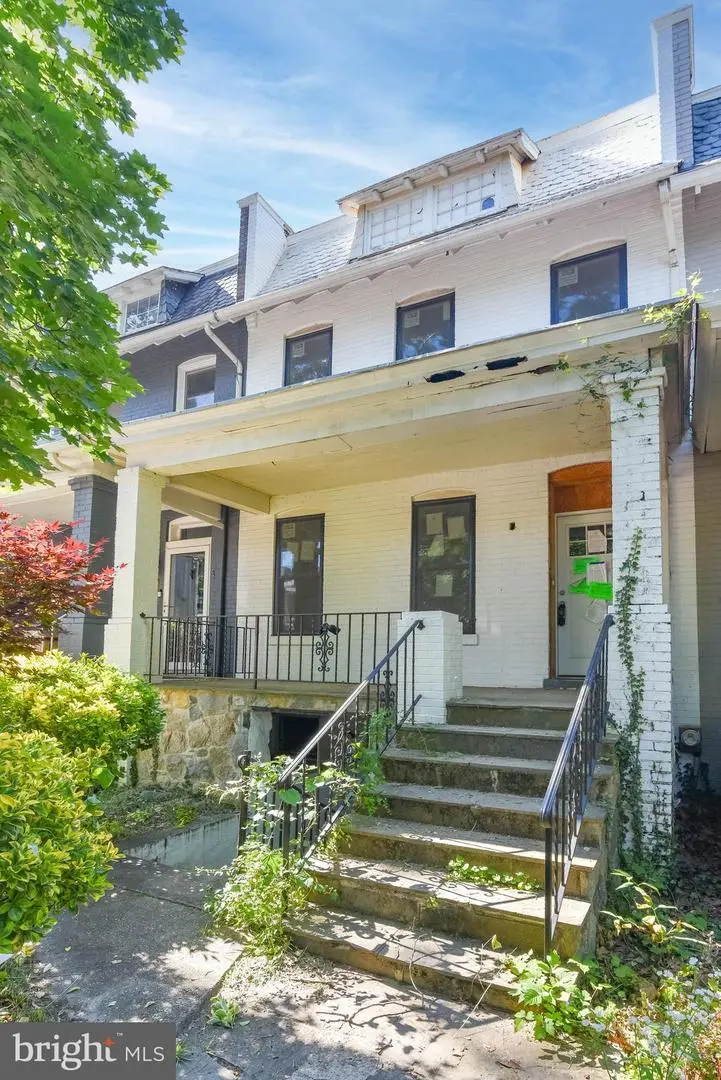
33 Franklin St NE · Washington, DC
Flood risk 1/10 · Minimal
- FEMA flood zone
- X (unshaded)
- Chance of flooding over 30 yrs
- 0.0%
- Est. flood insurance / yr
- $473 – $860
Fire risk 1/10 · Minimal
- Est. fire insurance / yr
- $631 – $1,173
Heat risk 7/10 · Major
- Hot days now (above 106°F)
- 7 days/yr
- Hot days in 30 yrs
- 15 days/yr
Wind risk 4/10 · Minor
- Chance of severe wind over 30 yrs
- 21.0%
Air-quality risk 4/10 · Minor
- Unhealthy air days now
- 4 days/yr
- Unhealthy air days in 30 yrs
- 5 days/yr
Risk factors via First Street. Map © Google.
Why this score? — see what drove the F grade
The composite is a weighted blend of 9 inputs, each scored 0–100. Each bar is that input's sub-score; the figure is the points it added to the 100-point composite (weight × sub-score).
- ARV discount +7.5/15.0
- Cash flow +4.1/30.0
- Livability +3.7/5.0
- Schools +3.6/10.0
- Rent growth +1.7/5.0
- Condition / age +1.0/5.0
- 1% rule +0.3/10.0
- DSCR +0.0/10.0
- Appreciation +0.0/10.0
$190,000
🖨 Deal sheet (PDF) 📄 Offer letter ✓ Due diligence
Listing remarks
List price to be opening bid at online only auction. Online auction to be conducted on Auctioneers website. Bidding begins Wednesday, July 9th & ends Tuesday, July 14th, 2026 at 12:00 PM. Exceptional renovation opportunity in the Brookland neighborhood. According to tax records this townhouse offers 2,260 +/- square feet of living space. The home is configured as 1,600 +/- square feet of above and 660 +/- square feet of below grade. According to tax records the home is situated on a 1,500 +/- square foot lot. This presents tremendous potential for investors, developers, or buyers looking to customize a home to their specifications. The property features a covered front porch and a uni
Key facts
- Covered front porch
- Unique layout
- Parking pad
Tags
Property features AI
Finance
- Other: Total below-grade area and breakdown of finished/unfinished space provided
- Financial info: Improvement assessed value listed; Land assessed value listed; Tax assessed value listed
Exterior
- Parking: Other parking
- Utilities: Public water; Public sewer
- Home design: Interior townhouse/rowhouse; Fee simple ownership
- Construction: Brick construction; Other foundation details; Other structures above and below grade; Year built per assessor
- Exterior features: No tidal water
Interior
- Bedrooms: Three bedrooms on the first upper level
- Bathrooms: One full bathroom (all upper levels)
- Heating & cooling: Other heating; Other cooling (electric and other cooling fuel); Other hot water
- Interior features: Unfinished basement; Living area per assessor
Neighborhood map
What this means for you Summary
Snapshot
- This is a 3-bed/1.0-bath townhouse listed at $190k. Condition is rated poor.
Deal economics
- At list price, monthly cash flow is $-2k ($-26k/yr) — negative.
- The deal already cash-flows at list — no discount required.
- Meets the 1% rule at list price ($4k rent vs $190k).
Location & tenants
- Location reads 73/100 on livability (#1 in DC) — a middle-class / working-renter tenant base. Strengths: amenities A+, commute A+, employment A+; Watch: crime F, cost of living F.
- District Of Columbia Public Schools (urban): math 33% / reading 40% proficiency, ranked #8 of 32 in DC (top 25%) — families likely to look elsewhere, expect single-tenant / working-renter base with shorter leases; 65% free/reduced lunch — lower-income household profile, screen leases tightly.
- Market conditions: Rents falling (-3.0%/yr); 558 active listings in the ZIP; 40 comparable units currently listed for rent nearby; rentals at typical pace (median 22d on market — plan ~3-4 weeks tenant-placement turnaround); high-income renter base; 1,737 units permitted in District of Columbia in 2024 (1,506 in 5+ unit buildings).
- This rent runs 42% of the median local income ($120k/yr) — at the standard rent-burdened threshold; future hikes will face affordability resistance.
Forward outlook
- Local home prices are declining (-3.0%/yr); year-one equity from $6k of loan paydown is wiped out by about $24k of value loss. Plan a longer hold.
- District of Columbia County population projected at +50% by 2050 — long-run rental-demand tailwind backs the buy-and-hold thesis.
Negotiation context
- Only 13 days on market — expect competitive offers; lowballing is unlikely to land.
Risks & watch-outs
- Watch-outs: property tax is 6.4% of price; built in 1919 — expect roof / HVAC / electrical / plumbing capex.
- Climate carrying-cost: extreme-heat days projected 7→15/yr by 2055 (HVAC capex compounding) — expect insurance premiums to compound above CPI over the hold.
Questions for the listing agent
- What do current leases actually rent for vs. the listed asking? Can we see a recent rent roll and the last 12 months of T-12 income?
- Have any recent inspections been done? Can we get a copy of the seller's disclosures and any deferred-maintenance estimates?
- Built in 1919 — when were the roof, HVAC, electrical panel, plumbing, and water heater last replaced?
- Property tax is high relative to price — has the assessment been appealed recently, and will the sale trigger a re-assessment?
- Is there a deadline driving the sale (1031 exchange, divorce, estate, relocation)? That informs how much negotiation room exists.
- Crime grade is F in this area — have there been break-ins, vandalism, or insurance claims at this property in the last 3 years? What carrier currently insures it and at what premium?
- The area grade is low — what's the realistic commute time and amenity access for the typical tenant pool here? Any planned neighborhood developments (good or bad) we should know about?
- What's the average days-on-market for RENTAL listings here right now (not sales)? A rising rental-DOM trend means longer vacancies and softer asking-rent achievability than the comps imply.
- What's the recent tenant-quality profile in this submarket — average credit score on applications, eviction rate, late-payment / NSF rate, and stable-employment percentage? A property-management company in the area should have these aggregated.
- How much new for-sale + rental construction is in the pipeline within 1–3 miles? Heavy new supply typically softens prices + rents 12–24 months out; constrained supply supports both.
Investment metrics
- 1% rule
- 0.53% ✗
- Cap rate
- 3.01%
- Cash-on-cash
- -11.73%
- DSCR
- 0.48
- GRM
- 15.8
CMA / ARV
- ARV (on-the-fly)
- $804,840
- Comps found
- 12
Show comp detail 12 sales within ~0.75 mi
| Address | Dist | Beds/Ba | Sqft | Sold | Price | $/sf | Match |
|---|---|---|---|---|---|---|---|
| 206 Cromwell Ter NE | 0.28mi | 4/2.0 (+1) | 1,770 (+0%) | 0mo | $450,000 | $254 | 77 |
| 209 Cromwell Ter NE | 0.30mi | 4/3.5 (+1) | 1,770 (+0%) | 1mo | $790,000 | $446 | 70 |
| 223 Ascot Pl NE | 0.41mi | 3/3.5 | 1,710 (-3%) | 1mo | $430,000 | $251 | 65 |
| 70 Adams St NW | 0.40mi | 3/2.0 | 1,560 (-12%) | 0mo | $710,000 | $455 | 58 |
| 41 V St NW | 0.49mi | 4/3.0 (+1) | 1,690 (-4%) | 1mo | $1,200,000 | $710 | 56 |
| 3032 Park Pl NW | 0.64mi | 3/2.0 | 1,667 (-6%) | 1mo | $610,000 | $366 | 56 |
| 586 Regent Pl NE | 0.59mi | 3/2.5 | 1,604 (-9%) | 1mo | $760,000 | $474 | 50 |
| 312 Bryant St NE | 0.43mi | 3/3.5 | 1,542 (-13%) | 1mo | $745,000 | $483 | 49 |
| 156 Todd Pl NE | 0.62mi | 3/3.0 | 1,620 (-8%) | 1mo | $833,221 | $514 | 48 |
| 3328 7th St NE | 0.73mi | 3/3.5 | 1,848 (+5%) | 0mo | $895,000 | $484 | 48 |
| 3117 Warder St NW | 0.72mi | 3/2.5 | 2,020 (+14%) | 0mo | $899,000 | $445 | 36 |
| 317 Todd Pl NE | 0.71mi | 4/3.5 (+1) | 2,008 (+14%) | 1mo | $915,000 | $456 | 28 |
Match score weights: distance 35% · size 25% · config 20% · recency 20%. Top-matched comps best support the ARV.
Projected returns pro-forma
-3.0% appreciation · 0.0% rent growth · sell at horizon
- IRR
- -41.1%
- Equity multiple
- -0.26×
- Total profit
- $-283,108
- Equity at exit
- $120,004
- IRR
- -89.4%
- Equity multiple
- -1.11×
- Total profit
- $-475,074
- Equity at exit
- $69,588
Cash invested: $225,355 (down + closing). Projections, not guarantees.
Landlord ↔ Tenant lean methodology
- Overall (CITY)
- 0 Strongly Tenant-Friendly
- State District of Columbia
- 12 Strongly Tenant-Friendly · D+43
- County
- — inherits STATE
- City Washington
- 0 Strongly Tenant-Friendly · D+43
ZIP-level market 20002
- Rents YoY
- -3.0%
- Active inventory
- 558
- Price-to-rent
- 3.7×
Monthly cashflow live
- Estimated rent
- $4,252 high interval (Pro) →
- Mortgage (P&I)
- −$4,221
- Tax est. 1.5%
- −$1,006 /mo · $12,073/yr
- Insurance
- −$335
- HOA
- −$0
- Vacancy / Maint / Mgmt
- −$893
- Net cashflow
- $-2,203
Break-even live
Sensitivity live
| Price | -10% $-1,647 | -5% $-1,925 | +0% $-2,203 | +5% $-2,481 | +10% $-2,759 |
|---|---|---|---|---|---|
| Rent | -10% $-2,539 | -5% $-2,371 | +0% $-2,203 | +5% $-2,035 | +10% $-1,867 |
| Rate | -1.0pp $-1,797 | -0.5pp $-1,998 | base $-2,203 | +0.5pp $-2,411 | +1.0pp $-2,623 |
UW: 25.0% down · 7.5% · 30yr · 1.5% tax · 5.0% vac · 8.0% maint · 8.0% mgmt
Financing live
Cash to close
- Down payment
- $201,210
- Closing costs
- $24,145
- Reserves months
- —
- Total cash needed
- —
Loan-product check · same deal, 3 products live
Conventional
25% down · 7.5% · 30yr
- Down + closing
- —
- Monthly P&I
- —
- Monthly cashflow
- —
- DSCR
- —
- Eligible?
- —
Personal DTI + credit; lowest rate.
DSCR
20% down · 8.5% · 30yr
- Down + closing
- —
- Monthly P&I
- —
- Monthly cashflow
- —
- DSCR
- —
- Eligible?
- —
No personal income docs; deal must DSCR.
Hard money
10% down · 12.0% · 12mo
- Down + closing
- —
- Monthly P&I
- —
- Monthly cashflow
- —
- DSCR
- —
- Eligible?
- —
Short-term bridge; refi at stabilization.
Rent comps 40 comps
| Address | Beds | Baths | Sqft | Rent | $/sqft | DOM | Units | Dist |
|---|---|---|---|---|---|---|---|---|
| 33 Lower Service Ct NW Washington, DC | 4.0 | 4.5 | 2250 | $7,950 | $3.53 | 19d | 1 | 0.17mi |
| 2419 N Capitol St NE Washington, DC | 3.0 | 2.0 | 1763 | $4,200 | $2.38 | 25d | 1 | 0.21mi |
| 138 Bryant St NW Washington, DC | 4.0 | 2.0 | 1809 | $3,750 | $2.07 | 21d | 1 | 0.41mi |
| 2309 3rd St NE Washington, DC | 3.0 | 2.0 | 1390 | $3,250 | $2.34 | 25d | 1 | 0.45mi |
| 1 V St NW Washington, DC | 4.0 | 3.0 | 1800 | $4,900 | $2.72 | 13d | 1 | 0.47mi |
| 341 Bryant St NE Washington, DC | 3.0 | 2.5 | 1400 | $4,750 | $3.39 | 5d | 1 | 0.47mi |
| 58 V St NW Unit A Washington, DC | 3.0 | 2.5 | 2150 | $5,200 | $2.42 | 20d | 1 | 0.51mi |
| 159 V St NE Washington, DC | 3.0 | 3.5 | 1620 | $3,900 | $2.41 | 25d | 1 | 0.52mi |
| 117 V St NW Unit 1 Washington, DC | 3.0 | 1.5 | 1800 | $3,695 | $2.05 | 25d | 1 | 0.53mi |
| 45 Rhode Island Ave NE Unit 1388279P Washington, DC | 2.0–6.0 | 2.0–6.0 | 10371 | $7,399 | $0.71 | 8d | 2 | 0.54mi |
| 17 U St NW Unit A Washington, DC | 4.0 | 3.5 | 2388 | $6,000 | $2.51 | 25d | 1 | 0.55mi |
| 39 U St NE Washington, DC | 3.0 | 4.0 | 1550 | $4,695 | $3.03 | 19d | 1 | 0.57mi |
| 39 U St NE #1 Washington, DC | 3.0 | 3.5 | 1481 | $4,695 | $3.17 | 25d | 1 | 0.57mi |
| 32 U St NW Washington, DC | 4.0 | 4.0 | 1400 | $5,950 | $4.25 | 5d | 1 | 0.57mi |
| 2129 4th St NE Washington, DC | 4.0 | 3.5 | 2052 | $4,400 | $2.14 | 25d | 1 | 0.59mi |
| 632 Franklin St NE Washington, DC | 4.0 | 2.0 | 1338 | $3,300 | $2.47 | 21d | 1 | 0.60mi |
| 2104 4th St NE #1 Washington, DC | 4.0 | 3.5 | 2165 | $6,150 | $2.84 | 25d | 1 | 0.60mi |
| 35 Todd Pl NE #2 Washington, DC | 2.0 | 2.0 | 1323 | $3,200 | $2.42 | 25d | 1 | 0.61mi |
| 1917 Lincoln Rd NE Washington, DC | 3.0 | 3.0 | 2200 | $4,500 | $2.05 | 25d | 1 | 0.62mi |
| 237 Elm St NW Washington, DC | 3.0 | 1.5 | 1484 | $3,100 | $2.09 | 25d | 1 | 0.65mi |
| 1944 3rd St NW Washington, DC | 3.0 | 2.5 | 2124 | $4,195 | $1.98 | 25d | 1 | 0.69mi |
| 15 Seaton Pl NW #1 Washington, DC | 3.0 | 2.5 | 2539 | $3,700 | $1.46 | 25d | 1 | 0.70mi |
| 517 Columbia Rd NW Washington, DC | 4.0 | 2.5 | 1350 | $4,950 | $3.67 | 19d | 1 | 0.70mi |
| 1814 N Capitol St NW Unit 104 Washington, DC | 3.0 | 2.0 | 1500 | $4,100 | $2.73 | 25d | 1 | 0.72mi |
| 616 Todd Pl NE Unit 1 Washington, DC | 2.0 | 1.0 | 1798 | $1,800 | $1.00 | 8d | 1 | 0.72mi |
| 13 S St NE Unit A Washington, DC | 3.0 | 3.5 | 2200 | $3,800 | $1.73 | 23d | 1 | 0.77mi |
| 13 S St NE Unit A Washington, DC | 3.0 | 3.5 | 2200 | $3,800 | $1.73 | 25d | 1 | 0.77mi |
| 636 Columbia Rd NW Washington, DC | 4.0 | 2.5 | 2070 | $4,900 | $2.37 | 16d | 1 | 0.78mi |
| 1910 4th St NW Washington, DC | 2.0 | 2.5 | 1700 | $4,200 | $2.47 | 19d | 1 | 0.79mi |
| 33 Randolph Pl NW Washington, DC | 2.0 | 2.5 | 2214 | $3,500 | $1.58 | 11d | 1 | 0.80mi |
| 2720 10th St NE Washington, DC | 3.0 | 1.5 | 1400 | $1,580 | $1.13 | 8d | 1 | 0.83mi |
| 2726 10th St NE Washington, DC | 3.0 | 2.5 | 1400 | $4,000 | $2.86 | 25d | 1 | 0.83mi |
| 226 Rhode Island Ave NW Washington, DC | 3.0 | 2.5 | 2298 | $4,295 | $1.87 | 3d | 1 | 0.83mi |
| 232 Rhode Island Ave NW Washington, DC | 3.0 | 2.5 | 2019 | $3,950 | $1.96 | 8d | 1 | 0.83mi |
| 145 Randolph Pl NW Unit B Washington, DC | 2.0 | 1.0 | 2455 | $1,950 | $0.79 | 25d | 1 | 0.84mi |
| 104 R St NE Washington, DC | 3.0 | 2.5 | 1325 | $4,395 | $3.32 | 25d | 1 | 0.85mi |
| 19 R St NW Unit A Washington, DC | 3.0 | 3.0 | 1908 | $3,900 | $2.04 | 6d | 1 | 0.85mi |
| 527 U St NW #689 Washington, DC | 2.0 | 2.5 | 1320 | $2,830 | $2.14 | 8d | 1 | 0.86mi |
| 1712 1st St NW Unit A Washington, DC | 2.0 | 2.5 | 1910 | $4,100 | $2.15 | 13d | 1 | 0.86mi |
| 45 R St NE Washington, DC | 3.0 | 2.0 | 1656 | $4,000 | $2.42 | 8d | 1 | 0.87mi |
Listing history 8 events
-
2026-06-21days on market $190,000 Active 13 DOM
-
2026-06-18days on market $190,000 Active 10 DOM
-
2026-06-17days on market $190,000 Active 9 DOM
-
2026-06-16days on market $190,000 Active 8 DOM
-
2026-06-15days on market $190,000 Active 7 DOM
-
2026-06-13days on market $190,000 Active 5 DOM
-
2026-06-08remarks 695-char remark
-
2026-06-08$190,000 Active 1 DOM
ⓘ Source: listings_history table (triggers on properties + properties_extension) + one-shot
backfill from property_details.listing_events for pre-trigger history.
Climate risk First Street
- Flood 1/10 Low FEMA zone X (unshaded) · 0% chance over 30 yrs
- Wildfire 1/10 Low
- Heat 7/10 Severe 7 d/yr ≥106°F today · 15 d/yr by 30 yrs out
- Wind 4/10 Moderate 21% chance of damaging wind over 30 yrs
- Air quality 4/10 Moderate 4 unhealthy d/yr today · 5 by 30 yrs out
Nearby sold comps map
Loading sold comps map…
Walkable amenities ~0.75 mi
Loading nearby amenities…
Taxation est. · year 1
- Rental income
- $51,028
- − Mortgage interest
- −$45,084
- − Property taxes
- −$12,073
- − Insurance
- −$4,024
- − Repairs & maintenance
- −$4,082
- − Management
- −$4,082
- − Depreciation
- −$23,414
- Taxable loss
- −$41,730
- Est. tax savings @ 24.0%
- +$10,015
- After-tax cash flow
- $-16,417/yr
For passive investors: Depreciation is non-cash, so a rental often shows a tax loss while cash-flowing — sheltering income. Rental losses are passive: they offset passive income freely, and up to $25,000/yr can offset ordinary (W-2) income if you actively participate and your MAGI is under $100k (phasing out to $0 by $150k); unused losses carry forward. On sale, claimed depreciation is recaptured at up to 25%, and gains may owe capital-gains tax (a 1031 exchange can defer both). Figures are a year-1 estimate at your 24.0% rate — not tax advice; consult a CPA.
Condition & rehab AI · 13 photos
This property requires extensive repairs and improvements to its exterior and interior, including major repairs to the siding, roof, and flooring, as well as significant landscaping and interior updates. The property is currently in poor condition and presents a significant opportunity for investment and renovation.
Repairs flagged
- Major Exterior siding — The siding is visibly weathered and peeling, indicating significant damage and the need for replacement.
- Major Roof — The roof appears to be in fair condition but may require inspection for leaks or damage, which could be a major issue.
- Major Landscaping — The landscaping is overgrown and unkempt, with debris and debris on the ground, indicating a need for significant maintenance and landscaping improvements.
- Major Flooring — The flooring is in poor condition, with visible damage and wear, indicating a need for replacement or repair.
- Major Interior walls and ceilings — The walls and ceilings show signs of water damage and peeling paint, indicating a need for significant repairs and repainting.
Value-add opportunities
- Both Landscaping and exterior improvements — Landscaping and exterior improvements can enhance curb appeal and increase both resale and rental value.
- Both Interior repairs and updates — Interior repairs and updates can improve the living conditions and increase the home's value for both resale and rental.
Renovation cost estimate screening
| Repair item | Severity | Est. cost |
|---|---|---|
| Exterior siding · The siding is visibly weathered and peeling, indicating significant damage and the need for replacement. | Major | $15,000–50,000 |
| Roof · The roof appears to be in fair condition but may require inspection for leaks or damage, which could be a major issue. | Major | $15,000–50,000 |
| Landscaping · The landscaping is overgrown and unkempt, with debris and debris on the ground, indicating a need for significant maintenance and landscaping improvements. | Major | $15,000–50,000 |
| Flooring · The flooring is in poor condition, with visible damage and wear, indicating a need for replacement or repair. | Major | $15,000–50,000 |
| Interior walls and ceilings · The walls and ceilings show signs of water damage and peeling paint, indicating a need for significant repairs and repainting. | Major | $15,000–50,000 |
| Total estimated repair cost · 5 items | $75,000–250,000 |
Value-add ROI direction
- Both Landscaping and exterior improvements — Landscaping and exterior improvements can enhance curb appeal and increase both resale and rental value. ↑
- Both Interior repairs and updates — Interior repairs and updates can improve the living conditions and increase the home's value for both resale and rental. ↑
ⓘ Cost ranges are severity-bucket heuristics (US national rule-of-thumb). Get contractor quotes + a written scope before underwriting a rehab budget.
Schools (NCES district)
- District
- District Of Columbia Public Schools
- NCES district ID
- 1100030
- Math proficiency
- 33% ▲ 3.00%
- Reading proficiency
- 40% ▲ 5.00%
- Median HH income
- $67,671
- Composite
- 35.84/100
- National rank
- #9606
- State rank
- #8 of 32 in DC
Livability — Washington
- Score
- 73/100
- State rank
- #1
- US rank
- #5327
Category grades
Schools grade is shown separately in the Schools card above.
Census & demographics
- Census place
- Washington, DC
- County
- District of Columbia · 671,873 people
- City population
- 671,873
- Metro
- Washington-Arlington-Alexandria, DC-VA-MD-WV
- Population (ZIP)
- 72,397
- Household income
- $120,337
- Rent vs Own
- Severe rent burden
- 3854.0
Population outlook (District of Columbia County) Hauer SSP2
- Today (2025)
- 821,926 people
- By 2030
- 899,517 · +9.4%
- By 2040
- 1,061,162 · +29.1%
- By 2050
- 1,231,493 · +49.8%
- By 2075
- 1,603,312 · +95.1%
- By 2100
- 1,847,141 · +124.7%
Race, ethnicity, and origin ACS 2023
- Neighborhood character
- Diverse neighborhood (Simpson 0.66)
- Race & ethnicity
- White 41% Black 40% Two or more races 9% Hispanic / Latino 9% Asian 3%
- Hispanic origin (detail)
- Mexican 2%
- Common ancestry
- Romanian 3% Lithuanian 2% Italian 2%
- Foreign-born
- 9% · Canada, China, South Korea
- Languages at home
- 87% English-only · Spanish 5% French/Haitian/Cajun 2% Other Indo-European 1%
Political lean MEDSL · District of Columbia
- 2024 margin
- Solid D (+86.1) · D 91.2% · R 5.1% · Other 3.8%
- 2008→2024 swing
- +0.1pp no change · 2008: 85.9pp · 2024: 86.1pp
- All cycles
- 2024: D+86.1 2020: D+86.8 2016: D+88.7 2012: D+84.2 2008: D+85.9
Not yet ingested
- Civics
- —
Market trends
- HPI YoY
- ▼ -852.61%
- Current HPI
- 396.6033
- Rent YoY
- ▼ -3.04%
- Metro
- Washington-Arlington-Alexandria, DC-VA-MD-WV
- State GDP YoY
- ▲ 1.33%
- F500 in state
- 6
Industry mix (Fortune 500 HQ in DC)
| Industry | F500 HQs | Revenue |
|---|---|---|
| Financial Services | 1 | $153B |
|
||
| Life Sciences / Industrials | 1 | $25B |
|
||
| Industrial Machinery | 1 | $8B |
|
||
Price history
1 event — show timeline
- 2026-06-08 Listed $190,000 BRIGHT MLS
Cash-flow waterfall
monthlySold comps — $/sqft
last 12 mo · ≤1 miLoading sold comps…