 Multi-family
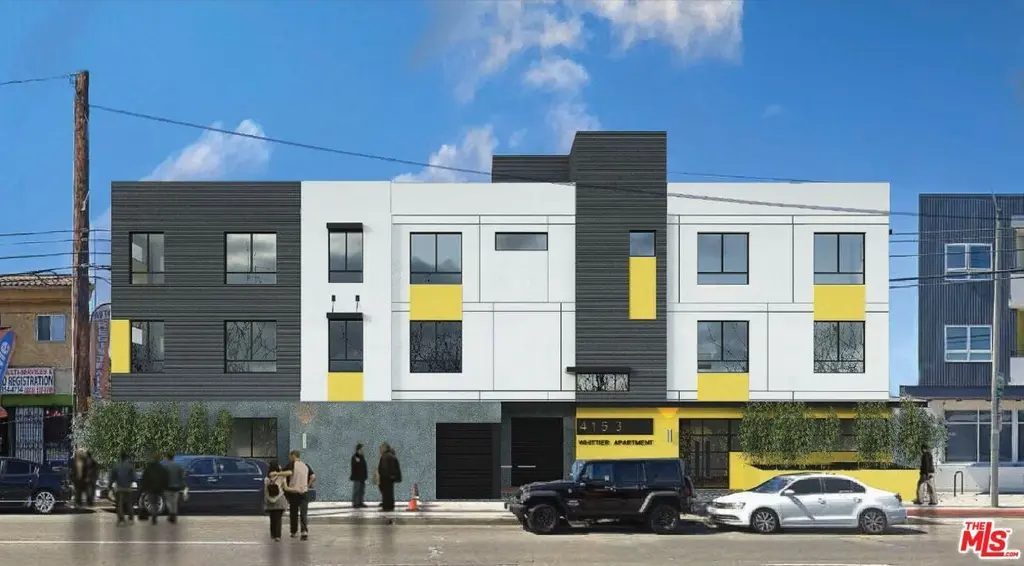
4153 Whittier Blvd · East Los Angeles, CA
Flood risk No data
- FEMA flood zone
- —
- Chance of flooding over 30 yrs
- —
- Est. flood insurance / yr
- —
Fire risk No data
- Est. fire insurance / yr
- —
Heat risk No data
- Hot days now (above threshold)
- —
- Hot days in 30 yrs
- —
Wind risk No data
- Chance of severe wind over 30 yrs
- —
Air-quality risk No data
- Unhealthy air days now
- —
- Unhealthy air days in 30 yrs
- —
Risk factors via First Street. Map © Google.
Why this score? — see what drove the D grade
The composite is a weighted blend of 9 inputs, each scored 0–100. Each bar is that input's sub-score; the figure is the points it added to the 100-point composite (weight × sub-score).
- Cash flow +15.0/30.0
- ARV discount +7.5/15.0
- 1% rule +5.0/10.0
- DSCR +5.0/10.0
- Schools +3.6/10.0
- Livability +3.0/5.0
- Rent growth +2.6/5.0
- Condition / age +2.5/5.0
- Appreciation +0.0/10.0
$1,600,000
🖨 Deal sheet 📄 Offer letter ✓ Due diligence
Multi-family units
County records classify this as Multi-Family (2-4 Unit). Listing-text estimate: 1 unit. estimate disagrees with records
Listing remarks MLS
We are proud to exclusively present 4153 Whittier Blvd, Los Angeles, California rare shovel-ready multifamily development opportunity in a strong infill East Los Angeles location. The property consists of an approximately 15,000 SF lot (0.344 acres) and is approved for a 51-unit, 3-story apartment development totaling approximately 29,130 gross building square feet. With the existing improvements already demolished and substantial predevelopment work completed, the site offers a meaningful advantage for a developer seeking to move efficiently into the next phase of construction. The approved project is situated on approximately 0.3444 net acres and includes a unit mix of 4 studios, 42 one-bedroom units, and 5 two-bedroom units within a 3-story building. The plans provide for 17 affordable units across multiple affordability levels, including units at 30%, 50%, 80%, and 120% AMI, while the balance of the project consists of 34 market-rate apartments. The approval also includes a density bonus structure that supports the 51-unit design, along with a waiver for a reduced front yard setback. Additional project highlights include no parking, 26 long-term bicycle spaces, 6 short-term bicycle spaces, a proposed height of approximately 41 feet, and County clearances from Public Health, Fire, and Public Works Land Development. This is an excellent opportunity for a developer to acquire a site where demolition has already been completed and substantial entitlement and permit work has already been secured, significantly reducing lead time and entitlement risk. Positioned just 0.03 miles from public transportation, 4153 Whittier Blvd offers the attributes today's urban multifamily developers seek: scale, transit accessibility, completed demolition, and meaningful entitlement progress. With site work already advanced and core development parameters established, this is an opportunity to acquire a Los Angeles infill project with reduced lead time, lower entitlement risk, and a clear path toward construction.
Key facts
- 17 affordable units
- 0.34 acre lot
- Listed 65 days
Tags
Neighborhood map
What this means for you Summary
Snapshot
- This is a 1-bed/1.0-bath multifamily listed at $1.60M.
Deal economics
- At list price, monthly cash flow is $71k ($853k/yr) — positive.
- The deal already cash-flows at list — no discount required.
- Meets the 1% rule at list price ($102k rent vs $1.60M).
- Recommended offer: $1.50M (6.0% below list) — sets the bar for market timing.
- Cap rate 59.6% vs local median 3.7% in East Los Angeles — top-decile yield for the area; either an underpriced asset or a hidden risk that comps aren't pricing in. Stress-test before assuming the spread holds.
Location & tenants
- Location reads 60/100 on livability (#594 in CA) — a middle-class / working-renter tenant base. Strengths: commute A+, schools B+; Watch: employment C-, health & safety D, crime F.
- Los Angeles Unified (urban): math 29% / reading 54% proficiency, ranked #223 of 517 in CA (top 43%) — families likely to look elsewhere, expect single-tenant / working-renter base with shorter leases; 67% free/reduced lunch — lower-income household profile, screen leases tightly.
- Market conditions: Rents flat; 57 active listings in the ZIP; 6 comparable units currently listed for rent nearby; rentals leasing fast (median 14d on market — plan ~1-2 weeks tenant-placement turnaround); 19,697 units permitted in Los Angeles County in 2024 (9,426 in 5+ unit buildings).
- At $102,077/mo this rent would consume 2074% of the median local household income ($59k/yr) (locally 2670% of renters already pay >50% of income on rent) — very limited rent-growth headroom before tenants either downsize or default.
Forward outlook
- Local home prices are declining (-3.0%/yr); year-one equity from $11k of loan paydown is wiped out by about $48k of value loss. Plan a longer hold.
- Los Angeles County population projected at +9% by 2050 — modest demand growth; plan on rents tracking national, not racing it.
- At projected returns (-3.0% appreciation + 0.2% rent growth), your $448k cash investment doubles in ~1 year — after that, you're playing with house money.
Negotiation context
- It's been on market 66 days — a 6% lower offer ($1.50M) is reasonable based on typical stale-listing flexibility.
Risks & watch-outs
- Watch-outs: built in 1911 — expect roof / HVAC / electrical / plumbing capex.
Questions for the listing agent
- It's been on market 66 days. Have you received any prior offers? Is the seller open to a 6% concession, seller financing, or rate buy-down credit?
- Built in 1911 — when were the roof, HVAC, electrical panel, plumbing, and water heater last replaced?
- Why hasn't it sold? Are there any deal-killer items the seller is aware of (foundation, flood, title, zoning, code violations)?
- Is there a deadline driving the sale (1031 exchange, divorce, estate, relocation)? That informs how much negotiation room exists.
- Schools are B-rated — typically a magnet for longer-tenancy family renters. What's the average tenant stay here, and is there a school-zone premium baked into asking?
- Crime grade is F in this area — have there been break-ins, vandalism, or insurance claims at this property in the last 3 years? What carrier currently insures it and at what premium?
- The area grade is low — what's the realistic commute time and amenity access for the typical tenant pool here? Any planned neighborhood developments (good or bad) we should know about?
- What's the average days-on-market for RENTAL listings here right now (not sales)? A rising rental-DOM trend means longer vacancies and softer asking-rent achievability than the comps imply.
- What's the recent tenant-quality profile in this submarket — average credit score on applications, eviction rate, late-payment / NSF rate, and stable-employment percentage? A property-management company in the area should have these aggregated.
- How much new apartment / multifamily construction is in the pipeline within 1–3 miles? Heavy new supply (>2% of stock underway) typically softens rents 12–24 months out; light construction supports rent growth.
Investment metrics
- 1% rule
- 6.38% ✓
- Cap rate
- 59.60%
- Cash-on-cash
- 190.38%
- DSCR
- 9.47
- GRM
- 1.3
CMA / ARV
- ARV (median comp)
- $1,447,504,014
- List price
- $1,600,000
- Delta
- -99.89%
- Verdict
- UNDERPRICED
- Comps
- 1 within 2.0 mi
Show comp detail 1 sale within ~0.75 mi
| Address | Dist | Beds/Ba | Sqft | Sold | Price | $/sf | Match |
|---|---|---|---|---|---|---|---|
| 1156 S Alma Ave | 0.67mi | 2/3.0 (+1) | 1,224 (-13%) | 9mo | $400,000 | $327 | 26 |
Match score weights: distance 35% · size 25% · config 20% · recency 20%. Top-matched comps best support the ARV.
Projected returns pro-forma
-3.0% appreciation · 0.21% rent growth · sell at horizon
- IRR
- —
- Equity multiple
- 9.90×
- Total profit
- $3,989,294
- Equity at exit
- $238,565
- IRR
- —
- Equity multiple
- 19.36×
- Total profit
- $8,223,361
- Equity at exit
- $138,339
Cash invested: $448,000 (down + closing). Projections, not guarantees.
Landlord ↔ Tenant lean methodology
- Overall (STATE)
- 18 Strongly Tenant-Friendly
- State California
- 18 Strongly Tenant-Friendly · D+13
- County
- — inherits STATE
- City
- — inherits STATE
ZIP-level market 90023
- Rents YoY
- 0.2%
- Active inventory
- 57
- Price-to-rent
- 40.4×
Monthly cashflow live
- Estimated rent
- $102,077 high interval (Pro) →
- Mortgage (P&I)
- −$8,391
- Tax from tax record
- −$510 /mo · $6,119/yr
- Insurance
- −$667
- HOA
- −$0
- Vacancy / Maint / Mgmt
- −$21,436
- Net cashflow
- $71,074
Break-even live
46-unit breakdown (identical units grouped — click to expand)
| Units | Beds | Baths | Est. rent |
|---|---|---|---|
| 4× units | 4 | 1 | $13,192 |
| #1 | 4 | 1 | $3,298 |
| #2 | 4 | 1 | $3,298 |
| #3 | 4 | 1 | $3,298 |
| #4 | 4 | 1 | $3,298 |
| 42× units | 1 | 1 | $88,872 |
| #5 | 1 | 1 | $2,116 |
| #6 | 1 | 1 | $2,116 |
| #7 | 1 | 1 | $2,116 |
| #8 | 1 | 1 | $2,116 |
| #9 | 1 | 1 | $2,116 |
| #10 | 1 | 1 | $2,116 |
| #11 | 1 | 1 | $2,116 |
| #12 | 1 | 1 | $2,116 |
| #13 | 1 | 1 | $2,116 |
| #14 | 1 | 1 | $2,116 |
| #15 | 1 | 1 | $2,116 |
| #16 | 1 | 1 | $2,116 |
| #17 | 1 | 1 | $2,116 |
| #18 | 1 | 1 | $2,116 |
| #19 | 1 | 1 | $2,116 |
| #20 | 1 | 1 | $2,116 |
| #21 | 1 | 1 | $2,116 |
| #22 | 1 | 1 | $2,116 |
| #23 | 1 | 1 | $2,116 |
| #24 | 1 | 1 | $2,116 |
| #25 | 1 | 1 | $2,116 |
| #26 | 1 | 1 | $2,116 |
| #27 | 1 | 1 | $2,116 |
| #28 | 1 | 1 | $2,116 |
| #29 | 1 | 1 | $2,116 |
| #30 | 1 | 1 | $2,116 |
| #31 | 1 | 1 | $2,116 |
| #32 | 1 | 1 | $2,116 |
| #33 | 1 | 1 | $2,116 |
| #34 | 1 | 1 | $2,116 |
| #35 | 1 | 1 | $2,116 |
| #36 | 1 | 1 | $2,116 |
| #37 | 1 | 1 | $2,116 |
| #38 | 1 | 1 | $2,116 |
| #39 | 1 | 1 | $2,116 |
| #40 | 1 | 1 | $2,116 |
| #41 | 1 | 1 | $2,116 |
| #42 | 1 | 1 | $2,116 |
| #43 | 1 | 1 | $2,116 |
| #44 | 1 | 1 | $2,116 |
| #45 | 1 | 1 | $2,116 |
| #46 | 1 | 1 | $2,116 |
| Total (46 units) | $102,077 | ||
UW: 25.0% down · 7.5% · 30yr · 1.5% tax · 5.0% vac · 8.0% maint · 8.0% mgmt
Financing live
Cash to close
- Down payment
- $400,000
- Closing costs
- $48,000
- Reserves months
- —
- Total cash needed
- —
Loan-product check · same deal, 3 products live
Conventional
25% down · 7.5% · 30yr
- Down + closing
- —
- Monthly P&I
- —
- Monthly cashflow
- —
- DSCR
- —
- Eligible?
- —
Personal DTI + credit; lowest rate.
DSCR
20% down · 8.5% · 30yr
- Down + closing
- —
- Monthly P&I
- —
- Monthly cashflow
- —
- DSCR
- —
- Eligible?
- —
No personal income docs; deal must DSCR.
Hard money
10% down · 12.0% · 12mo
- Down + closing
- —
- Monthly P&I
- —
- Monthly cashflow
- —
- DSCR
- —
- Eligible?
- —
Short-term bridge; refi at stabilization.
Rent comps 6 comps
| Address | Beds | Baths | Sqft | Rent | $/sqft | DOM | Units | Dist |
|---|---|---|---|---|---|---|---|---|
| 1050 1/2 S Bonnie Beach Pl Los Angeles, CA | 2.0 | 1.5 | 985 | $2,562 | $2.60 | 24d | 1 | 0.22mi |
| 3824 Princeton St Los Angeles, CA | 2.0 | 1.0 | 980 | $2,380 | $2.43 | 13d | 1 | 0.48mi |
| 455 Nassau Ave Los Angeles, CA | 2.0 | 2.0 | 1500 | $3,000 | $2.00 | 18d | 1 | 0.54mi |
| 4091 San Carlos St Unit 4089 Los Angeles, CA | 2.0 | 1.0 | 1100 | $2,795 | $2.54 | 7d | 1 | 1.08mi |
| 969 S Lorena St Unit 1/2 Commerce, CA | 2.0 | 2.5 | 1100 | $2,600 | $2.36 | 7d | 1 | 1.24mi |
| 969 S Lorena St Unit 1/2 Commerce, CA | 2.0 | 2.5 | 1100 | $2,600 | $2.36 | 5d | 1 | 1.24mi |
Listing history 14 events
-
2026-06-18days on market $1,600,000 Active 66 DOM
-
2026-06-17days on market $1,600,000 Active 65 DOM
-
2026-06-16days on market $1,600,000 Active 64 DOM
-
2026-06-15days on market $1,600,000 Active 63 DOM
-
2026-06-13days on market $1,600,000 Active 61 DOM
-
2026-06-09days on market $1,600,000 Active 57 DOM
-
2026-06-08pricedays on market $1,600,000 Active 56 DOM
-
2026-06-07days on market $1,995,000 Active 55 DOM
-
2026-06-04days on market $1,995,000 Active 52 DOM
-
2026-06-03days on market $1,995,000 Active 51 DOM
-
2026-06-02days on market $1,995,000 Active 50 DOM
-
2026-06-01days on market $1,995,000 Active 49 DOM
-
2026-05-31days on market $1,995,000 Active 48 DOM
-
2026-04-13$1,995,000 Active 2029-char remark
Show marketing remark (2029 chars)
We are proud to exclusively present 4153 Whittier Blvd, Los Angeles, California rare shovel-ready multifamily development opportunity in a strong infill East Los Angeles location. The property consists of an approximately 15,000 SF lot (0.344 acres) and is approved for a 51-unit, 3-story apartment development totaling approximately 29,130 gross building square feet. With the existing improvements already demolished and substantial predevelopment work completed, the site offers a meaningful advantage for a developer seeking to move efficiently into the next phase of construction. The approved project is situated on approximately 0.3444 net acres and includes a unit mix of 4 studios, 42 one-bedroom units, and 5 two-bedroom units within a 3-story building. The plans provide for 17 affordable units across multiple affordability levels, including units at 30%, 50%, 80%, and 120% AMI, while the balance of the project consists of 34 market-rate apartments. The approval also includes a density bonus structure that supports the 51-unit design, along with a waiver for a reduced front yard setback. Additional project highlights include no parking, 26 long-term bicycle spaces, 6 short-term bicycle spaces, a proposed height of approximately 41 feet, and County clearances from Public Health, Fire, and Public Works Land Development. This is an excellent opportunity for a developer to acquire a site where demolition has already been completed and substantial entitlement and permit work has already been secured, significantly reducing lead time and entitlement risk. Positioned just 0.03 miles from public transportation, 4153 Whittier Blvd offers the attributes today's urban multifamily developers seek: scale, transit accessibility, completed demolition, and meaningful entitlement progress. With site work already advanced and core development parameters established, this is an opportunity to acquire a Los Angeles infill project with reduced lead time, lower entitlement risk, and a clear path toward construction.
ⓘ Source: listings_history table (triggers on properties + properties_extension) + one-shot
backfill from property_details.listing_events for pre-trigger history.
Tax reassessment forecast CA · Resets to sale price
- Current annual tax
- $6,119 · $510/mo
- Projected year-2 tax
- $12,160 · $1,013/mo
- Expected delta
- +$6,041/yr (+$503/mo · 98.7%)
ⓘ Screening estimate from a state-policy table — verify with the county assessor before closing.
Nearby sold comps map
Loading sold comps map…
Walkable amenities ~0.75 mi
Loading nearby amenities…
Taxation est. · year 1
- Rental income
- $1,224,924
- − Mortgage interest
- −$89,625
- − Property taxes
- −$6,119
- − Insurance
- −$8,000
- − Repairs & maintenance
- −$97,994
- − Management
- −$97,994
- − Depreciation
- −$46,545
- Taxable income
- $878,647
- Est. tax owed @ 24.0%
- −$210,875
- After-tax cash flow
- $642,009/yr
For passive investors: Depreciation is non-cash, so a rental often shows a tax loss while cash-flowing — sheltering income. Rental losses are passive: they offset passive income freely, and up to $25,000/yr can offset ordinary (W-2) income if you actively participate and your MAGI is under $100k (phasing out to $0 by $150k); unused losses carry forward. On sale, claimed depreciation is recaptured at up to 25%, and gains may owe capital-gains tax (a 1031 exchange can defer both). Figures are a year-1 estimate at your 24.0% rate — not tax advice; consult a CPA.
Schools (NCES district)
- District
- Los Angeles Unified
- NCES district ID
- 0622710
- Math proficiency
- 29% ▼ -4.00%
- Reading proficiency
- 54% ▲ 10.00%
- Median HH income
- $50,403
- Composite
- 35.67/100
- National rank
- #4875
- State rank
- #223 of 517 in CA
Livability — East Los Angeles
- Score
- 60/100
- State rank
- #594
- US rank
- #19237
Category grades
Schools grade is shown separately in the Schools card above.
Census & demographics
- Census place
- East Los Angeles, CA
- County
- Los Angeles County · 9,444,647 people
- City population
- 108,740
- Metro
- Los Angeles-Long Beach-Anaheim, CA
- Population (ZIP)
- 43,857
- Household income
- $59,057
- Rent vs Own
- Severe rent burden
- 2670.0
Population outlook (Los Angeles County) Hauer SSP2
- Today (2025)
- 10,940,515 people
- By 2030
- 11,256,481 · +2.9%
- By 2040
- 11,729,929 · +7.2%
- By 2050
- 11,948,407 · +9.2%
- By 2075
- 11,818,114 · +8.0%
- By 2100
- 10,842,928 · -0.9%
Race, ethnicity, and origin ACS 2023
- Neighborhood character
- Predominantly Hispanic (96%)
- Race & ethnicity
- Hispanic / Latino 96% Two or more races 17% Native American 2% White 2%
- Hispanic origin (detail)
- Mexican 80%
- Common ancestry
- Italian 1%
- Foreign-born
- 41% · Canada, Jamaica
- Languages at home
- 16% English-only · Spanish 83%
Political lean MEDSL · Los Angeles
- 2024 margin
- Solid D (+32.9) · D 64.8% · R 31.9% · Other 3.3%
- 2008→2024 swing
- -7.4pp toward R · 2008: 40.4pp · 2024: 32.9pp
- All cycles
- 2024: D+32.9 2020: D+44.2 2016: D+48.0 2012: D+40.0 2008: D+40.4
Not yet ingested
- Civics
- —
Market trends
- HPI YoY
- ▼ -702.74%
- Current HPI
- 430.9762
- Rent YoY
- ▲ 0.21%
- Metro
- Los Angeles-Long Beach-Anaheim, CA
- State GDP YoY
- ▲ 3.21%
- F500 in state
- 116
Industry mix (Fortune 500 HQ in CA)
| Industry | F500 HQs | Revenue |
|---|---|---|
| Technology | 27 | $1,492B |
|
||
| Financial Services | 3 | $174B |
|
||
| Retail | 3 | $44B |
|
||
| Insurance | 3 | $26B |
|
||
| Media / Entertainment | 2 | $115B |
|
||
| Pharmaceuticals / Biotech | 2 | $62B |
|
||
Price history
1 event — show timeline
- 2026-04-13 Listed $1,995,000 TheMLS
Property tax history
+7.7%/yrLatest (2022): $6,119 · -14.3% YoY. Source: county tax records.
Cash-flow waterfall
monthlySold comps — $/sqft
last 12 mo · ≤1 miLoading sold comps…