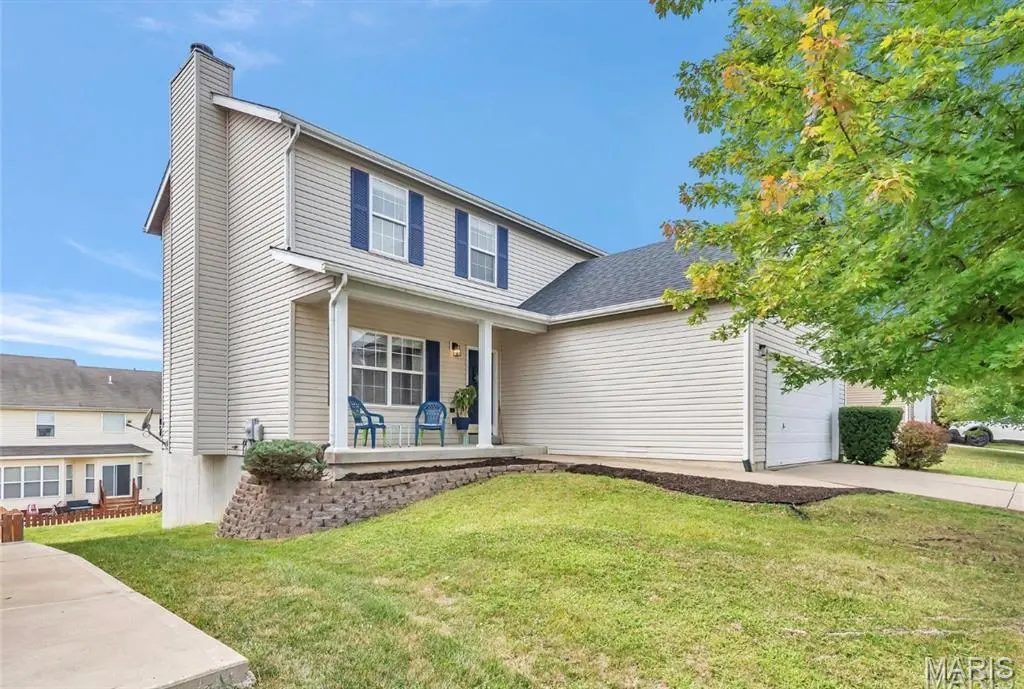
131 Brookfield Blvd · Wentzville, MO
Flood risk 1/10 · Minimal
- FEMA flood zone
- X (unshaded)
- Chance of flooding over 30 yrs
- 0.0%
- Est. flood insurance / yr
- $473 – $860
Fire risk 2/10 · Minimal
- Est. fire insurance / yr
- $1,054 – $1,958
Heat risk 4/10 · Minor
- Hot days now (above 106°F)
- 7 days/yr
- Hot days in 30 yrs
- 20 days/yr
Wind risk 2/10 · Minimal
- Chance of severe wind over 30 yrs
- 1.0%
Air-quality risk 1/10 · Minimal
- Unhealthy air days now
- 0 days/yr
- Unhealthy air days in 30 yrs
- 0 days/yr
Risk factors via First Street. Map © Google.
Why this score? — see what drove the D grade
The composite is a weighted blend of 9 inputs, each scored 0–100. Each bar is that input's sub-score; the figure is the points it added to the 100-point composite (weight × sub-score).
- ARV discount +13.8/15.0
- Cash flow +8.6/30.0
- Schools +4.3/10.0
- Livability +4.0/5.0
- Rent growth +3.5/5.0
- 1% rule +2.5/10.0
- Condition / age +2.5/5.0
- DSCR +2.4/10.0
- Appreciation +0.0/10.0
$299,900
🖨 Deal sheet (PDF) 📄 Offer letter ✓ Due diligence
Listing remarks
Welcome home to this charming 2-story home in the heart of Wentzville! Featuring 3 bedrooms, 2.5 baths, and over 1,800 sq ft of living space, this home offers a spacious layout filled with natural light. The inviting living room includes a cozy fireplace, while the eat-in kitchen features a center island, abundant cabinetry, and plenty of space for gatherings. Upstairs you’ll find generously sized bedrooms, including a primary suite with a walk-in closet and private bath. The unfinished walkout basement offers endless possibilities for additional living space, storage, or recreation. Conveniently located near schools, shopping, dining, and parks. Don’t miss this opportunity to m
Key facts
- Eat in kitchen
- 2 story home
- Cozy fireplace
Tags
Property features AI
Finance
- Other: Property type: Residential; Above-grade living area reported as 1,824 (assessor)
- HOA & community: Has HOA; $250 annually (includes other amenities)
Exterior
- Parking: Attached garage (2 spaces)
- Utilities: Public water; Public sewer; Electricity connected; Natural gas connected; Cable available
- Home design: Single family residence; Two levels
- Construction: Vinyl siding
- Exterior features: Front yard; Back yard
Interior
- Kitchen: Stainless steel appliances; Dishwasher; Disposal; Microwave; Electric oven; Range; Kitchen island; Pantry; Eat-in kitchen
- Bedrooms: 3 bedrooms (all on upper level)
- Bathrooms: 2 full bathrooms; 1 half bathroom
- Other interior: Fireplace (1); Basement: unfinished with 9+ ft poured walls
- Heating & cooling: Forced air heating (natural gas); Central electric air conditioning
- Interior features: Ceiling fans; Double vanity; Eat-in kitchen; High ceilings; Kitchen island; Pantry; Walk-in closets
- Laundry & utility: Laundry on 2nd floor; Washer/Dryer included; Water heater
Neighborhood map
What this means for you Summary
Snapshot
- This is a 3-bed/2.5-bath single-family listed at $300k.
Deal economics
- At list price, monthly cash flow is $-257 ($-3k/yr) — negative.
- To cash-flow at today's rent, offer at most $255k (15.1% below list).
- To meet the 1% rule (rent ≥ 1% of price), the offer needs to be $224k (25.3% below list).
- Recommended offer: $224k (25.3% below list) — sets the bar for 1% rule.
- Cap rate 5.3% vs local median 3.4% in Wentzville — top-decile yield for the area; either an underpriced asset or a hidden risk that comps aren't pricing in. Stress-test before assuming the spread holds.
Location & tenants
- Location reads 81/100 on livability (#14 in MO, #1,402 nationally) — a professional / high-income tenant draw. Strengths: crime A+, employment A+, housing A+; Watch: commute F.
- Wentzville R-IV (suburban): math 44% / reading 52% proficiency, ranked #32 of 324 in MO (top 10%) — families likely to look elsewhere, expect single-tenant / working-renter base with shorter leases; only 18% free/reduced lunch — higher-income household profile.
- Zoned schools: Wabash Elementary (math 36% / reading 47%, grade F, #517 of 1,115 statewide, top 46%, 775 students, 8% FRL); Wentzville Middle (math 40% / reading 42%, grade F, #172 of 391 statewide, top 46%, 794 students, 19% FRL); North Point High School (1,075 students, 10% FRL).
- Market conditions: Rents rising (+4.0%/yr); 700 active listings in the ZIP; 5 comparable units currently listed for rent nearby; rentals leasing fast (median 7d on market — plan ~1-2 weeks tenant-placement turnaround); high-income renter base; 2,021 units permitted in St. Charles County in 2024 (568 in 5+ unit buildings).
Forward outlook
- Local home prices are declining (-3.0%/yr); year-one equity from $2k of loan paydown is wiped out by about $9k of value loss. Plan a longer hold.
- St. Charles County population projected at +22% by 2050 — long-run rental-demand tailwind backs the buy-and-hold thesis.
Negotiation context
- Only 2 days on market — expect competitive offers; lowballing is unlikely to land.
- 5 sale attempts since 10y ago with the ask held roughly flat each time — persistent listings suggest the price (not the market) is what's stuck; bring a comps-based counter.
- Current owner paid $200k; 50% above their basis — modest negotiation headroom, anchor on the comps not their cost.
Questions for the listing agent
- What do current leases actually rent for vs. the listed asking? Can we see a recent rent roll and the last 12 months of T-12 income?
- What does the HOA fee cover, when was the last increase, and are there any pending special assessments or reserve-fund shortfalls?
- Is there a deadline driving the sale (1031 exchange, divorce, estate, relocation)? That informs how much negotiation room exists.
- Schools are B-rated — typically a magnet for longer-tenancy family renters. What's the average tenant stay here, and is there a school-zone premium baked into asking?
- The area grade is low — what's the realistic commute time and amenity access for the typical tenant pool here? Any planned neighborhood developments (good or bad) we should know about?
- What's the average days-on-market for RENTAL listings here right now (not sales)? A rising rental-DOM trend means longer vacancies and softer asking-rent achievability than the comps imply.
- What's the recent tenant-quality profile in this submarket — average credit score on applications, eviction rate, late-payment / NSF rate, and stable-employment percentage? A property-management company in the area should have these aggregated.
- How much new for-sale + rental construction is in the pipeline within 1–3 miles? Heavy new supply typically softens prices + rents 12–24 months out; constrained supply supports both.
Investment metrics
- 1% rule
- 0.75% ✗
- Cap rate
- 5.27%
- Cash-on-cash
- -3.67%
- DSCR
- 0.84
- GRM
- 11.2
CMA / ARV
- ARV (median comp)
- $349,058
- List price
- $299,900
- Delta
- -14.08%
- Verdict
- UNDERPRICED
- Comps
- 20 within 1.0 mi
Show comp detail 9 sales within ~0.75 mi
| Address | Dist | Beds/Ba | Sqft | Sold | Price | $/sf | Match |
|---|---|---|---|---|---|---|---|
| 200 Limerick Ave | 0.17mi | 4/2.0 (+1) | 1,840 (+1%) | 6mo | $395,000 | $215 | 78 |
| 379 Bears Den Dr | 0.07mi | 3/2.0 | 1,898 (+4%) | 16mo | $374,900 | $198 | 75 |
| 17 Brookfield Ct | 0.13mi | 3/2.0 | 1,747 (-4%) | 17mo | $300,000 | $172 | 71 |
| 283 Sonnet Cir | 0.31mi | 4/2.0 (+1) | 1,840 (+1%) | 12mo | $385,000 | $209 | 67 |
| 233 Charging Bear Dr | 0.38mi | 3/2.0 | 1,898 (+4%) | 9mo | $425,000 | $224 | 66 |
| 200 Shadow Glen Ln | 0.53mi | 3/2.0 | 1,840 (+1%) | 15mo | $359,000 | $195 | 60 |
| 223 Victoria Park Ave | 0.40mi | 3/2.0 | 1,624 (-11%) | 3mo | $449,000 | $276 | 58 |
| 136 Langtree Dr | 0.71mi | 3/2.5 | 1,732 (-5%) | 12mo | $300,000 | $173 | 48 |
| 287 Huntsdale Dr | 0.67mi | 4/2.0 (+1) | 1,957 (+7%) | 15mo | $547,500 | $280 | 38 |
Match score weights: distance 35% · size 25% · config 20% · recency 20%. Top-matched comps best support the ARV.
Projected returns pro-forma
-3.0% appreciation · 3.96% rent growth · sell at horizon
- IRR
- -21.4%
- Equity multiple
- 0.25×
- Total profit
- $-62,745
- Equity at exit
- $44,716
- IRR
- -13.0%
- Equity multiple
- 0.21×
- Total profit
- $-66,513
- Equity at exit
- $25,930
Cash invested: $83,972 (down + closing). Projections, not guarantees.
Landlord ↔ Tenant lean methodology
- Overall (STATE)
- 81 Strongly Landlord-Friendly
- State Missouri
- 81 Strongly Landlord-Friendly · R+10
- County
- — inherits STATE
- City
- — inherits STATE
ZIP-level market 63385
- Home prices YoY
- -31.2%
- Rents YoY
- 4.0%
- Active inventory
- 700
- Price-to-rent
- 11.2×
Monthly cashflow live
- Estimated rent
- $2,240 high interval (Pro) →
- Mortgage (P&I)
- −$1,573
- Tax from tax record
- −$308 /mo · $3,692/yr
- Insurance
- −$125
- HOA
- −$21
- Vacancy / Maint / Mgmt
- −$470
- Net cashflow
- $-257
Break-even live
Sensitivity live
| Price | -10% $-87 | -5% $-172 | +0% $-257 | +5% $-341 | +10% $-426 |
|---|---|---|---|---|---|
| Rent | -10% $-434 | -5% $-345 | +0% $-257 | +5% $-168 | +10% $-80 |
| Rate | -1.0pp $-106 | -0.5pp $-180 | base $-257 | +0.5pp $-334 | +1.0pp $-413 |
UW: 25.0% down · 7.5% · 30yr · 1.5% tax · 5.0% vac · 8.0% maint · 8.0% mgmt
Financing live
Cash to close
- Down payment
- $74,975
- Closing costs
- $8,997
- Reserves months
- —
- Total cash needed
- —
Loan-product check · same deal, 3 products live
Conventional
25% down · 7.5% · 30yr
- Down + closing
- —
- Monthly P&I
- —
- Monthly cashflow
- —
- DSCR
- —
- Eligible?
- —
Personal DTI + credit; lowest rate.
DSCR
20% down · 8.5% · 30yr
- Down + closing
- —
- Monthly P&I
- —
- Monthly cashflow
- —
- DSCR
- —
- Eligible?
- —
No personal income docs; deal must DSCR.
Hard money
10% down · 12.0% · 12mo
- Down + closing
- —
- Monthly P&I
- —
- Monthly cashflow
- —
- DSCR
- —
- Eligible?
- —
Short-term bridge; refi at stabilization.
Rent comps 5 comps
| Address | Beds | Baths | Sqft | Rent | $/sqft | DOM | Units | Dist |
|---|---|---|---|---|---|---|---|---|
| 121 Brookfield Blvd Wentzville, MO | 3.0 | 2.5 | 2000 | $2,261 | $1.13 | 12d | 1 | 0.03mi |
| 17 Brookfield Ct Wentzville, MO | 3.0 | 2.0 | 1747 | $2,340 | $1.34 | 0d | 1 | 0.10mi |
| 305 Shadow Trace Dr Wentzville, MO | 3.0 | 2.0 | 1448 | $1,985 | $1.37 | 0d | 1 | 0.59mi |
| 24 Chesterfield Ct Unit n/a Wentzville, MO | 3.0 | 2.5 | 1404 | $2,150 | $1.53 | 6d | 1 | 0.98mi |
| 5542 Autumn Trace Pkwy Wentzville, MO | 3.0 | 2.0 | 1440 | $2,400 | $1.67 | 19d | 1 | 1.47mi |
HOA detail
- Monthly dues
- $21 · $252/yr
Listing history 17 events
-
2026-06-21statusdays on market $299,900 Coming Soon 2 DOM
-
2026-04-23status Active
-
2026-03-29status Pending
-
2026-03-26$299,900 Active
-
2026-03-25historical
-
2024-10-11historical
-
2024-08-30price $333,000
-
2024-08-23price $362,500
-
2024-08-14$375,000 Active
-
2024-08-06historical
-
2024-07-27$395,000 Active
-
2016-12-02soldstatus $200,000
-
2016-11-30status Pending
-
2016-11-30soldstatus Closed
-
2016-10-20historical Contingent (No Kickout)
-
2016-10-18$199,999 Active
-
2006-11-02soldstatus $3,419,680
ⓘ Source: listings_history table (triggers on properties + properties_extension) + one-shot
backfill from property_details.listing_events for pre-trigger history.
Tax reassessment forecast MO · Resets to sale price
- Current annual tax
- $3,692 · $308/mo
- Projected year-2 tax
- $3,692 · $308/mo
- Expected delta
- $0/yr ($0/mo · 0.0%)
ⓘ Screening estimate from a state-policy table — verify with the county assessor before closing.
Climate risk First Street
- Flood 1/10 Low FEMA zone X (unshaded) · 0% chance over 30 yrs
- Wildfire 2/10 Low
- Heat 4/10 Moderate 7 d/yr ≥106°F today · 20 d/yr by 30 yrs out
- Wind 2/10 Low 100% chance of damaging wind over 30 yrs
- Air quality 1/10 Low 0 unhealthy d/yr today · 0 by 30 yrs out
Nearby sold comps map
Loading sold comps map…
Walkable amenities ~0.75 mi
Loading nearby amenities…
Taxation est. · year 1
- Rental income
- $26,884
- − Mortgage interest
- −$16,799
- − Property taxes
- −$3,692
- − Insurance
- −$1,500
- − Repairs & maintenance
- −$2,151
- − Management
- −$2,151
- − HOA
- −$252
- − Depreciation
- −$8,724
- Taxable loss
- −$8,385
- Est. tax savings @ 24.0%
- +$2,012
- After-tax cash flow
- $-1,066/yr
For passive investors: Depreciation is non-cash, so a rental often shows a tax loss while cash-flowing — sheltering income. Rental losses are passive: they offset passive income freely, and up to $25,000/yr can offset ordinary (W-2) income if you actively participate and your MAGI is under $100k (phasing out to $0 by $150k); unused losses carry forward. On sale, claimed depreciation is recaptured at up to 25%, and gains may owe capital-gains tax (a 1031 exchange can defer both). Figures are a year-1 estimate at your 24.0% rate — not tax advice; consult a CPA.
Schools (NCES district)
- District
- Wentzville R-IV
- NCES district ID
- 2931650
- Math proficiency
- 44% ▼ -9.00%
- Reading proficiency
- 52% ▼ -7.00%
- Median HH income
- $74,961
- Composite
- 43.49/100
- National rank
- #2994
- State rank
- #32 of 324 in MO
Livability — Wentzville
- Score
- 81/100
- State rank
- #14
- US rank
- #1402
Category grades
Schools grade is shown separately in the Schools card above.
Census & demographics
- Census place
- Wentzville, MO
- County
- Saint Charles County · 399,703 people
- City population
- 51,330
- Metro
- St. Louis, MO-IL
- Population (ZIP)
- 51,330
- Household income
- $112,199
- Rent vs Own
- Severe rent burden
- 662.0
Population outlook (St. Charles County) Hauer SSP2
- Today (2025)
- 437,857 people
- By 2030
- 461,707 · +5.4%
- By 2040
- 503,222 · +14.9%
- By 2050
- 534,684 · +22.1%
- By 2075
- 597,047 · +36.4%
- By 2100
- 609,682 · +39.2%
Race, ethnicity, and origin ACS 2023
- Neighborhood character
- Predominantly White (86%)
- Race & ethnicity
- White 86% Black 5% Two or more races 5% Hispanic / Latino 3% Asian 2%
- Common ancestry
- Lithuanian 3% Romanian 3% Italian 2%
- Foreign-born
- 2% · Canada, China
- Languages at home
- 97% English-only · Spanish 2%
Political lean MEDSL · St. Charles
- 2024 margin
- R (+17.0) · D 40.8% · R 57.8% · Other 1.4%
- 2008→2024 swing
- -7.2pp toward R · 2008: -9.7pp · 2024: -17.0pp
- All cycles
- 2024: R+17.0 2020: R+17.5 2016: R+26.4 2012: R+21.0 2008: R+9.7
Not yet ingested
- Civics
- —
Market trends
- HPI YoY
- ▼ -97.98%
- Current HPI
- 216.4917
- Rent YoY
- ▲ 3.96%
- Metro
- St. Louis, MO-IL
- State GDP YoY
- ▲ 1.84%
- F500 in state
- 20
Industry mix (Fortune 500 HQ in MO)
| Industry | F500 HQs | Revenue |
|---|---|---|
| Healthcare | 1 | $163B |
|
||
| Insurance | 1 | $21B |
|
||
| Industrial Technology | 1 | $17B |
|
||
| Retail | 1 | $16B |
|
||
| Industrial Distribution | 1 | $10B |
|
||
| Utilities | 1 | $9B |
|
||
Price history
-91.2% since first listed17 events — show timeline
- 2026-06-19 Coming Soon $299,900 MARIS as Distributed by MLS Grid
- 2026-04-23 Relisted — MARIS as Distributed by MLS Grid
- 2026-03-29 Pending — MARIS as Distributed by MLS Grid
- 2026-03-26 Listed $299,900 MARIS as Distributed by MLS Grid
- 2026-03-25 Coming Soon — MARIS as Distributed by MLS Grid
- 2024-10-11 Delisted — MARIS as Distributed by MLS Grid
- 2024-08-30 Price Changed $333,000 MARIS as Distributed by MLS Grid
- 2024-08-23 Price Changed $362,500 MARIS as Distributed by MLS Grid
- 2024-08-14 Listed $375,000 MARIS as Distributed by MLS Grid
- 2024-08-06 Delisted — MARIS as Distributed by MLS Grid
- 2024-07-27 Listed $395,000 MARIS as Distributed by MLS Grid
- 2016-12-02 Sold (Public Records) $200,000 Public Records
- 2016-11-30 Pending — MARIS as Distributed by MLS Grid
- 2016-11-30 Sold (MLS) — MARIS as Distributed by MLS Grid
- 2016-10-20 Contingent — MARIS as Distributed by MLS Grid
- 2016-10-18 Listed $199,999 MARIS as Distributed by MLS Grid
- 2006-11-02 Sold (Public Records) $3,419,680 Public Records
Property tax history
+4.4%/yrLatest (2025): $3,692 · +5.7% YoY. Source: county tax records.
Cash-flow waterfall
monthlySold comps — $/sqft
last 12 mo · ≤1 miLoading sold comps…