3514 Spring Time St · Talty, TX
Flood risk No data
- FEMA flood zone
- —
- Chance of flooding over 30 yrs
- —
- Est. flood insurance / yr
- —
Fire risk No data
- Est. fire insurance / yr
- —
Heat risk No data
- Hot days now (above threshold)
- —
- Hot days in 30 yrs
- —
Wind risk No data
- Chance of severe wind over 30 yrs
- —
Air-quality risk No data
- Unhealthy air days now
- —
- Unhealthy air days in 30 yrs
- —
Risk factors via First Street. Map © Google.
Why this score? — see what drove the D grade
The composite is a weighted blend of 9 inputs, each scored 0–100. Each bar is that input's sub-score; the figure is the points it added to the 100-point composite (weight × sub-score).
- Cash flow +12.2/30.0
- ARV discount +7.5/15.0
- Schools +4.0/10.0
- Condition / age +4.0/5.0
- 1% rule +3.7/10.0
- DSCR +3.6/10.0
- Livability +3.0/5.0
- Rent growth +2.9/5.0
- Appreciation +0.0/10.0
$227,990
🖨 Deal sheet (PDF) 📄 Offer letter ✓ Due diligence
Listing remarks
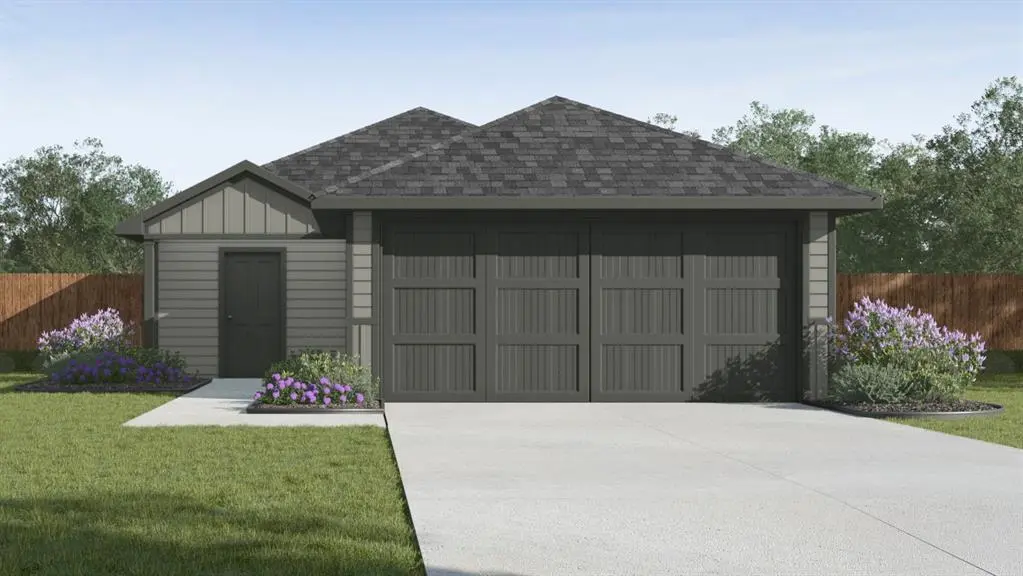
Beautiful new home. Home features 3 bedrooms with 2 full baths, 2 car garage. Open concept at affordable pricing.
Key facts
- 4,792 sq ft lot
- 2 garage spots
- Built 2026
Property features AI
Finance
- Other: Directions to property available; Listing is a builder special listing condition
- Financial info: No second mortgage reported
- HOA & community: Mandatory association with semi-annual fee (approximately $250); Association fee includes full use of facilities; HOA managed by Neighborhood Management
Exterior
- Parking: Attached garage with 2 covered spaces (garage roughly 19' x 20'); Driveway
- Security: Carbon monoxide detector(s); Smoke detector(s)
- Utilities: MUD water; MUD sewer; Property in a Municipal Utility District
- Home design: Single-family residence; One-story; New construction (incomplete, year built 2026); Not attached to another property
- Construction: New construction - incomplete (2026)
- Exterior features: Lot smaller than 0.5 acre (approx. 0.11 acre); Subdivision: Maplewood Meadows; Carbon monoxide and smoke detectors
Interior
- Kitchen: Kitchen with island; Dishwasher; Electric oven; Electric range; Microwave
- Bedrooms: Primary bedroom on main level with walk-in closet (15 x 10); Two additional bedrooms on main level (each about 10 x 9)
- Flooring: Laminate flooring
- Bathrooms: Two full bathrooms
- Heating & cooling: Heating and cooling details not provided
- Interior features: Cable TV available; High-speed internet available; One living area; One dining area; Total of 6 rooms
- Laundry & utility: Laundry/utility details not provided
Neighborhood map
What this means for you Summary
Snapshot
- This is a 3-bed/2.0-bath single-family listed at $228k. Condition is rated good.
Deal economics
- At list price, monthly cash flow is $-45 ($-539/yr) — negative.
- To cash-flow at today's rent, offer at most $221k (2.9% below list).
- To meet the 1% rule (rent ≥ 1% of price), the offer needs to be $199k (12.7% below list).
- Recommended offer: $199k (12.7% below list) — sets the bar for 1% rule.
- Cap rate 6.1% vs local median 1.9% in Talty — top-decile yield for the area; either an underpriced asset or a hidden risk that comps aren't pricing in. Stress-test before assuming the spread holds.
Location & tenants
- Location reads 59/100 on livability (#1,124 in TX) — a working-class tenant base; expect higher turnover. Strengths: crime A+, employment A+, housing A+; Watch: amenities F, commute F, cost of living F.
- Forney ISD (rural): math 41% / reading 44% proficiency, ranked #234 of 826 in TX (top 28%) — families likely to look elsewhere, expect single-tenant / working-renter base with shorter leases.
- Zoned schools: Willett El (725 students, 32% FRL); Warren Middle (math 43% / reading 50%, grade D+, #443 of 1,662 statewide, top 28%, 903 students, 26% FRL); Forney H S (math 64% / reading 58%, grade C+, #258 of 1,632 statewide, top 16%, 2,272 students, 28% FRL) — zoned schools at 28% FRL track the district average.
- Market conditions: Rents rising (+1.4%/yr); 2200 active listings in the ZIP; solid renter incomes; 1,747 units permitted in Kaufman County in 2024 (180 in 5+ unit buildings).
Forward outlook
- Local home prices are declining (-3.0%/yr); year-one equity from $2k of loan paydown is wiped out by about $7k of value loss. Plan a longer hold.
- Kaufman County population projected at +43% by 2050 — long-run rental-demand tailwind backs the buy-and-hold thesis.
Negotiation context
- It's been on market 33 days — a 3% lower offer ($221k) is reasonable based on typical stale-listing flexibility.
Questions for the listing agent
- What do current leases actually rent for vs. the listed asking? Can we see a recent rent roll and the last 12 months of T-12 income?
- It's been on market 33 days. Have you received any prior offers? Is the seller open to a 13% concession, seller financing, or rate buy-down credit?
- What does the HOA fee cover, when was the last increase, and are there any pending special assessments or reserve-fund shortfalls?
- Is there a deadline driving the sale (1031 exchange, divorce, estate, relocation)? That informs how much negotiation room exists.
- Schools are F-rated, which usually means shorter tenancies and higher turnover. Who's the typical renter profile here, and what's been the actual vacancy rate?
- The area grade is low — what's the realistic commute time and amenity access for the typical tenant pool here? Any planned neighborhood developments (good or bad) we should know about?
- What's the average days-on-market for RENTAL listings here right now (not sales)? A rising rental-DOM trend means longer vacancies and softer asking-rent achievability than the comps imply.
- What's the recent tenant-quality profile in this submarket — average credit score on applications, eviction rate, late-payment / NSF rate, and stable-employment percentage? A property-management company in the area should have these aggregated.
- How much new for-sale + rental construction is in the pipeline within 1–3 miles? Heavy new supply typically softens prices + rents 12–24 months out; constrained supply supports both.
Investment metrics
- 1% rule
- 0.87% ✗
- Cap rate
- 6.06%
- Cash-on-cash
- -0.84%
- DSCR
- 0.96
- GRM
- 9.5
CMA / ARV
No comps found within radius.
Projected returns pro-forma
-3.0% appreciation · 1.42% rent growth · sell at horizon
- IRR
- -19.5%
- Equity multiple
- 0.33×
- Total profit
- $-42,866
- Equity at exit
- $33,994
- IRR
- -16.0%
- Equity multiple
- 0.17×
- Total profit
- $-53,170
- Equity at exit
- $19,712
Cash invested: $63,837 (down + closing). Projections, not guarantees.
Landlord ↔ Tenant lean methodology
- Overall (STATE)
- 87 Strongly Landlord-Friendly
- State Texas
- 87 Strongly Landlord-Friendly · R+5
- County
- — inherits STATE
- City
- — inherits STATE
ZIP-level market 75126
- Rents YoY
- 1.4%
- Active inventory
- 2200
- Price-to-rent
- 9.5×
Monthly cashflow live
- Estimated rent
- $1,991 medium interval (Pro) →
- Mortgage (P&I)
- −$1,196
- Tax est. 1.5%
- −$285 /mo · $3,420/yr
- Insurance
- −$95
- HOA
- −$42
- Vacancy / Maint / Mgmt
- −$418
- Net cashflow
- $-45
Break-even live
Sensitivity live
| Price | -10% $113 | -5% $34 | +0% $-45 | +5% $-124 | +10% $-202 |
|---|---|---|---|---|---|
| Rent | -10% $-202 | -5% $-124 | +0% $-45 | +5% $34 | +10% $112 |
| Rate | -1.0pp $70 | -0.5pp $13 | base $-45 | +0.5pp $-104 | +1.0pp $-164 |
UW: 25.0% down · 7.5% · 30yr · 1.5% tax · 5.0% vac · 8.0% maint · 8.0% mgmt
Financing live
Cash to close
- Down payment
- $56,998
- Closing costs
- $6,840
- Reserves months
- —
- Total cash needed
- —
Loan-product check · same deal, 3 products live
Conventional
25% down · 7.5% · 30yr
- Down + closing
- —
- Monthly P&I
- —
- Monthly cashflow
- —
- DSCR
- —
- Eligible?
- —
Personal DTI + credit; lowest rate.
DSCR
20% down · 8.5% · 30yr
- Down + closing
- —
- Monthly P&I
- —
- Monthly cashflow
- —
- DSCR
- —
- Eligible?
- —
No personal income docs; deal must DSCR.
Hard money
10% down · 12.0% · 12mo
- Down + closing
- —
- Monthly P&I
- —
- Monthly cashflow
- —
- DSCR
- —
- Eligible?
- —
Short-term bridge; refi at stabilization.
HOA detail
- Monthly dues
- $42 · $504/yr
Listing history 16 events
-
2026-06-21days on market $227,990 Active 33 DOM
-
2026-06-18days on market $227,990 Active 30 DOM
-
2026-06-17days on market $227,990 Active 29 DOM
-
2026-06-16days on market $227,990 Active 28 DOM
-
2026-06-15days on market $227,990 Active 27 DOM
-
2026-06-13days on market $227,990 Active 25 DOM
-
2026-06-13days on market $227,990 Active 24 DOM
-
2026-06-09days on market $227,990 Active 21 DOM
-
2026-06-08days on market $227,990 Active 20 DOM
-
2026-06-07pricedays on market $227,990 Active 19 DOM
-
2026-06-04days on market $240,990 Active 16 DOM
-
2026-06-03days on market $240,990 Active 15 DOM
-
2026-06-02days on market $240,990 Active 14 DOM
-
2026-06-01days on market $240,990 Active 13 DOM
-
2026-05-31days on market $240,990 Active 12 DOM
-
2026-05-19$240,990 Active
ⓘ Source: listings_history table (triggers on properties + properties_extension) + one-shot
backfill from property_details.listing_events for pre-trigger history.
Nearby sold comps map
Loading sold comps map…
Walkable amenities ~0.75 mi
Loading nearby amenities…
Taxation est. · year 1
- Rental income
- $23,889
- − Mortgage interest
- −$12,771
- − Property taxes
- −$3,420
- − Insurance
- −$1,140
- − Repairs & maintenance
- −$1,911
- − Management
- −$1,911
- − HOA
- −$504
- − Depreciation
- −$6,632
- Taxable loss
- −$4,401
- Est. tax savings @ 24.0%
- +$1,056
- After-tax cash flow
- $517/yr
For passive investors: Depreciation is non-cash, so a rental often shows a tax loss while cash-flowing — sheltering income. Rental losses are passive: they offset passive income freely, and up to $25,000/yr can offset ordinary (W-2) income if you actively participate and your MAGI is under $100k (phasing out to $0 by $150k); unused losses carry forward. On sale, claimed depreciation is recaptured at up to 25%, and gains may owe capital-gains tax (a 1031 exchange can defer both). Figures are a year-1 estimate at your 24.0% rate — not tax advice; consult a CPA.
Condition & rehab AI · 26 photos
This home is in excellent condition with modern finishes and a well-maintained exterior. It is move-in ready and would benefit from minor updates to enhance its curb appeal and value.
Value-add opportunities
- Both Painting exterior and interior walls — Fresh paint can enhance curb appeal and interior aesthetics
- Both Landscaping improvements — Enhances curb appeal and can increase property value
- Both Add smart home features — Improves convenience and can increase property value
Renovation cost estimate screening
Value-add ROI direction
- Both Painting exterior and interior walls — Fresh paint can enhance curb appeal and interior aesthetics ↑
- Both Landscaping improvements — Enhances curb appeal and can increase property value ↑
- Both Add smart home features — Improves convenience and can increase property value ↑
ⓘ Cost ranges are severity-bucket heuristics (US national rule-of-thumb). Get contractor quotes + a written scope before underwriting a rehab budget.
Schools (NCES district)
- District
- Forney ISD
- NCES district ID
- 4819560
- Math proficiency
- 41% ▼ -20.00%
- Reading proficiency
- 44% ▼ -12.00%
- Median HH income
- $86,679
- Composite
- 40.07/100
- National rank
- #3812
- State rank
- #234 of 826 in TX
Livability — Talty
- Score
- 59/100
- State rank
- #1124
- US rank
- #19820
Category grades
Schools grade is shown separately in the Schools card above.
Census & demographics
- Census place
- Talty, TX
- County
- Kaufman County · 122,338 people
- City population
- 84,799
- Metro
- Dallas-Fort Worth-Arlington, TX
- Population (ZIP)
- 84,799
- Household income
- $103,673
- Rent vs Own
- Severe rent burden
- 1306.0
Population outlook (Kaufman County) Hauer SSP2
- Today (2025)
- 138,716 people
- By 2030
- 150,815 · +8.7%
- By 2040
- 174,877 · +26.1%
- By 2050
- 198,020 · +42.8%
- By 2075
- 251,908 · +81.6%
- By 2100
- 285,325 · +105.7%
Race, ethnicity, and origin ACS 2023
- Neighborhood character
- Diverse neighborhood (Simpson 0.68)
- Race & ethnicity
- White 45% Black 25% Hispanic / Latino 23% Two or more races 14% Asian 3%
- Hispanic origin (detail)
- Mexican 18% Puerto Rican 1%
- Common ancestry
- Italian 2% Slovak 1% Portuguese 1%
- Foreign-born
- 12% · Canada, Vietnam
- Languages at home
- 79% English-only · Spanish 14% Arabic 1% Vietnamese 1%
Political lean MEDSL · Kaufman
- 2024 margin
- Strong R (+27.9) · D 35.6% · R 63.5%
- 2008→2024 swing
- +7.9pp toward D · 2008: -35.8pp · 2024: -27.9pp
- All cycles
- 2024: R+27.9 2020: R+33.9 2016: R+47.0 2012: R+44.4 2008: R+35.8
Not yet ingested
- Civics
- —
Market trends
- HPI YoY
- ▼ -102.93%
- Current HPI
- 148.5749
- Rent YoY
- ▲ 1.42%
- Metro
- Dallas-Fort Worth-Arlington, TX
- State GDP YoY
- ▲ 3.95%
- F500 in state
- 110
Industry mix (Fortune 500 HQ in TX)
| Industry | F500 HQs | Revenue |
|---|---|---|
| Energy | 16 | $1,198B |
|
||
| Technology | 5 | $198B |
|
||
| Engineering / Construction | 4 | $72B |
|
||
| Energy Services | 3 | $60B |
|
||
| Utilities | 3 | $41B |
|
||
| Healthcare | 2 | $330B |
|
||
Price history
1 event — show timeline
- 2026-05-19 Listed $240,990 NTREIS
Cash-flow waterfall
monthlySold comps — $/sqft
last 12 mo · ≤1 miLoading sold comps…