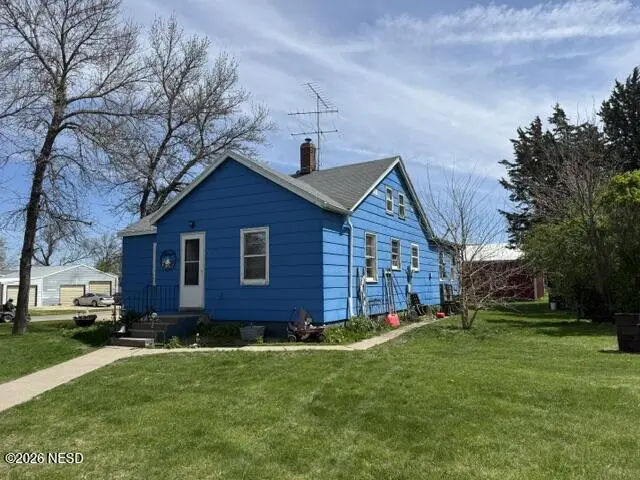
301 North St E · Badger, SD
Flood risk 1/10 · Minimal
- FEMA flood zone
- —
- Chance of flooding over 30 yrs
- 0.0%
- Est. flood insurance / yr
- —
Fire risk 2/10 · Minimal
- Est. fire insurance / yr
- $1,342 – $2,492
Heat risk 2/10 · Minimal
- Hot days now (above 99°F)
- 7 days/yr
- Hot days in 30 yrs
- 14 days/yr
Wind risk 2/10 · Minimal
- Chance of severe wind over 30 yrs
- —
Air-quality risk 2/10 · Minimal
- Unhealthy air days now
- 1 days/yr
- Unhealthy air days in 30 yrs
- 1 days/yr
Risk factors via First Street. Map © Google.
Why this score? — see what drove the B- grade
The composite is a weighted blend of 9 inputs, each scored 0–100. Each bar is that input's sub-score; the figure is the points it added to the 100-point composite (weight × sub-score).
- Cash flow +26.3/30.0
- DSCR +8.9/10.0
- ARV discount +7.5/15.0
- 1% rule +7.0/10.0
- Schools +6.1/10.0
- Appreciation +5.0/10.0
- Livability +3.0/5.0
- Rent growth +2.5/5.0
- Condition / age +2.2/5.0
$89,900
🖨 Deal sheet (PDF) 📄 Offer letter ✓ Due diligence
Key facts
- 0.24 acre lot
- Garage
- Built 1935
Property features AI
Exterior
- Parking: Attached garage (1 car)
- Home design: Single-family residence; One and a half stories
- Exterior features: Lot roughly 0.24 acres (approximately 75 x 140)
Interior
- Bathrooms: Two full bathrooms
- Interior features: Full basement
Neighborhood map
What this means for you Summary
Snapshot
- This is a 2-bed/2.0-bath single-family listed at $90k. Condition is rated fair.
Deal economics
- At list price, monthly cash flow is $233 ($3k/yr) — positive.
- The deal already cash-flows at list — no discount required.
- Meets the 1% rule at list price ($1k rent vs $90k).
- Recommended offer: $89k (1.5% below list) — sets the bar for market timing.
Location & tenants
- Location reads 59/100 on livability (#260 in SD) — a working-class tenant base; expect higher turnover. Strengths: cost of living A+, housing A+; Watch: employment C-, crime F, amenities F.
- Arlington School District 38-1 (rural): math 75% / reading 65% proficiency, ranked #3 of 148 in SD (top 2%) — strong family-tenant draw, lease renewals of 3-5y typical; only 16% free/reduced lunch — higher-income household profile.
- Zoned schools: Arlington Elementary - 02 (math 82% / reading 72%, grade A, #8 of 253 statewide, top 3%, 155 students, 17% FRL); Arlington Jr. High - 03 (math 84% / reading 74%, grade A+, #1 of 143 statewide, top 0%, 38 students, 8% FRL); Arlington High School - 01 (math 70% / reading 50%, grade C+, #31 of 151 statewide, top 32%, 88 students, 15% FRL) — zoned schools at 13% FRL track the district average.
- Market conditions: 2 active listings in the ZIP; 22 units permitted in Kingsbury County in 2024 (0 in 5+ unit buildings).
Forward outlook
- In year one you build about $3k of equity ($622 loan paydown + $3k appreciation (3.0% local appreciation)).
- Kingsbury County population projected to shrink 5% by 2050 — rents likely to lag national; underwrite the cash flow, not the appreciation.
- At projected returns (3.0% appreciation + 3.0% rent growth), your $25k cash investment doubles in ~4 years — after that, you're playing with house money.
- By year 10, paydown + projected appreciation supports a ~$32k cash-out refi (75% LTV) — recoverable capital for the next deal without selling this one.
Negotiation context
- It's been on market 28 days — a 2% lower offer ($89k) is reasonable based on typical stale-listing flexibility.
Risks & watch-outs
- Watch-outs: built in 1935 — expect roof / HVAC / electrical / plumbing capex.
Questions for the listing agent
- Have any recent inspections been done? Can we get a copy of the seller's disclosures and any deferred-maintenance estimates?
- Built in 1935 — when were the roof, HVAC, electrical panel, plumbing, and water heater last replaced?
- Is there a deadline driving the sale (1031 exchange, divorce, estate, relocation)? That informs how much negotiation room exists.
- Schools are F-rated, which usually means shorter tenancies and higher turnover. Who's the typical renter profile here, and what's been the actual vacancy rate?
- Crime grade is F in this area — have there been break-ins, vandalism, or insurance claims at this property in the last 3 years? What carrier currently insures it and at what premium?
- What's the average days-on-market for RENTAL listings here right now (not sales)? A rising rental-DOM trend means longer vacancies and softer asking-rent achievability than the comps imply.
- What's the recent tenant-quality profile in this submarket — average credit score on applications, eviction rate, late-payment / NSF rate, and stable-employment percentage? A property-management company in the area should have these aggregated.
- How much new for-sale + rental construction is in the pipeline within 1–3 miles? Heavy new supply typically softens prices + rents 12–24 months out; constrained supply supports both.
Investment metrics
- 1% rule
- 1.20% ✓
- Cap rate
- 9.40%
- Cash-on-cash
- 11.11%
- DSCR
- 1.49
- GRM
- 6.9
CMA / ARV
No comps found within radius.
Projected returns pro-forma
3.0% appreciation · 3.0% rent growth · sell at horizon
- IRR
- 17.9%
- Equity multiple
- 2.02×
- Total profit
- $25,690
- Equity at exit
- $40,423
- IRR
- 19.3%
- Equity multiple
- 3.81×
- Total profit
- $70,687
- Equity at exit
- $62,297
Cash invested: $25,172 (down + closing). Projections, not guarantees.
Landlord ↔ Tenant lean methodology
- Overall (STATE)
- 83 Strongly Landlord-Friendly
- State South Dakota
- 83 Strongly Landlord-Friendly · R+16
- County
- — inherits STATE
- City
- — inherits STATE
ZIP-level market 57214
- Active inventory
- 2
- Price-to-rent
- 6.9×
Monthly cashflow live
- Estimated rent
- $1,081 medium interval (Pro) →
- Mortgage (P&I)
- −$471
- Tax est. 1.5%
- −$112 /mo · $1,348/yr
- Insurance
- −$37
- HOA
- −$0
- Vacancy / Maint / Mgmt
- −$227
- Net cashflow
- $233
Break-even live
Sensitivity live
| Price | -10% $295 | -5% $264 | +0% $233 | +5% $202 | +10% $171 |
|---|---|---|---|---|---|
| Rent | -10% $148 | -5% $190 | +0% $233 | +5% $276 | +10% $318 |
| Rate | -1.0pp $278 | -0.5pp $256 | base $233 | +0.5pp $210 | +1.0pp $186 |
UW: 25.0% down · 7.5% · 30yr · 1.5% tax · 5.0% vac · 8.0% maint · 8.0% mgmt
Financing live
Cash to close
- Down payment
- $22,475
- Closing costs
- $2,697
- Reserves months
- —
- Total cash needed
- —
Loan-product check · same deal, 3 products live
Conventional
25% down · 7.5% · 30yr
- Down + closing
- —
- Monthly P&I
- —
- Monthly cashflow
- —
- DSCR
- —
- Eligible?
- —
Personal DTI + credit; lowest rate.
DSCR
20% down · 8.5% · 30yr
- Down + closing
- —
- Monthly P&I
- —
- Monthly cashflow
- —
- DSCR
- —
- Eligible?
- —
No personal income docs; deal must DSCR.
Hard money
10% down · 12.0% · 12mo
- Down + closing
- —
- Monthly P&I
- —
- Monthly cashflow
- —
- DSCR
- —
- Eligible?
- —
Short-term bridge; refi at stabilization.
Listing history 14 events
-
2026-06-17status $89,900 Pending 28 DOM
-
2026-06-16days on market $89,900 Active 28 DOM
-
2026-06-15days on market $89,900 Active 27 DOM
-
2026-06-13days on market $89,900 Active 25 DOM
-
2026-06-12days on market $89,900 Active 24 DOM
-
2026-06-09days on market $89,900 Active 21 DOM
-
2026-06-08days on market $89,900 Active 20 DOM
-
2026-06-08days on market $89,900 Active 19 DOM
-
2026-06-05days on market $89,900 Active 17 DOM
-
2026-06-04days on market $89,900 Active 15 DOM
-
2026-06-02days on market $89,900 Active 14 DOM
-
2026-06-01days on market $89,900 Active 13 DOM
-
2026-05-31days on market $89,900 Active 12 DOM
-
2026-05-18$89,900 Active
ⓘ Source: listings_history table (triggers on properties + properties_extension) + one-shot
backfill from property_details.listing_events for pre-trigger history.
Climate risk First Street
- Flood 1/10 Low 0% chance over 30 yrs
- Wildfire 2/10 Low
- Heat 2/10 Low 7 d/yr ≥99°F today · 14 d/yr by 30 yrs out
- Wind 2/10 Low
- Air quality 2/10 Low 1 unhealthy d/yr today · 1 by 30 yrs out
Nearby sold comps map
Loading sold comps map…
Walkable amenities ~0.75 mi
Loading nearby amenities…
Taxation est. · year 1
- Rental income
- $12,977
- − Mortgage interest
- −$5,036
- − Property taxes
- −$1,348
- − Insurance
- −$450
- − Repairs & maintenance
- −$1,038
- − Management
- −$1,038
- − Depreciation
- −$2,615
- Taxable income
- $1,452
- Est. tax owed @ 24.0%
- −$348
- After-tax cash flow
- $2,448/yr
For passive investors: Depreciation is non-cash, so a rental often shows a tax loss while cash-flowing — sheltering income. Rental losses are passive: they offset passive income freely, and up to $25,000/yr can offset ordinary (W-2) income if you actively participate and your MAGI is under $100k (phasing out to $0 by $150k); unused losses carry forward. On sale, claimed depreciation is recaptured at up to 25%, and gains may owe capital-gains tax (a 1031 exchange can defer both). Figures are a year-1 estimate at your 24.0% rate — not tax advice; consult a CPA.
Condition & rehab AI · 13 photos
The home requires moderate repairs and maintenance, with a focus on the kitchen and exterior. Painting and updating the kitchen could significantly increase its value.
Repairs flagged
- Minor Kitchen countertops — Cluttered and could use cleaning
- Minor Bathtub — Peeling paint could be repainted
Value-add opportunities
- Both Paint exterior — Enhances curb appeal and value
- Both Update kitchen countertops — Improves functionality and aesthetics
- Both Replace bathtub — Improves functionality and aesthetics
Renovation cost estimate screening
| Repair item | Severity | Est. cost |
|---|---|---|
| Kitchen countertops · Cluttered and could use cleaning | Minor | $500–3,000 |
| Bathtub · Peeling paint could be repainted | Minor | $500–3,000 |
| Total estimated repair cost · 2 items | $1,000–6,000 |
Value-add ROI direction
- Both Paint exterior — Enhances curb appeal and value ↑
- Both Update kitchen countertops — Improves functionality and aesthetics ↑
- Both Replace bathtub — Improves functionality and aesthetics ↑
ⓘ Cost ranges are severity-bucket heuristics (US national rule-of-thumb). Get contractor quotes + a written scope before underwriting a rehab budget.
Schools (NCES district)
- District
- Arlington School District 38-1
- NCES district ID
- 4603720
- Math proficiency
- 75% ▲ 10.00%
- Reading proficiency
- 65% ▬ 0.00%
- Median HH income
- $51,946
- Composite
- 60.77/100
- National rank
- #1646
- State rank
- #3 of 148 in SD
Livability — Badger
- Score
- 59/100
- State rank
- #260
- US rank
- #19852
Category grades
Schools grade is shown separately in the Schools card above.
Census & demographics
- Census place
- Badger, SD
- Population (ZIP)
- 171
Population outlook (Kingsbury County) Hauer SSP2
- Today (2025)
- 4,819 people
- By 2030
- 4,734 · -1.8%
- By 2040
- 4,597 · -4.6%
- By 2050
- 4,558 · -5.4%
- By 2075
- 5,037 · +4.5%
- By 2100
- 5,863 · +21.7%
Race, ethnicity, and origin ACS 2023
- Neighborhood character
- Predominantly White (98%)
- Race & ethnicity
- White 98% Two or more races 2% Hispanic / Latino 2%
- Common ancestry
- Portuguese 50% English 1% Iranian 1%
- Foreign-born
- 2% · Canada
- Languages at home
- 98% English-only · French/Haitian/Cajun 1% German/W. Germanic 1%
Political lean MEDSL · Kingsbury
- 2024 margin
- Solid R (+43.9) · D 27.1% · R 71.0% · Other 1.9%
- 2008→2024 swing
- -38.2pp toward R · 2008: -5.7pp · 2024: -43.9pp
- All cycles
- 2024: R+43.9 2020: R+39.0 2016: R+38.3 2012: R+13.8 2008: R+5.7
Not yet ingested
- Civics
- —
Market trends
- HPI YoY
- —
- Current HPI
- —
- Rent YoY
- —
- Metro
- —
- State GDP YoY
- ▲ 0.70%
- F500 in state
- 2
Industry mix (Fortune 500 HQ in SD)
| Industry | F500 HQs | Revenue |
|---|---|---|
| Utilities | 1 | $1B |
|
||
Price history
1 event — show timeline
- 2026-05-18 Listed $89,900 NESD
Cash-flow waterfall
monthlySold comps — $/sqft
last 12 mo · ≤1 miLoading sold comps…