344 S 6th St · Mountain View, OK
Flood risk 1/10 · Minimal
- FEMA flood zone
- X (unshaded)
- Chance of flooding over 30 yrs
- 0.0%
- Est. flood insurance / yr
- $507 – $1,088
Fire risk 6/10 · Moderate
- Est. fire insurance / yr
- $2,463 – $4,575
Heat risk 6/10 · Moderate
- Hot days now (above 107°F)
- 7 days/yr
- Hot days in 30 yrs
- 20 days/yr
Wind risk 2/10 · Minimal
- Chance of severe wind over 30 yrs
- 4.0%
Air-quality risk 2/10 · Minimal
- Unhealthy air days now
- 0 days/yr
- Unhealthy air days in 30 yrs
- 1 days/yr
Risk factors via First Street. Map © Google.
Why this score? — see what drove the B+ grade
The composite is a weighted blend of 9 inputs, each scored 0–100. Each bar is that input's sub-score; the figure is the points it added to the 100-point composite (weight × sub-score).
- Cash flow +25.3/30.0
- ARV discount +15.0/15.0
- Appreciation +10.0/10.0
- DSCR +8.3/10.0
- 1% rule +5.3/10.0
- Schools +4.2/10.0
- Livability +3.2/5.0
- Rent growth +2.5/5.0
- Condition / age +2.5/5.0
$119,000
🖨 Deal sheet 📄 Offer letter ✓ Due diligence
Listing remarks
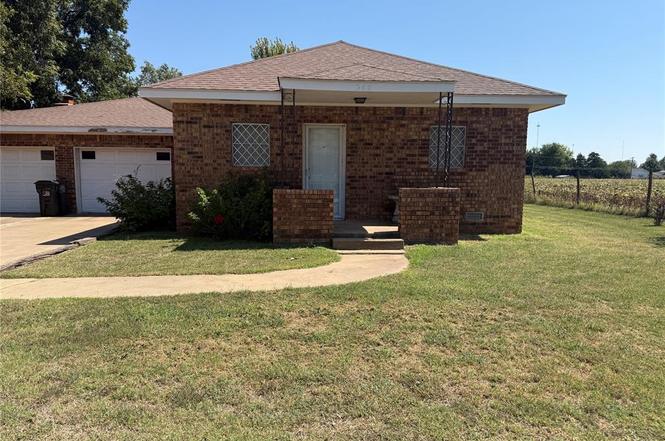
Over 1900 square feet of living space in this large brick home on the south end of 6th street Mountain View. 4 bedrooms and 2 bathrooms there is plenty of space for a large family or lots of guests. This house features two large living rooms, a wood burning fireplace, and attached two car garage. Built on three lots the plus size estate has two outbuilding and a below ground storm shelter and is further enriched but shade bearing trees and a cozy country feel. Property is selling "AS-IS" Seller is offering no concessions to buyer.
Key facts
- Three lots
- Two outbuilding
- Large brick home
Tags
Property features AI
Finance
- Other: Legal addition: Mountain View Ot; Directions available: From Highway 9 go south on 6th Street to the end of the second block; property is on the east side of the road
- Financial info: Not assumable; Loan qualification: Unknown; Current tax amount reported
- HOA & community: No mandatory association dues
Exterior
- Parking: 2-car garage
- Home design: Single family residence; Residential property; One story; Existing property
- Construction: Brick and frame construction; Composition roof; Conventional foundation; Built prior to or in assessor records (existing)
- Exterior features: Covered porch; Outbuildings; Storm shelter (below ground); Homestead exempt
Interior
- Bedrooms: 4 bedrooms (one-level home)
- Bathrooms: 2 full bathrooms
- Interior features: Two living areas; Wood-burning fireplace
Neighborhood map
What this means for you Summary
Snapshot
- This is a 3-bed/2.0-bath single-family listed at $119k.
Deal economics
- At list price, monthly cash flow is $270 ($3k/yr) — positive.
- The deal already cash-flows at list — no discount required.
- Meets the 1% rule at list price ($1k rent vs $119k).
- Recommended offer: $105k (12.0% below list) — sets the bar for market timing.
Location & tenants
- Location reads 63/100 on livability (#199 in OK) — a middle-class / working-renter tenant base. Strengths: cost of living A+, housing A+; Watch: crime F, amenities F, commute F.
- Mountain View-Gotebo (rural): math 50% / reading 45% proficiency, ranked #45 of 513 in OK (top 9%) — families likely to look elsewhere, expect single-tenant / working-renter base with shorter leases.
- Zoned schools: Mountain View-Gotebo Es (math 42% / reading 32%, grade F, #132 of 845 statewide, top 19%, 202 students, 0% FRL); Mountain View-Gotebo Hs (math 10% / reading 24%, grade F, #309 of 447 statewide, top 70%, 66 students, 0% FRL) — zoned schools average 0% FRL vs 54% district-wide (54 pts lower); this property's tenant base skews higher-income than the district average.
- Zoned-school proficiency averages 27% at this address vs 48% district-wide (-20 pts) — the specific schools serving this property underperform the Mountain View-Gotebo average; the district grade overstates school quality for this exact location.
- Market conditions: 3 active listings in the ZIP.
Forward outlook
- In year one you build about $13k of equity ($823 loan paydown + $12k appreciation (10.0% local appreciation)).
- At projected returns (10.0% appreciation + 3.0% rent growth), your $33k cash investment doubles in ~2 years — after that, you're playing with house money.
- By year 3, paydown + projected appreciation supports a ~$32k cash-out refi (75% LTV) — recoverable capital for the next deal without selling this one.
Negotiation context
- It's been on market 212 days — a 12% lower offer ($105k) is reasonable based on typical stale-listing flexibility.
- 2 sale attempts; this cycle's ask has dropped $23k (16%) from the opening price — seller is motivated, your offer sets the floor, not the list.
Risks & watch-outs
- Climate carrying-cost: major wildfire risk; extreme-heat days projected 7→20/yr by 2055 (HVAC capex compounding) — expect insurance premiums to compound above CPI over the hold.
Questions for the listing agent
- It's been on market 212 days. Have you received any prior offers? Is the seller open to a 12% concession, seller financing, or rate buy-down credit?
- Built in 1978 — when were the roof, HVAC, electrical panel, plumbing, and water heater last replaced?
- Why hasn't it sold? Are there any deal-killer items the seller is aware of (foundation, flood, title, zoning, code violations)?
- Is there a deadline driving the sale (1031 exchange, divorce, estate, relocation)? That informs how much negotiation room exists.
- Crime grade is F in this area — have there been break-ins, vandalism, or insurance claims at this property in the last 3 years? What carrier currently insures it and at what premium?
- What's the average days-on-market for RENTAL listings here right now (not sales)? A rising rental-DOM trend means longer vacancies and softer asking-rent achievability than the comps imply.
- What's the recent tenant-quality profile in this submarket — average credit score on applications, eviction rate, late-payment / NSF rate, and stable-employment percentage? A property-management company in the area should have these aggregated.
- How much new for-sale + rental construction is in the pipeline within 1–3 miles? Heavy new supply typically softens prices + rents 12–24 months out; constrained supply supports both.
Investment metrics
- 1% rule
- 1.03% ✓
- Cap rate
- 9.02%
- Cash-on-cash
- 9.73%
- DSCR
- 1.43
- GRM
- 8.1
CMA / ARV
- ARV (on-the-fly)
- $159,408
- Comps found
- 4
Show comp detail 4 sales within ~0.75 mi
| Address | Dist | Beds/Ba | Sqft | Sold | Price | $/sf | Match |
|---|---|---|---|---|---|---|---|
| 425 S 3rd St | 0.18mi | 2/2.0 (-1) | 1,712 (-12%) | 18mo | $80,000 | $47 | 52 |
| 343 N 8th St | 0.45mi | 3/2.0 | 2,197 (+13%) | 8mo | $52,500 | $24 | 51 |
| 610 N 3rd St | 0.62mi | 3/2.0 | 1,882 (-3%) | 22mo | $155,000 | $82 | 47 |
| 544 N 5th St | 0.55mi | 2/2.0 (-1) | 1,755 (-10%) | 19mo | $155,000 | $88 | 37 |
Match score weights: distance 35% · size 25% · config 20% · recency 20%. Top-matched comps best support the ARV.
Projected returns pro-forma
10.0% appreciation · 3.0% rent growth · sell at horizon
- IRR
- 31.4%
- Equity multiple
- 3.46×
- Total profit
- $81,957
- Equity at exit
- $107,205
- IRR
- 27.1%
- Equity multiple
- 7.83×
- Total profit
- $227,706
- Equity at exit
- $231,191
Cash invested: $33,320 (down + closing). Projections, not guarantees.
Landlord ↔ Tenant lean methodology
- Overall (STATE)
- 83 Strongly Landlord-Friendly
- State Oklahoma
- 83 Strongly Landlord-Friendly · R+20
- County
- — inherits STATE
- City
- — inherits STATE
ZIP-level market 73062
- Home prices YoY
- 5.2%
- Active inventory
- 3
- Price-to-rent
- 8.1×
Monthly cashflow live
- Estimated rent
- $1,226 medium interval (Pro) →
- Mortgage (P&I)
- −$624
- Tax from tax record
- −$24 /mo · $293/yr
- Insurance
- −$50
- HOA
- −$0
- Vacancy / Maint / Mgmt
- −$257
- Net cashflow
- $270
Break-even live
UW: 25.0% down · 7.5% · 30yr · 1.5% tax · 5.0% vac · 8.0% maint · 8.0% mgmt
Financing live
Cash to close
- Down payment
- $29,750
- Closing costs
- $3,570
- Reserves months
- —
- Total cash needed
- —
Loan-product check · same deal, 3 products live
Conventional
25% down · 7.5% · 30yr
- Down + closing
- —
- Monthly P&I
- —
- Monthly cashflow
- —
- DSCR
- —
- Eligible?
- —
Personal DTI + credit; lowest rate.
DSCR
20% down · 8.5% · 30yr
- Down + closing
- —
- Monthly P&I
- —
- Monthly cashflow
- —
- DSCR
- —
- Eligible?
- —
No personal income docs; deal must DSCR.
Hard money
10% down · 12.0% · 12mo
- Down + closing
- —
- Monthly P&I
- —
- Monthly cashflow
- —
- DSCR
- —
- Eligible?
- —
Short-term bridge; refi at stabilization.
Listing history 6 events
-
2026-04-29status Pending
-
2026-03-06status Active
-
2026-02-17status Pending
-
2026-01-29price $119,000
-
2025-10-08price $129,900
-
2025-09-12$141,750 Active
ⓘ Source: listings_history table (triggers on properties + properties_extension) + one-shot
backfill from property_details.listing_events for pre-trigger history.
Tax reassessment forecast OK · Resets to sale price
- Current annual tax
- $293 · $24/mo
- Projected year-2 tax
- $1,071 · $89/mo
- Expected delta
- +$778/yr (+$65/mo · 265.5%)
ⓘ Screening estimate from a state-policy table — verify with the county assessor before closing.
Climate risk First Street
- Flood 1/10 Low FEMA zone X (unshaded) · 0% chance over 30 yrs
- Wildfire 6/10 Major
- Heat 6/10 Major 7 d/yr ≥107°F today · 20 d/yr by 30 yrs out
- Wind 2/10 Low 4% chance of damaging wind over 30 yrs
- Air quality 2/10 Low 0 unhealthy d/yr today · 1 by 30 yrs out
Nearby sold comps map
Loading sold comps map…
Walkable amenities ~0.75 mi
Loading nearby amenities…
Taxation est. · year 1
- Rental income
- $14,706
- − Mortgage interest
- −$6,666
- − Property taxes
- −$293
- − Insurance
- −$595
- − Repairs & maintenance
- −$1,177
- − Management
- −$1,177
- − Depreciation
- −$3,462
- Taxable income
- $1,338
- Est. tax owed @ 24.0%
- −$321
- After-tax cash flow
- $2,920/yr
For passive investors: Depreciation is non-cash, so a rental often shows a tax loss while cash-flowing — sheltering income. Rental losses are passive: they offset passive income freely, and up to $25,000/yr can offset ordinary (W-2) income if you actively participate and your MAGI is under $100k (phasing out to $0 by $150k); unused losses carry forward. On sale, claimed depreciation is recaptured at up to 25%, and gains may owe capital-gains tax (a 1031 exchange can defer both). Figures are a year-1 estimate at your 24.0% rate — not tax advice; consult a CPA.
Schools (NCES district)
- District
- Mountain View-Gotebo
- NCES district ID
- 4029886
- Math proficiency
- 50% ▲ 20.00%
- Reading proficiency
- 45% ▲ 5.00%
- Median HH income
- $41,057
- Composite
- 41.99/100
- National rank
- #7086
- State rank
- #45 of 513 in OK
Livability — Mountain View
- Score
- 63/100
- State rank
- #199
- US rank
- #15051
Category grades
Schools grade is shown separately in the Schools card above.
Census & demographics
- Census place
- Mountain View, OK
- Population (ZIP)
- 1,077
Population outlook (Kiowa County) Hauer SSP2
- Today (2025)
- 8,842 people
- By 2030
- 8,733 · -1.2%
- By 2040
- 8,641 · -2.3%
- By 2050
- 8,758 · -1.0%
- By 2075
- 9,894 · +11.9%
- By 2100
- 11,194 · +26.6%
Race, ethnicity, and origin ACS 2023
- Neighborhood character
- Predominantly White (79%)
- Race & ethnicity
- White 79% Native American 15% Hispanic / Latino 3% Two or more races 3%
- Common ancestry
- Lithuanian 2% Portuguese 2% Slovak 1%
- Foreign-born
- 0%
- Languages at home
- 98% English-only · German/W. Germanic 1%
Political lean MEDSL · Kiowa
- 2024 margin
- Solid R (+58.3) · D 20.1% · R 78.4% · Other 1.6%
- 2008→2024 swing
- -23.5pp toward R · 2008: -34.8pp · 2024: -58.3pp
- All cycles
- 2024: R+58.3 2020: R+57.6 2016: R+52.4 2012: R+35.4 2008: R+34.8
Not yet ingested
- Civics
- —
Market trends
- HPI YoY
- ▲ 12.99%
- Current HPI
- 262.3324
- Rent YoY
- —
- Metro
- —
- State GDP YoY
- ▲ 1.55%
- F500 in state
- 6
Industry mix (Fortune 500 HQ in OK)
| Industry | F500 HQs | Revenue |
|---|---|---|
| Energy | 3 | $48B |
|
||
Price history
-16.0% since first listed6 events — show timeline
- 2026-04-29 Pending — MLSOK
- 2026-03-06 Relisted — MLSOK
- 2026-02-17 Pending — MLSOK
- 2026-01-29 Price Changed $119,000 MLSOK
- 2025-10-08 Price Changed $129,900 MLSOK
- 2025-09-12 Listed $141,750 MLSOK
Property tax history
+2.5%/yrLatest (2025): $293 · +1.0% YoY. Source: county tax records.
Cash-flow waterfall
monthlySold comps — $/sqft
last 12 mo · ≤1 miLoading sold comps…