TBD Ledbetter Holw · Theodosia, MO
Flood risk 1/10 · Minimal
- FEMA flood zone
- X (unshaded)
- Chance of flooding over 30 yrs
- 0.0%
- Est. flood insurance / yr
- $507 – $1,088
Fire risk 6/10 · Moderate
- Est. fire insurance / yr
- $1,054 – $1,958
Heat risk 4/10 · Minor
- Hot days now (above 106°F)
- 7 days/yr
- Hot days in 30 yrs
- 20 days/yr
Wind risk 2/10 · Minimal
- Chance of severe wind over 30 yrs
- 1.0%
Air-quality risk 2/10 · Minimal
- Unhealthy air days now
- 0 days/yr
- Unhealthy air days in 30 yrs
- 1 days/yr
Risk factors via First Street. Map © Google.
Why this score? — see what drove the D- grade
The composite is a weighted blend of 9 inputs, each scored 0–100. Each bar is that input's sub-score; the figure is the points it added to the 100-point composite (weight × sub-score).
- ARV discount +15.0/15.0
- Appreciation +8.3/10.0
- Cash flow +5.4/30.0
- Livability +2.9/5.0
- Rent growth +2.5/5.0
- Condition / age +2.5/5.0
- Schools +2.0/10.0
- 1% rule +1.0/10.0
- DSCR +0.0/10.0
$129,900
🖨 Deal sheet 📄 Offer letter ✓ Due diligence
Listing remarks MLS
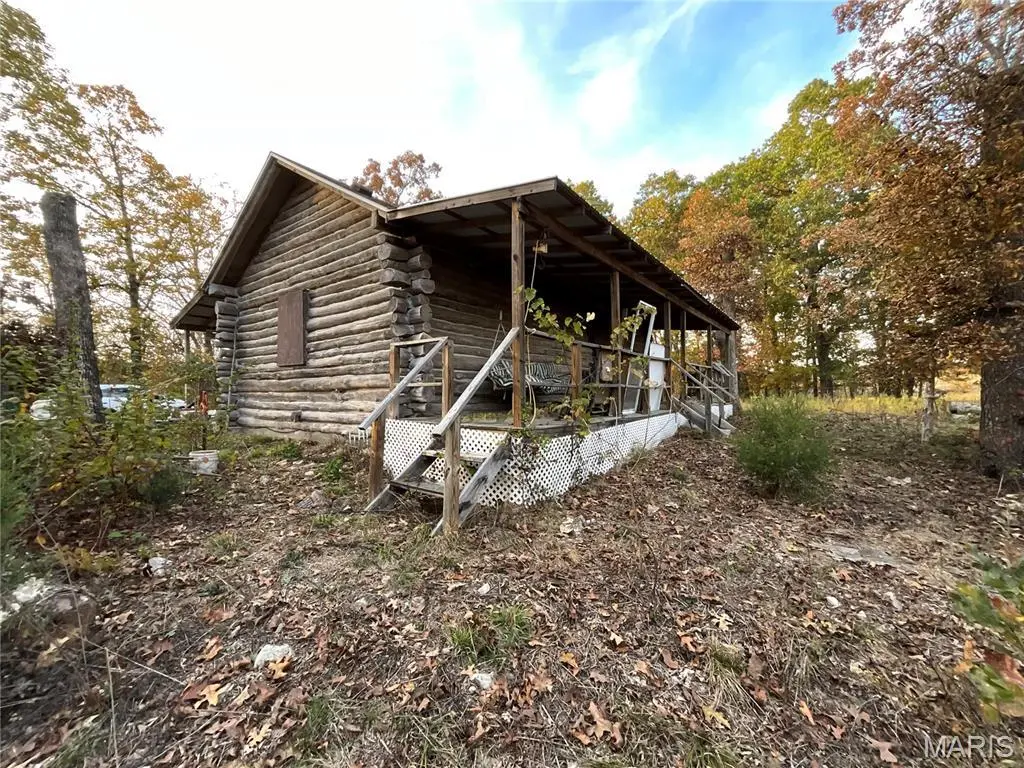
Handmade Log Home with trees off the property on 16.4 acres. 220-volt electric, well water, wood stove for heating. Open concept with 2 lofts for extra space. Deeded restriction - No mobile homes may be placed on the property. Appliances include - refrigerator, microwave, oven/range.
Key facts
- Handmade log home
- 16.4 acres
- 220 volt electric
Tags
Neighborhood map
What this means for you Summary
Snapshot
- This is a 1-bed/1.5-bath single-family listed at $130k.
Deal economics
- At list price, monthly cash flow is $-284 ($-3k/yr) — negative.
- To cash-flow at today's rent, offer at most $89k (31.6% below list).
- To meet the 1% rule (rent ≥ 1% of price), the offer needs to be $78k (40.2% below list).
- Recommended offer: $78k (40.2% below list) — sets the bar for 1% rule.
- Cap rate 3.7% vs local median 2.1% in Theodosia — top-decile yield for the area; either an underpriced asset or a hidden risk that comps aren't pricing in. Stress-test before assuming the spread holds.
Location & tenants
- Location reads 57/100 on livability (#649 in MO) — a working-class tenant base; expect higher turnover. Strengths: cost of living A+, housing A-; Watch: health & safety C-, schools F, crime F.
- Lutie R-VI (rural): math 20% / reading 20% proficiency, ranked #510 of 535 in MO (top 95%) — low school quality limits family demand, transient renter base, plan for 1-2y turnover; 66% free/reduced lunch — lower-income household profile, screen leases tightly.
- Market conditions: 78 active listings in the ZIP.
Forward outlook
- In year one you build about $9k of equity ($898 loan paydown + $8k appreciation (6.5% local appreciation)).
- Ozark County population projected at -26% by 2050 — secular population decline; favor cash flow + early exit over multi-decade hold.
- By year 4, paydown + projected appreciation supports a ~$32k cash-out refi (75% LTV) — recoverable capital for the next deal without selling this one.
Negotiation context
- It's been on market 178 days — a 12% lower offer ($114k) is reasonable based on typical stale-listing flexibility.
- 2 sale attempts with the ask held roughly flat each time — persistent listings suggest the price (not the market) is what's stuck; bring a comps-based counter.
Risks & watch-outs
- Climate carrying-cost: major wildfire risk — expect insurance premiums to compound above CPI over the hold.
Questions for the listing agent
- What do current leases actually rent for vs. the listed asking? Can we see a recent rent roll and the last 12 months of T-12 income?
- It's been on market 178 days. Have you received any prior offers? Is the seller open to a 40% concession, seller financing, or rate buy-down credit?
- Why hasn't it sold? Are there any deal-killer items the seller is aware of (foundation, flood, title, zoning, code violations)?
- Is there a deadline driving the sale (1031 exchange, divorce, estate, relocation)? That informs how much negotiation room exists.
- Schools are F-rated, which usually means shorter tenancies and higher turnover. Who's the typical renter profile here, and what's been the actual vacancy rate?
- Crime grade is F in this area — have there been break-ins, vandalism, or insurance claims at this property in the last 3 years? What carrier currently insures it and at what premium?
- The area grade is low — what's the realistic commute time and amenity access for the typical tenant pool here? Any planned neighborhood developments (good or bad) we should know about?
- What's the average days-on-market for RENTAL listings here right now (not sales)? A rising rental-DOM trend means longer vacancies and softer asking-rent achievability than the comps imply.
- What's the recent tenant-quality profile in this submarket — average credit score on applications, eviction rate, late-payment / NSF rate, and stable-employment percentage? A property-management company in the area should have these aggregated.
- How much new for-sale + rental construction is in the pipeline within 1–3 miles? Heavy new supply typically softens prices + rents 12–24 months out; constrained supply supports both.
Investment metrics
- 1% rule
- 0.60% ✗
- Cap rate
- 3.67%
- Cash-on-cash
- -9.36%
- DSCR
- 0.58
- GRM
- 13.9
CMA / ARV
- ARV (median comp)
- $164,500
- List price
- $129,900
- Delta
- -21.03%
- Verdict
- UNDERPRICED
- Comps
- 1 within 2.0 mi
Projected returns pro-forma
6.51% appreciation · 3.0% rent growth · sell at horizon
- IRR
- 9.2%
- Equity multiple
- 1.64×
- Total profit
- $23,440
- Equity at exit
- $85,912
- IRR
- 10.6%
- Equity multiple
- 3.26×
- Total profit
- $82,191
- Equity at exit
- $159,605
Cash invested: $36,372 (down + closing). Projections, not guarantees.
Landlord ↔ Tenant lean methodology
- Overall (STATE)
- 81 Strongly Landlord-Friendly
- State Missouri
- 81 Strongly Landlord-Friendly · R+10
- County
- — inherits STATE
- City
- — inherits STATE
ZIP-level market 65761
- Home prices YoY
- 3.0%
- Active inventory
- 78
- Price-to-rent
- 13.9×
Monthly cashflow live
- Estimated rent
- $777 medium interval (Pro) →
- Mortgage (P&I)
- −$681
- Tax est. 1.5%
- −$162 /mo · $1,948/yr
- Insurance
- −$54
- HOA
- −$0
- Vacancy / Maint / Mgmt
- −$163
- Net cashflow
- $-284
Break-even live
UW: 25.0% down · 7.5% · 30yr · 1.5% tax · 5.0% vac · 8.0% maint · 8.0% mgmt
Financing live
Cash to close
- Down payment
- $32,475
- Closing costs
- $3,897
- Reserves months
- —
- Total cash needed
- —
Loan-product check · same deal, 3 products live
Conventional
25% down · 7.5% · 30yr
- Down + closing
- —
- Monthly P&I
- —
- Monthly cashflow
- —
- DSCR
- —
- Eligible?
- —
Personal DTI + credit; lowest rate.
DSCR
20% down · 8.5% · 30yr
- Down + closing
- —
- Monthly P&I
- —
- Monthly cashflow
- —
- DSCR
- —
- Eligible?
- —
No personal income docs; deal must DSCR.
Hard money
10% down · 12.0% · 12mo
- Down + closing
- —
- Monthly P&I
- —
- Monthly cashflow
- —
- DSCR
- —
- Eligible?
- —
Short-term bridge; refi at stabilization.
Listing history 17 events
-
2026-06-18days on market $129,900 Active 178 DOM
-
2026-06-17days on market $129,900 Active 177 DOM
-
2026-06-16days on market $129,900 Active 176 DOM
-
2026-06-15days on market $129,900 Active 175 DOM
-
2026-06-13days on market $129,900 Active 173 DOM
-
2026-06-12days on market $129,900 Active 172 DOM
-
2026-06-09days on market $129,900 Active 169 DOM
-
2026-06-08days on market $129,900 Active 168 DOM
-
2026-06-07days on market $129,900 Active 167 DOM
-
2026-06-07days on market $129,900 Active 166 DOM
-
2026-06-04days on market $129,900 Active 163 DOM
-
2026-06-02days on market $129,900 Active 162 DOM
-
2026-06-01days on market $129,900 Active 161 DOM
-
2026-05-31days on market $129,900 Active 160 DOM
-
2026-02-08status Active 284-char remark
Show marketing remark (284 chars)
Handmade Log Home with trees off the property on 16.4 acres. 220-volt electric, well water, wood stove for heating. Open concept with 2 lofts for extra space. Deeded restriction - No mobile homes may be placed on the property. Appliances include - refrigerator, microwave, oven/range.
-
2026-01-19status Pending 284-char remark
Show marketing remark (284 chars)
Handmade Log Home with trees off the property on 16.4 acres. 220-volt electric, well water, wood stove for heating. Open concept with 2 lofts for extra space. Deeded restriction - No mobile homes may be placed on the property. Appliances include - refrigerator, microwave, oven/range.
-
2025-12-03$129,900 Active 284-char remark
Show marketing remark (284 chars)
Handmade Log Home with trees off the property on 16.4 acres. 220-volt electric, well water, wood stove for heating. Open concept with 2 lofts for extra space. Deeded restriction - No mobile homes may be placed on the property. Appliances include - refrigerator, microwave, oven/range.
ⓘ Source: listings_history table (triggers on properties + properties_extension) + one-shot
backfill from property_details.listing_events for pre-trigger history.
Climate risk First Street
- Flood 1/10 Low FEMA zone X (unshaded) · 0% chance over 30 yrs
- Wildfire 6/10 Major
- Heat 4/10 Moderate 7 d/yr ≥106°F today · 20 d/yr by 30 yrs out
- Wind 2/10 Low 100% chance of damaging wind over 30 yrs
- Air quality 2/10 Low 0 unhealthy d/yr today · 1 by 30 yrs out
Nearby sold comps map
Loading sold comps map…
Walkable amenities ~0.75 mi
Loading nearby amenities…
Taxation est. · year 1
- Rental income
- $9,326
- − Mortgage interest
- −$7,276
- − Property taxes
- −$1,948
- − Insurance
- −$650
- − Repairs & maintenance
- −$746
- − Management
- −$746
- − Depreciation
- −$3,779
- Taxable loss
- −$5,820
- Est. tax savings @ 24.0%
- +$1,397
- After-tax cash flow
- $-2,008/yr
For passive investors: Depreciation is non-cash, so a rental often shows a tax loss while cash-flowing — sheltering income. Rental losses are passive: they offset passive income freely, and up to $25,000/yr can offset ordinary (W-2) income if you actively participate and your MAGI is under $100k (phasing out to $0 by $150k); unused losses carry forward. On sale, claimed depreciation is recaptured at up to 25%, and gains may owe capital-gains tax (a 1031 exchange can defer both). Figures are a year-1 estimate at your 24.0% rate — not tax advice; consult a CPA.
Schools (NCES district)
- District
- Lutie R-VI
- NCES district ID
- 2923400
- Math proficiency
- 20% ▼ -15.00%
- Reading proficiency
- 20% ▼ -20.00%
- Median HH income
- $35,359
- Composite
- 19.76/100
- National rank
- #13904
- State rank
- #510 of 535 in MO
Livability — Theodosia
- Score
- 57/100
- State rank
- #649
- US rank
- #21869
Category grades
Schools grade is shown separately in the Schools card above.
Census & demographics
- Population (ZIP)
- 1,383
Population outlook (Ozark County) Hauer SSP2
- Today (2025)
- 8,561 people
- By 2030
- 8,040 · -6.1%
- By 2040
- 7,069 · -17.4%
- By 2050
- 6,310 · -26.3%
- By 2075
- 5,095 · -40.5%
- By 2100
- 4,112 · -52.0%
Race, ethnicity, and origin ACS 2023
- Neighborhood character
- Predominantly White (94%)
- Race & ethnicity
- White 94% Two or more races 5%
- Common ancestry
- Romanian 2% Portuguese 1% Subsaharan African 1%
- Foreign-born
- 1%
- Languages at home
- 99% English-only · Russian/Polish/Slavic 1%
Political lean MEDSL · Ozark
- 2024 margin
- Solid R (+70.0) · D 14.6% · R 84.6%
- 2008→2024 swing
- -43.2pp toward R · 2008: -26.8pp · 2024: -70.0pp
- All cycles
- 2024: R+70.0 2020: R+68.1 2016: R+64.8 2012: R+40.9 2008: R+26.8
Not yet ingested
- Civics
- —
Market trends
- HPI YoY
- ▲ 6.51%
- Current HPI
- 223.1575
- Rent YoY
- —
- Metro
- —
- State GDP YoY
- ▲ 1.84%
- F500 in state
- 20
Industry mix (Fortune 500 HQ in MO)
| Industry | F500 HQs | Revenue |
|---|---|---|
| Healthcare | 1 | $163B |
|
||
| Insurance | 1 | $21B |
|
||
| Industrial Technology | 1 | $17B |
|
||
| Retail | 1 | $16B |
|
||
| Industrial Distribution | 1 | $10B |
|
||
| Utilities | 1 | $9B |
|
||
Price history
3 events — show timeline
- 2026-02-08 Relisted — MARIS as Distributed by MLS Grid
- 2026-01-19 Pending — MARIS as Distributed by MLS Grid
- 2025-12-03 Listed $129,900 MARIS as Distributed by MLS Grid
Cash-flow waterfall
monthlySold comps — $/sqft
last 12 mo · ≤1 miLoading sold comps…