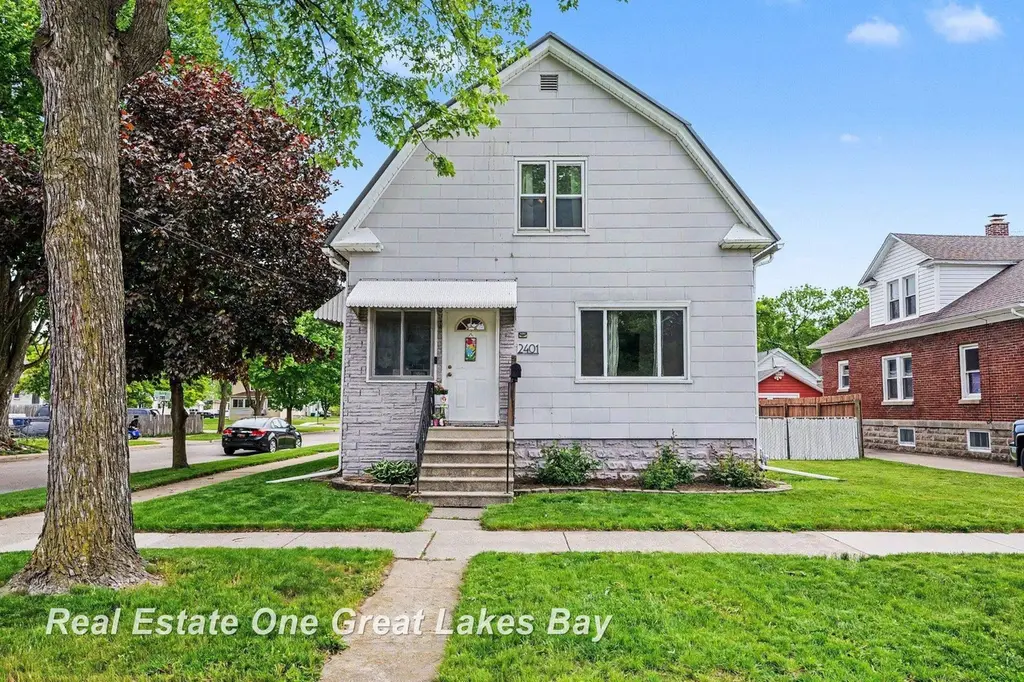
2401 S Jefferson St · Bay City, MI
Flood risk 1/10 · Minimal
- FEMA flood zone
- X (unshaded)
- Chance of flooding over 30 yrs
- 0.0%
- Est. flood insurance / yr
- $473 – $860
Fire risk 1/10 · Minimal
- Est. fire insurance / yr
- $784 – $1,456
Heat risk 3/10 · Minor
- Hot days now (above 97°F)
- 7 days/yr
- Hot days in 30 yrs
- 14 days/yr
Wind risk 1/10 · Minimal
- Chance of severe wind over 30 yrs
- —
Air-quality risk 2/10 · Minimal
- Unhealthy air days now
- 1 days/yr
- Unhealthy air days in 30 yrs
- 2 days/yr
Risk factors via First Street. Map © Google.
Why this score? — see what drove the D+ grade
The composite is a weighted blend of 9 inputs, each scored 0–100. Each bar is that input's sub-score; the figure is the points it added to the 100-point composite (weight × sub-score).
- Cash flow +14.5/30.0
- ARV discount +12.8/15.0
- DSCR +4.4/10.0
- 1% rule +3.4/10.0
- Livability +3.4/5.0
- Schools +2.8/10.0
- Rent growth +2.5/5.0
- Condition / age +2.5/5.0
- Appreciation +0.0/10.0
$149,000
🖨 Deal sheet (PDF) 📄 Offer letter ✓ Due diligence
Listing remarks MLS
Welcome home to this beautifully updated farmhouse full of charm and character! From the gorgeous original wood floors and rich wood trim to the updated kitchen with newer stainless steel appliances, this home blends classic charm with modern updates in all the right ways. You’ll love the large bedrooms with spacious closets and all the extra room to spread out. Downstairs offers the perfect bonus space for entertaining, movie nights, hobbies, or hanging out, plus a half bath, laundry room, and plenty of storage. Step outside to a fenced-in backyard, detached garage, and extra workshop/storage space perfect for projects, toys, or all the things life collects. Added peace of mind with a newer roof and water heater, all while being conveniently close to schools, parks, and restaurants. This one truly feels like home!
Key facts
- Original wood floors
- Updated kitchen
- Bonus space
Tags
Property features AI
Finance
- Other: Located in MARY ANN MILLERS ADD subdivision (cross streets: 34th / 35th)
- HOA & community: Homeowners association present
Exterior
- Parking: Detached garage with garage door opener; Assigned paved parking; Approximately 1.5 garage spaces
- Utilities: Public water; Public sewer
- Home design: Single family residence; Two stories; Stone and wood siding exterior
- Construction: Shingle roof not specified; Stone and wood siding construction
- Exterior features: Fenced yard; City lot on a corner; Paved road access (publicly maintained)
Interior
- Kitchen: Dishwasher; Oven; Range; Refrigerator
- Flooring: Hardwood
- Bathrooms: 1 full bathroom; 1 half bathroom
- Heating & cooling: Forced air heating (natural gas); Ceiling fan(s); Wall/window cooling unit(s)
- Interior features: High ceilings; Partially finished basement
- Laundry & utility: Washer; Dryer; Gas water heater
Neighborhood map
What this means for you Summary
Snapshot
- This is a 3-bed/1.0-bath single-family listed at $149k.
Deal economics
- At list price, monthly cash flow is $34 ($407/yr) — positive.
- The deal already cash-flows at list — no discount required.
- To meet the 1% rule (rent ≥ 1% of price), the offer needs to be $125k (15.8% below list).
- Recommended offer: $125k (15.8% below list) — sets the bar for 1% rule.
Location & tenants
- Location reads 68/100 on livability (#360 in MI) — a middle-class / working-renter tenant base. Strengths: cost of living A+, housing A+, health & safety A+; Watch: amenities D, crime F, commute F.
- Bay City School District (urban): math 27% / reading 40% proficiency, ranked #317 of 540 in MI (top 59%) — families likely to look elsewhere, expect single-tenant / working-renter base with shorter leases.
- Zoned schools: Macgregor Elementary School (math 12% / reading 12%, grade F, #1,217 of 1,397 statewide, top 88%, 313 students, 92% FRL); Handy Middle School (math 17% / reading 33%, grade F, #387 of 493 statewide, top 78%, 685 students, 79% FRL); Bay City Central High School (math 22% / reading 47%, grade F, #372 of 713 statewide, top 56%, 1,033 students, 64% FRL) — zoned schools average 79% FRL vs 44% district-wide (34 pts higher); higher-poverty schools than district average — tighter screening recommended.
- Market conditions: 150 active listings in the ZIP; 1 comparable units currently listed for rent nearby; 39 units permitted in Bay County in 2024 (0 in 5+ unit buildings).
Forward outlook
- Local home prices are declining (-3.0%/yr); year-one equity from $1k of loan paydown is wiped out by about $4k of value loss. Plan a longer hold.
- Bay County population projected at -21% by 2050 — secular population decline; favor cash flow + early exit over multi-decade hold.
Negotiation context
- Only 3 days on market — expect competitive offers; lowballing is unlikely to land.
- 4 sale attempts since 19y ago with the ask held roughly flat each time — persistent listings suggest the price (not the market) is what's stuck; bring a comps-based counter.
- Current owner paid $70k; list at $149k implies a 113% gain — meaningful room to come down on a strong offer.
Risks & watch-outs
- Watch-outs: built in 1910 — expect roof / HVAC / electrical / plumbing capex.
Questions for the listing agent
- Built in 1910 — when were the roof, HVAC, electrical panel, plumbing, and water heater last replaced?
- Is there a deadline driving the sale (1031 exchange, divorce, estate, relocation)? That informs how much negotiation room exists.
- Schools are D-rated, which usually means shorter tenancies and higher turnover. Who's the typical renter profile here, and what's been the actual vacancy rate?
- Crime grade is F in this area — have there been break-ins, vandalism, or insurance claims at this property in the last 3 years? What carrier currently insures it and at what premium?
- The area grade is low — what's the realistic commute time and amenity access for the typical tenant pool here? Any planned neighborhood developments (good or bad) we should know about?
- What's the average days-on-market for RENTAL listings here right now (not sales)? A rising rental-DOM trend means longer vacancies and softer asking-rent achievability than the comps imply.
- What's the recent tenant-quality profile in this submarket — average credit score on applications, eviction rate, late-payment / NSF rate, and stable-employment percentage? A property-management company in the area should have these aggregated.
- How much new for-sale + rental construction is in the pipeline within 1–3 miles? Heavy new supply typically softens prices + rents 12–24 months out; constrained supply supports both.
Investment metrics
- 1% rule
- 0.84% ✗
- Cap rate
- 6.57%
- Cash-on-cash
- 0.97%
- DSCR
- 1.04
- GRM
- 9.9
CMA / ARV
- ARV (on-the-fly)
- $168,714
- Comps found
- 12
Show comp detail 12 sales within ~0.75 mi
| Address | Dist | Beds/Ba | Sqft | Sold | Price | $/sf | Match |
|---|---|---|---|---|---|---|---|
| 1423 Stanton St | 0.28mi | 3/1.0 | 1,310 (-9%) | 2mo | $113,650 | $87 | 70 |
| 1611 S Grant St | 0.52mi | 3/2.0 | 1,426 (-1%) | 2mo | $112,500 | $79 | 68 |
| 1707 S Monroe St | 0.43mi | 4/1.0 (+1) | 1,390 (-4%) | 2mo | $151,000 | $109 | 68 |
| 1808 S Farragut St | 0.45mi | 3/2.0 | 1,498 (+4%) | 1mo | $210,000 | $140 | 67 |
| 2011 S Sherman St | 0.44mi | 3/1.5 | 1,344 (-7%) | 1mo | $169,600 | $126 | 65 |
| 1615 S Jackson St | 0.49mi | 3/2.0 | 1,511 (+5%) | 4mo | $179,900 | $119 | 62 |
| 2534 Claude Dr | 0.55mi | 3/1.5 | 1,364 (-5%) | 6mo | $160,000 | $117 | 58 |
| 1617 Broadway St | 0.40mi | 3/1.0 | 1,267 (-12%) | 7mo | $70,000 | $55 | 55 |
| 1913 Michigan Ave | 0.41mi | 4/1.5 (+1) | 1,638 (+14%) | 3mo | $165,000 | $101 | 49 |
| 907 Michigan Ave | 0.41mi | 2/1.5 (-1) | 1,252 (-13%) | 3mo | $150,000 | $120 | 49 |
| 1910 33rd St | 0.44mi | 4/2.0 (+1) | 1,256 (-13%) | 5mo | $170,100 | $135 | 45 |
| 1507 S Van Buren St | 0.59mi | 4/2.0 (+1) | 1,566 (+9%) | 6mo | $141,000 | $90 | 45 |
Match score weights: distance 35% · size 25% · config 20% · recency 20%. Top-matched comps best support the ARV.
Projected returns pro-forma
-3.0% appreciation · 3.0% rent growth · sell at horizon
- IRR
- -14.8%
- Equity multiple
- 0.47×
- Total profit
- $-22,012
- Equity at exit
- $22,216
- IRR
- -6.1%
- Equity multiple
- 0.60×
- Total profit
- $-16,494
- Equity at exit
- $12,883
Cash invested: $41,720 (down + closing). Projections, not guarantees.
Landlord ↔ Tenant lean methodology
- Overall (STATE)
- 62 Landlord-Friendly
- State Michigan
- 62 Landlord-Friendly · EVEN
- County
- — inherits STATE
- City
- — inherits STATE
ZIP-level market 48708
- Home prices YoY
- -30.9%
- Active inventory
- 150
- Price-to-rent
- 9.9×
Monthly cashflow live
- Estimated rent
- $1,254 medium interval (Pro) →
- Mortgage (P&I)
- −$781
- Tax from tax record
- −$113 /mo · $1,362/yr
- Insurance
- −$62
- HOA
- −$0
- Vacancy / Maint / Mgmt
- −$263
- Net cashflow
- $34
Break-even live
Sensitivity live
| Price | -10% $118 | -5% $76 | +0% $34 | +5% $-8 | +10% $-50 |
|---|---|---|---|---|---|
| Rent | -10% $-65 | -5% $-16 | +0% $34 | +5% $83 | +10% $133 |
| Rate | -1.0pp $109 | -0.5pp $72 | base $34 | +0.5pp $-5 | +1.0pp $-44 |
UW: 25.0% down · 7.5% · 30yr · 1.5% tax · 5.0% vac · 8.0% maint · 8.0% mgmt
Financing live
Cash to close
- Down payment
- $37,250
- Closing costs
- $4,470
- Reserves months
- —
- Total cash needed
- —
Loan-product check · same deal, 3 products live
Conventional
25% down · 7.5% · 30yr
- Down + closing
- —
- Monthly P&I
- —
- Monthly cashflow
- —
- DSCR
- —
- Eligible?
- —
Personal DTI + credit; lowest rate.
DSCR
20% down · 8.5% · 30yr
- Down + closing
- —
- Monthly P&I
- —
- Monthly cashflow
- —
- DSCR
- —
- Eligible?
- —
No personal income docs; deal must DSCR.
Hard money
10% down · 12.0% · 12mo
- Down + closing
- —
- Monthly P&I
- —
- Monthly cashflow
- —
- DSCR
- —
- Eligible?
- —
Short-term bridge; refi at stabilization.
Rent comps 1 comps
| Address | Beds | Baths | Sqft | Rent | $/sqft | DOM | Units | Dist |
|---|---|---|---|---|---|---|---|---|
| 600 18th St Bay City, MI | 2.0 | 1.0 | 1000 | $950 | $0.95 | 45d | 1 | 1.10mi |
Listing history 7 events
-
2026-05-26$149,000 Active
Show marketing remark (832 chars)
Welcome home to this beautifully updated farmhouse full of charm and character! From the gorgeous original wood floors and rich wood trim to the updated kitchen with newer stainless steel appliances, this home blends classic charm with modern updates in all the right ways. You’ll love the large bedrooms with spacious closets and all the extra room to spread out. Downstairs offers the perfect bonus space for entertaining, movie nights, hobbies, or hanging out, plus a half bath, laundry room, and plenty of storage. Step outside to a fenced-in backyard, detached garage, and extra workshop/storage space perfect for projects, toys, or all the things life collects. Added peace of mind with a newer roof and water heater, all while being conveniently close to schools, parks, and restaurants. This one truly feels like home!
-
2026-05-26$149,000 Active 832-char remark
Show marketing remark (832 chars)
Welcome home to this beautifully updated farmhouse full of charm and character! From the gorgeous original wood floors and rich wood trim to the updated kitchen with newer stainless steel appliances, this home blends classic charm with modern updates in all the right ways. You’ll love the large bedrooms with spacious closets and all the extra room to spread out. Downstairs offers the perfect bonus space for entertaining, movie nights, hobbies, or hanging out, plus a half bath, laundry room, and plenty of storage. Step outside to a fenced-in backyard, detached garage, and extra workshop/storage space perfect for projects, toys, or all the things life collects. Added peace of mind with a newer roof and water heater, all while being conveniently close to schools, parks, and restaurants. This one truly feels like home!
-
2022-11-14soldstatus $70,000
-
2018-04-25historical
-
2009-07-01soldstatus $24,900
-
2009-04-13$24,900
-
2007-03-22$79,500
ⓘ Source: listings_history table (triggers on properties + properties_extension) + one-shot
backfill from property_details.listing_events for pre-trigger history.
Tax reassessment forecast MI · Partial reset (capped growth)
- Current annual tax
- $1,362 · $113/mo
- Projected year-2 tax
- $1,828 · $152/mo
- Expected delta
- +$466/yr (+$39/mo · 34.3%)
ⓘ Screening estimate from a state-policy table — verify with the county assessor before closing.
Climate risk First Street
- Flood 1/10 Low FEMA zone X (unshaded) · 0% chance over 30 yrs
- Wildfire 1/10 Low
- Heat 3/10 Moderate 7 d/yr ≥97°F today · 14 d/yr by 30 yrs out
- Wind 1/10 Low
- Air quality 2/10 Low 1 unhealthy d/yr today · 2 by 30 yrs out
Nearby sold comps map
Loading sold comps map…
Walkable amenities ~0.75 mi
Loading nearby amenities…
Taxation est. · year 1
- Rental income
- $15,050
- − Mortgage interest
- −$8,346
- − Property taxes
- −$1,362
- − Insurance
- −$745
- − Repairs & maintenance
- −$1,204
- − Management
- −$1,204
- − Depreciation
- −$4,335
- Taxable loss
- −$2,145
- Est. tax savings @ 24.0%
- +$515
- After-tax cash flow
- $921/yr
For passive investors: Depreciation is non-cash, so a rental often shows a tax loss while cash-flowing — sheltering income. Rental losses are passive: they offset passive income freely, and up to $25,000/yr can offset ordinary (W-2) income if you actively participate and your MAGI is under $100k (phasing out to $0 by $150k); unused losses carry forward. On sale, claimed depreciation is recaptured at up to 25%, and gains may owe capital-gains tax (a 1031 exchange can defer both). Figures are a year-1 estimate at your 24.0% rate — not tax advice; consult a CPA.
Schools (NCES district)
- District
- Bay City School District
- NCES district ID
- 2604260
- Math proficiency
- 27% ▼ -8.00%
- Reading proficiency
- 40% ▼ -4.00%
- Median HH income
- $43,833
- Composite
- 28.47/100
- National rank
- #6743
- State rank
- #317 of 540 in MI
Livability — Bay City
- Score
- 68/100
- State rank
- #360
- US rank
- #8912
Category grades
Schools grade is shown separately in the Schools card above.
Census & demographics
- Census place
- Bay City, MI
- County
- Bay County · 36,975 people
- City population
- 25,635
- Metro
- Bay City, MI
- Population (ZIP)
- 25,635
- Household income
- $50,518
- Rent vs Own
- Severe rent burden
- 528.0
Population outlook (Bay County) Hauer SSP2
- Today (2025)
- 101,476 people
- By 2030
- 98,152 · -3.3%
- By 2040
- 89,711 · -11.6%
- By 2050
- 80,614 · -20.6%
- By 2075
- 60,544 · -40.3%
- By 2100
- 41,603 · -59.0%
Race, ethnicity, and origin ACS 2023
- Neighborhood character
- Predominantly White (81%)
- Race & ethnicity
- White 81% Hispanic / Latino 11% Two or more races 10% Black 3%
- Hispanic origin (detail)
- Mexican 9%
- Common ancestry
- Romanian 17% Lithuanian 7% Slovak 2%
- Foreign-born
- 2% · Canada, South Korea
- Languages at home
- 96% English-only · Spanish 2% German/W. Germanic 1%
Political lean MEDSL · Bay
- 2024 margin
- R (+14.7) · D 42.0% · R 56.7% · Other 1.3%
- 2008→2024 swing
- -30.0pp toward R · 2008: 15.3pp · 2024: -14.7pp
- All cycles
- 2024: R+14.7 2020: R+11.6 2016: R+12.6 2012: D+6.0 2008: D+15.3
Not yet ingested
- Civics
- —
Market trends
- HPI YoY
- ▼ -82.21%
- Current HPI
- 183.5774
- Rent YoY
- —
- Metro
- Bay City, MI
- State GDP YoY
- ▲ 1.37%
- F500 in state
- 28
Industry mix (Fortune 500 HQ in MI)
| Industry | F500 HQs | Revenue |
|---|---|---|
| Automotive Parts | 3 | $48B |
|
||
| Automotive | 2 | $372B |
|
||
| Chemicals | 1 | $45B |
|
||
| Automotive Retail | 1 | $29B |
|
||
| Healthcare / Medical Devices | 1 | $23B |
|
||
| Automotive Technology | 1 | $20B |
|
||
Price history
+87.4% since first listed7 events — show timeline
- 2026-05-26 Listed $149,000 REALCOMP
- 2026-05-26 Listed $149,000 MiRealSource-MiMLS
- 2022-11-14 Sold (Public Records) $70,000 Public Records
- 2018-04-25 Listing Removed — MiRealSource-MiMLS
- 2009-07-01 Sold (MLS) $24,900 MiRealSource-MiMLS
- 2009-04-13 Listed $24,900 MiRealSource-MiMLS
- 2007-03-22 Listed $79,500 MiRealSource-MiMLS
Property tax history
-0.7%/yrLatest (2025): $1,362 · -15.2% YoY. Source: county tax records.
Cash-flow waterfall
monthlySold comps — $/sqft
last 12 mo · ≤1 miLoading sold comps…