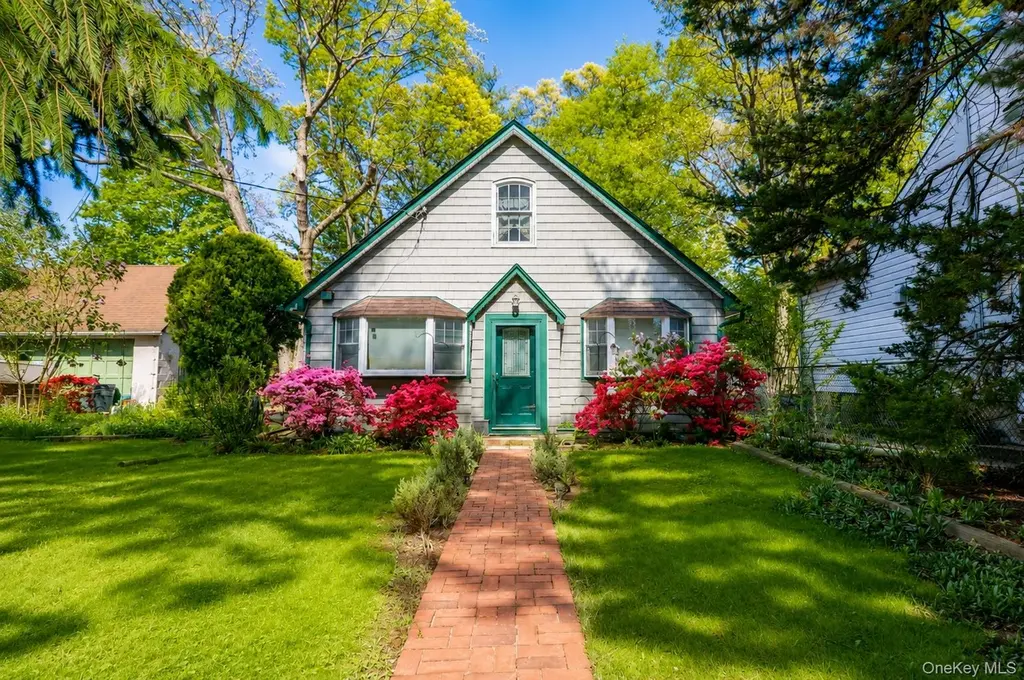
2027 Oakland Ave · Seaford, NY
Flood risk 1/10 · Minimal
- FEMA flood zone
- X (unshaded)
- Chance of flooding over 30 yrs
- 0.0%
- Est. flood insurance / yr
- $473 – $860
Fire risk 1/10 · Minimal
- Est. fire insurance / yr
- $691 – $1,283
Heat risk 6/10 · Moderate
- Hot days now (above 94°F)
- 7 days/yr
- Hot days in 30 yrs
- 17 days/yr
Wind risk 6/10 · Moderate
- Chance of severe wind over 30 yrs
- 75.0%
Air-quality risk 4/10 · Minor
- Unhealthy air days now
- 3 days/yr
- Unhealthy air days in 30 yrs
- 5 days/yr
Risk factors via First Street. Map © Google.
Why this score? — see what drove the D grade
The composite is a weighted blend of 9 inputs, each scored 0–100. Each bar is that input's sub-score; the figure is the points it added to the 100-point composite (weight × sub-score).
- ARV discount +15.0/15.0
- Schools +7.1/10.0
- Cash flow +6.9/30.0
- Livability +4.0/5.0
- Rent growth +2.5/5.0
- Condition / age +2.5/5.0
- 1% rule +2.4/10.0
- DSCR +1.1/10.0
- Appreciation +0.0/10.0
$679,000
🖨 Deal sheet (PDF) 📄 Offer letter ✓ Due diligence
Listing remarks
Welcome to 2027 Oakland Ave. .. a perfect Wantagh Cape just waiting for it's new owner's touch! This solid and cozy 3 bedroom home brings you a welcoming entryway leading into an oversized living room coupled with a private sitting room/den separated by beautiful folding glass doors. Continuing on, your reach the well maintained kitchen area, a formal dining room area, two additional bedrooms or home work spaces, a full bathroom and yet another, massive space to spread out serving as a secondary living room or den coupled with French doors out to your massive backyard. Upstairs you find the entire floor dedicated as the primary with en-suite, complete with a balcony overlooking that beautif
Key facts
- Private sitting room
- Formal dining room
- Massive backyard
Tags
Property features AI
Exterior
- Parking: Driveway and private off-street parking; 2-car garage
- Utilities: Public sewer; Cable connected; Electricity connected; Natural gas connected
- Home design: Single family residence; Living area per public records
- Construction: Frame construction
- Exterior features: Full front and back yard fencing; Not waterfront
Interior
- Kitchen: Oven; Refrigerator
- Bedrooms: Includes a bedroom on the first floor
- Flooring: Wood flooring
- Bathrooms: One full bathroom
- Heating & cooling: Baseboard heating; Hot water heating; No central air
- Interior features: First-floor bedroom; First-floor full bathroom; Ceiling fans; Formal dining room; Full basement
- Laundry & utility: Washer; Dryer; Laundry located inside
Neighborhood map
What this means for you Summary
Snapshot
- This is a 3-bed/1.0-bath single-family listed at $679k.
Deal economics
- At list price, monthly cash flow is $-1k ($-12k/yr) — negative.
- To cash-flow at today's rent, offer at most $495k (27.1% below list).
- To meet the 1% rule (rent ≥ 1% of price), the offer needs to be $502k (26.0% below list).
- Recommended offer: $495k (27.1% below list) — sets the bar for cash-flow.
- Cap rate 4.5% vs local median 3.3% in Seaford — top-decile yield for the area; either an underpriced asset or a hidden risk that comps aren't pricing in. Stress-test before assuming the spread holds.
Location & tenants
- Location reads 80/100 on livability (#115 in NY, #1,864 nationally) — a professional / high-income tenant draw. Strengths: crime A+, commute A+, employment A+; Watch: cost of living F.
- Seaford Union Free School District (suburban): math 73% / reading 81% proficiency, ranked #53 of 590 in NY (top 9%) — strong family-tenant draw, lease renewals of 3-5y typical; only 6% free/reduced lunch — higher-income household profile.
- Zoned schools: Seaford Manor School (math 92% / reading 87%, grade A+, #45 of 2,108 statewide, top 3%, 445 students, 10% FRL); Seaford Middle School (math 42% / reading 72%, grade B, #192 of 729 statewide, top 28%, 517 students, 15% FRL); Seaford Senior High School (math 98% / reading 98%, grade A+, #19 of 1,100 statewide, top 4%, 658 students, 16% FRL).
- Market conditions: 122 active listings in the ZIP; 2 comparable units currently listed for rent nearby; 824 units permitted in Nassau County in 2024 (153 in 5+ unit buildings).
Forward outlook
- Local home prices are declining (-3.0%/yr); year-one equity from $5k of loan paydown is wiped out by about $20k of value loss. Plan a longer hold.
- Nassau County population projected at +7% by 2050 — modest demand growth; plan on rents tracking national, not racing it.
Negotiation context
- It's been on market 26 days — a 2% lower offer ($669k) is reasonable based on typical stale-listing flexibility.
- Current owner paid $136k; list at $679k implies a 401% gain — meaningful room to come down on a strong offer.
Risks & watch-outs
- Watch-outs: built in 1954 — expect roof / HVAC / electrical / plumbing capex.
- Climate carrying-cost: major wind risk, 75% chance of damaging wind over 30y; extreme-heat days projected 7→17/yr by 2055 (HVAC capex compounding) — expect insurance premiums to compound above CPI over the hold.
Questions for the listing agent
- What do current leases actually rent for vs. the listed asking? Can we see a recent rent roll and the last 12 months of T-12 income?
- Built in 1954 — when were the roof, HVAC, electrical panel, plumbing, and water heater last replaced?
- Is there a deadline driving the sale (1031 exchange, divorce, estate, relocation)? That informs how much negotiation room exists.
- Schools are A-rated — typically a magnet for longer-tenancy family renters. What's the average tenant stay here, and is there a school-zone premium baked into asking?
- The area grade is low — what's the realistic commute time and amenity access for the typical tenant pool here? Any planned neighborhood developments (good or bad) we should know about?
- What's the average days-on-market for RENTAL listings here right now (not sales)? A rising rental-DOM trend means longer vacancies and softer asking-rent achievability than the comps imply.
- What's the recent tenant-quality profile in this submarket — average credit score on applications, eviction rate, late-payment / NSF rate, and stable-employment percentage? A property-management company in the area should have these aggregated.
- How much new for-sale + rental construction is in the pipeline within 1–3 miles? Heavy new supply typically softens prices + rents 12–24 months out; constrained supply supports both.
Investment metrics
- 1% rule
- 0.74% ✗
- Cap rate
- 4.45%
- Cash-on-cash
- -6.56%
- DSCR
- 0.71
- GRM
- 11.3
CMA / ARV
- ARV (median comp)
- $854,237
- List price
- $679,000
- Delta
- -20.51%
- Verdict
- UNDERPRICED
- Comps
- 20 within 1.0 mi
Show comp detail 12 sales within ~0.75 mi
| Address | Dist | Beds/Ba | Sqft | Sold | Price | $/sf | Match |
|---|---|---|---|---|---|---|---|
| 2104 Fir St | 0.30mi | 4/2.0 (+1) | 1,650 (-3%) | 6mo | $775,000 | $470 | 67 |
| 2175 Wantagh Park Dr | 0.37mi | 4/1.5 (+1) | 1,610 (-5%) | 6mo | $840,000 | $522 | 62 |
| 2067 Jackson Ave | 0.75mi | 3/1.5 | 1,705 (+0%) | 5mo | $775,000 | $455 | 59 |
| 3615 Franklin St | 0.57mi | 3/2.0 | 1,600 (-6%) | 6mo | $835,000 | $522 | 55 |
| 2208 Seaford Ave | 0.39mi | 3/1.5 | 1,479 (-13%) | 8mo | $870,000 | $588 | 52 |
| 2310 Willow St | 0.68mi | 4/2.0 (+1) | 1,774 (+4%) | 0mo | $784,000 | $442 | 51 |
| 3563 Wadena St | 0.68mi | 4/2.0 (+1) | 1,650 (-3%) | 5mo | $780,000 | $473 | 50 |
| 3861 Wilburne Ave | 0.65mi | 3/2.0 | 1,558 (-8%) | 3mo | $790,000 | $507 | 50 |
| 2217 Fir St | 0.44mi | 3/2.0 | 1,486 (-12%) | 6mo | $850,000 | $572 | 50 |
| 1691 Lehigh Rd | 0.68mi | 2/1.0 (-1) | 1,508 (-11%) | 2mo | $690,000 | $458 | 43 |
| 2296 Hampton Ave | 0.65mi | 4/2.0 (+1) | 1,906 (+12%) | 7mo | $795,000 | $417 | 34 |
| 3495 Roanoke St | 0.73mi | 3/3.0 | 1,950 (+15%) | 3mo | $865,000 | $444 | 31 |
Match score weights: distance 35% · size 25% · config 20% · recency 20%. Top-matched comps best support the ARV.
Projected returns pro-forma
-3.0% appreciation · 3.0% rent growth · sell at horizon
- IRR
- -27.6%
- Equity multiple
- 0.07×
- Total profit
- $-175,998
- Equity at exit
- $101,241
- IRR
- -25.7%
- Equity multiple
- -0.25×
- Total profit
- $-237,455
- Equity at exit
- $58,708
Cash invested: $190,120 (down + closing). Projections, not guarantees.
Landlord ↔ Tenant lean methodology
- Overall (STATE)
- 15 Strongly Tenant-Friendly
- State New York
- 15 Strongly Tenant-Friendly · D+10
- County
- — inherits STATE
- City
- — inherits STATE
ZIP-level market 11793
- Active inventory
- 122
- Price-to-rent
- 11.3×
Monthly cashflow live
- Estimated rent
- $5,023 medium interval (Pro) →
- Mortgage (P&I)
- −$3,561
- Tax from tax record
- −$1,165 /mo · $13,975/yr
- Insurance
- −$283
- HOA
- −$0
- Vacancy / Maint / Mgmt
- −$1,055
- Net cashflow
- $-1,040
Break-even live
Sensitivity live
| Price | -10% $-656 | -5% $-848 | +0% $-1,040 | +5% $-1,232 | +10% $-1,424 |
|---|---|---|---|---|---|
| Rent | -10% $-1,437 | -5% $-1,238 | +0% $-1,040 | +5% $-842 | +10% $-643 |
| Rate | -1.0pp $-698 | -0.5pp $-867 | base $-1,040 | +0.5pp $-1,216 | +1.0pp $-1,395 |
UW: 25.0% down · 7.5% · 30yr · 1.5% tax · 5.0% vac · 8.0% maint · 8.0% mgmt
Financing live
Cash to close
- Down payment
- $169,750
- Closing costs
- $20,370
- Reserves months
- —
- Total cash needed
- —
Loan-product check · same deal, 3 products live
Conventional
25% down · 7.5% · 30yr
- Down + closing
- —
- Monthly P&I
- —
- Monthly cashflow
- —
- DSCR
- —
- Eligible?
- —
Personal DTI + credit; lowest rate.
DSCR
20% down · 8.5% · 30yr
- Down + closing
- —
- Monthly P&I
- —
- Monthly cashflow
- —
- DSCR
- —
- Eligible?
- —
No personal income docs; deal must DSCR.
Hard money
10% down · 12.0% · 12mo
- Down + closing
- —
- Monthly P&I
- —
- Monthly cashflow
- —
- DSCR
- —
- Eligible?
- —
Short-term bridge; refi at stabilization.
Rent comps 2 comps
| Address | Beds | Baths | Sqft | Rent | $/sqft | DOM | Units | Dist |
|---|---|---|---|---|---|---|---|---|
| 3883 Franklin Ave Seaford, NY | 4.0 | 2.0 | 1593 | $5,500 | $3.45 | 44d | 1 | 0.82mi |
| 398 Harrison Ave Massapequa, NY | 3.0 | 1.0 | 1098 | $3,800 | $3.46 | 44d | 1 | 1.44mi |
Listing history 11 events
-
2026-06-12status $679,000 Pending 26 DOM
-
2026-06-09days on market $679,000 Active 26 DOM
-
2026-06-08days on market $679,000 Active 25 DOM
-
2026-06-07days on market $679,000 Active 24 DOM
-
2026-06-07days on market $679,000 Active 23 DOM
-
2026-06-04days on market $679,000 Active 20 DOM
-
2026-06-02days on market $679,000 Active 19 DOM
-
2026-06-01days on market $679,000 Active 18 DOM
-
2026-05-31days on market $679,000 Active 17 DOM
-
2026-05-14$679,000 Active 1200-char remark
-
1991-07-23soldstatus $135,500
ⓘ Source: listings_history table (triggers on properties + properties_extension) + one-shot
backfill from property_details.listing_events for pre-trigger history.
Tax reassessment forecast NY · Partial reset (capped growth)
- Current annual tax
- $13,975 · $1,165/mo
- Projected year-2 tax
- $13,975 · $1,165/mo
- Expected delta
- $0/yr ($0/mo · -0.0%)
ⓘ Screening estimate from a state-policy table — verify with the county assessor before closing.
Climate risk First Street
- Flood 1/10 Low FEMA zone X (unshaded) · 0% chance over 30 yrs
- Wildfire 1/10 Low
- Heat 6/10 Major 7 d/yr ≥94°F today · 17 d/yr by 30 yrs out
- Wind 6/10 Major 75% chance of damaging wind over 30 yrs
- Air quality 4/10 Moderate 3 unhealthy d/yr today · 5 by 30 yrs out
Nearby sold comps map
Loading sold comps map…
Walkable amenities ~0.75 mi
Loading nearby amenities…
Taxation est. · year 1
- Rental income
- $60,277
- − Mortgage interest
- −$38,035
- − Property taxes
- −$13,975
- − Insurance
- −$3,395
- − Repairs & maintenance
- −$4,822
- − Management
- −$4,822
- − Depreciation
- −$19,753
- Taxable loss
- −$24,525
- Est. tax savings @ 24.0%
- +$5,886
- After-tax cash flow
- $-6,595/yr
For passive investors: Depreciation is non-cash, so a rental often shows a tax loss while cash-flowing — sheltering income. Rental losses are passive: they offset passive income freely, and up to $25,000/yr can offset ordinary (W-2) income if you actively participate and your MAGI is under $100k (phasing out to $0 by $150k); unused losses carry forward. On sale, claimed depreciation is recaptured at up to 25%, and gains may owe capital-gains tax (a 1031 exchange can defer both). Figures are a year-1 estimate at your 24.0% rate — not tax advice; consult a CPA.
Schools (NCES district)
- District
- Seaford Union Free School District
- NCES district ID
- 3626400
- Math proficiency
- 73% ▼ -2.00%
- Reading proficiency
- 81% ▲ 11.00%
- Median HH income
- $106,919
- Composite
- 70.59/100
- National rank
- #257
- State rank
- #53 of 590 in NY
Livability — Seaford
- Score
- 80/100
- State rank
- #115
- US rank
- #1864
Category grades
Schools grade is shown separately in the Schools card above.
Census & demographics
- Census place
- Seaford, NY
- City population
- 21,588
- Population (ZIP)
- 31,497
Population outlook (Nassau County) Hauer SSP2
- Today (2025)
- 1,409,302 people
- By 2030
- 1,431,482 · +1.6%
- By 2040
- 1,471,607 · +4.4%
- By 2050
- 1,502,845 · +6.6%
- By 2075
- 1,575,403 · +11.8%
- By 2100
- 1,554,356 · +10.3%
Race, ethnicity, and origin ACS 2023
- Neighborhood character
- Predominantly White (82%)
- Race & ethnicity
- White 82% Hispanic / Latino 11% Two or more races 8% Asian 3% Black 1%
- Hispanic origin (detail)
- Puerto Rican 2%
- Common ancestry
- Romanian 4% Scotch-Irish 3% Portuguese 1%
- Foreign-born
- 9% · Canada, China, Dominican Republic
- Languages at home
- 88% English-only · Spanish 5% Other Indo-European 4% Chinese 1%
Political lean MEDSL · Nassau
- 2024 margin
- Toss-up / Even · D 47.9% · R 52.1%
- 2008→2024 swing
- -12.6pp toward R · 2008: 8.4pp · 2024: -4.2pp
- All cycles
- 2024: R+4.2 2020: D+9.5 2016: D+5.3 2012: D+6.7 2008: D+8.4
Not yet ingested
- Civics
- —
Market trends
- HPI YoY
- ▼ -842.25%
- Current HPI
- 299.9785
- Rent YoY
- —
- Metro
- —
- State GDP YoY
- ▲ 2.60%
- F500 in state
- 92
Industry mix (Fortune 500 HQ in NY)
| Industry | F500 HQs | Revenue |
|---|---|---|
| Financial Services | 10 | $950B |
|
||
| Consumer Goods | 9 | $162B |
|
||
| Insurance | 4 | $225B |
|
||
| Telecommunications | 2 | $144B |
|
||
| Pharmaceuticals | 2 | $112B |
|
||
| Media / Entertainment | 2 | $69B |
|
||
Price history
+401.1% since first listed3 events — show timeline
- 2026-06-10 Pending — OneKey® MLS as Distributed by MLS Grid
- 2026-05-14 Listed $679,000 OneKey® MLS as Distributed by MLS Grid
- 1991-07-23 Sold (Public Records) $135,500 Public Records
Property tax history
+3.8%/yrLatest (2024): $13,975 · +4.0% YoY. Source: county tax records.
Cash-flow waterfall
monthlySold comps — $/sqft
last 12 mo · ≤1 miLoading sold comps…