 Multi-family
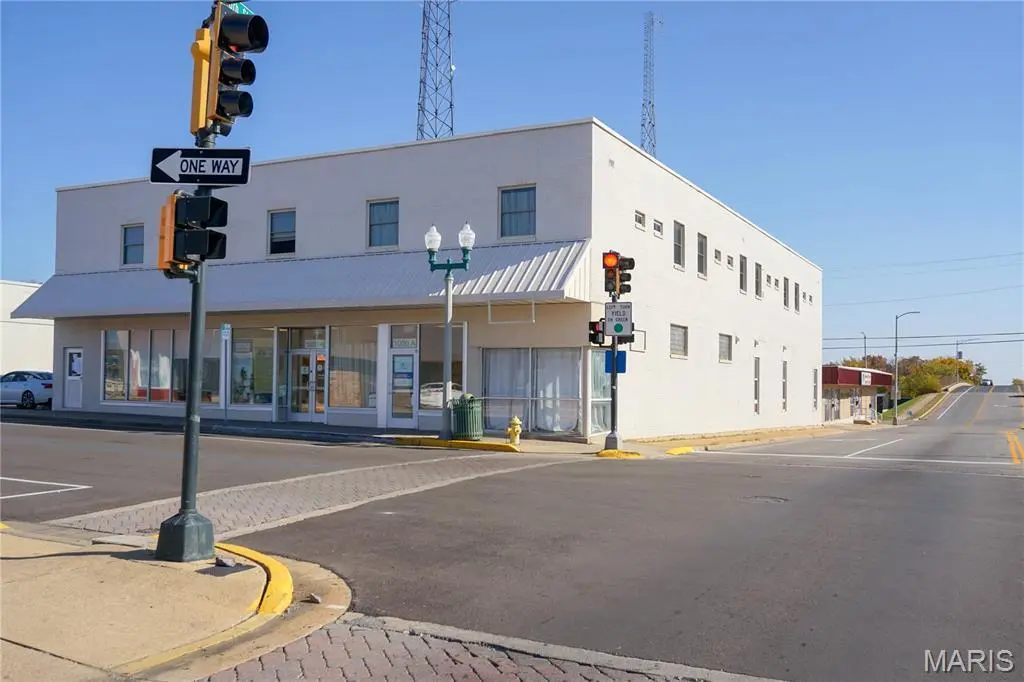
1000 N Pine St · Rolla, MO
Flood risk No data
- FEMA flood zone
- —
- Chance of flooding over 30 yrs
- —
- Est. flood insurance / yr
- —
Fire risk No data
- Est. fire insurance / yr
- —
Heat risk No data
- Hot days now (above threshold)
- —
- Hot days in 30 yrs
- —
Wind risk No data
- Chance of severe wind over 30 yrs
- —
Air-quality risk No data
- Unhealthy air days now
- —
- Unhealthy air days in 30 yrs
- —
Risk factors via First Street. Map © Google.
Why this score? — see what drove the B- grade
The composite is a weighted blend of 9 inputs, each scored 0–100. Each bar is that input's sub-score; the figure is the points it added to the 100-point composite (weight × sub-score).
- Cash flow +28.9/30.0
- DSCR +10.0/10.0
- 1% rule +8.0/10.0
- ARV discount +7.5/15.0
- Rent growth +5.0/5.0
- Livability +3.7/5.0
- Schools +3.6/10.0
- Condition / age +2.5/5.0
- Appreciation +0.0/10.0
$1,900,000
🖨 Deal sheet 📄 Offer letter ✓ Due diligence
Multi-family units
County records classify this as Multi-Family (5+ Unit). Listing-text estimate: 1 unit. estimate disagrees with records
5+ unit building — per-unit beds/baths from public records are typically unavailable; the breakdown below (if shown) is an estimate from the listing text.
Listing remarks MLS
This 18,386 +/- sq. ft. mixed-use property sits on a corner lot at N. Pine Street and W. 10th Street, offering excellent visibility and accessibility. Located within walking distance of Missouri S&T, this property includes a combination of office space and furnished residential units. The upper level features 16 furnished units with private baths, a shared kitchen, and on-site coin-operated laundry. The main level includes two professional office suites and 8 additional furnished living units. Each unit is furnished with a full-size bed and mattress pad, dresser, desk with chair and lamp, microwave, and a full-size refrigerator/freezer. The community area includes a full kitchen with seating and a comfortable lounge space. Suite A offers approximately 1,200 sq. ft. with a reception area, three offices, a conference room with kitchenette, and a private bath with shower. Suite B provides approximately 2,200 sq. ft. with a reception area, nine offices, a conference room, kitchen area, and two bathrooms. The property also includes asphalt parking with 16 spaces and a side parking garage. Great occupancy and steady income make this an excellent investment opportunity in a desirable Rolla location near downtown and Missouri S&T.
Key facts
- Excellent visibility
- Shared kitchen
- Private baths
Tags
Neighborhood map
What this means for you Summary
Snapshot
- This is a multifamily listed at $1.90M.
Deal economics
- At list price, monthly cash flow is $6k ($77k/yr) — positive.
- The deal already cash-flows at list — no discount required.
- Meets the 1% rule at list price ($25k rent vs $1.90M).
- Recommended offer: $1.67M (12.0% below list) — sets the bar for market timing.
- Cap rate 10.4% vs local median 3.5% in Rolla — top-decile yield for the area; either an underpriced asset or a hidden risk that comps aren't pricing in. Stress-test before assuming the spread holds.
Location & tenants
- Location reads 73/100 on livability (#76 in MO) — a middle-class / working-renter tenant base. Strengths: cost of living A+, health & safety A+, housing A-; Watch: crime D, commute F, employment D-.
- Rolla 31 (town): math 38% / reading 48% proficiency, ranked #118 of 324 in MO (top 36%) — families likely to look elsewhere, expect single-tenant / working-renter base with shorter leases.
- Market conditions: Rents rising fast (+10.2%/yr); 268 active listings in the ZIP; 162 units permitted in Phelps County in 2024 (83 in 5+ unit buildings).
- At $24,753/mo this rent would consume 530% of the median local household income ($56k/yr) (locally 1122% of renters already pay >50% of income on rent) — very limited rent-growth headroom before tenants either downsize or default.
Forward outlook
- Local home prices are declining (-3.0%/yr); year-one equity from $13k of loan paydown is wiped out by about $57k of value loss. Plan a longer hold.
- Phelps County population projected at -12% by 2050 — secular population decline; favor cash flow + early exit over multi-decade hold.
- At projected returns (-3.0% appreciation + 8.0% rent growth), your $532k cash investment doubles in ~6 years — after that, you're playing with house money.
Negotiation context
- It's been on market 197 days — a 12% lower offer ($1.67M) is reasonable based on typical stale-listing flexibility.
Risks & watch-outs
- Watch-outs: built in 1950 — expect roof / HVAC / electrical / plumbing capex.
Questions for the listing agent
- It's been on market 197 days. Have you received any prior offers? Is the seller open to a 12% concession, seller financing, or rate buy-down credit?
- Built in 1950 — when were the roof, HVAC, electrical panel, plumbing, and water heater last replaced?
- Why hasn't it sold? Are there any deal-killer items the seller is aware of (foundation, flood, title, zoning, code violations)?
- Is there a deadline driving the sale (1031 exchange, divorce, estate, relocation)? That informs how much negotiation room exists.
- Schools are B-rated — typically a magnet for longer-tenancy family renters. What's the average tenant stay here, and is there a school-zone premium baked into asking?
- Crime grade is D in this area — have there been break-ins, vandalism, or insurance claims at this property in the last 3 years? What carrier currently insures it and at what premium?
- What's the average days-on-market for RENTAL listings here right now (not sales)? A rising rental-DOM trend means longer vacancies and softer asking-rent achievability than the comps imply.
- What's the recent tenant-quality profile in this submarket — average credit score on applications, eviction rate, late-payment / NSF rate, and stable-employment percentage? A property-management company in the area should have these aggregated.
- How much new apartment / multifamily construction is in the pipeline within 1–3 miles? Heavy new supply (>2% of stock underway) typically softens rents 12–24 months out; light construction supports rent growth.
Investment metrics
- 1% rule
- 1.30% ✓
- Cap rate
- 10.35%
- Cash-on-cash
- 14.49%
- DSCR
- 1.64
- GRM
- 6.4
CMA / ARV
No comps found within radius.
Projected returns pro-forma
-3.0% appreciation · 8.0% rent growth · sell at horizon
- IRR
- 10.4%
- Equity multiple
- 1.44×
- Total profit
- $232,479
- Equity at exit
- $283,296
- IRR
- 23.3%
- Equity multiple
- 3.49×
- Total profit
- $1,326,220
- Equity at exit
- $164,277
Cash invested: $532,000 (down + closing). Projections, not guarantees.
Landlord ↔ Tenant lean methodology
- Overall (STATE)
- 81 Strongly Landlord-Friendly
- State Missouri
- 81 Strongly Landlord-Friendly · R+10
- County
- — inherits STATE
- City
- — inherits STATE
ZIP-level market 65401
- Home prices YoY
- -26.4%
- Rents YoY
- 10.2%
- Active inventory
- 268
- Price-to-rent
- 153.5×
Monthly cashflow live
- Estimated rent
- $24,753 medium interval (Pro) →
- Mortgage (P&I)
- −$9,964
- Tax est. 1.5%
- −$2,375 /mo · $28,500/yr
- Insurance
- −$792
- HOA
- −$0
- Vacancy / Maint / Mgmt
- −$5,198
- Net cashflow
- $6,424
Break-even live
24-unit breakdown (identical units grouped — click to expand)
| Units | Beds | Baths | Est. rent |
|---|---|---|---|
| 24× units | 1 | 1 | $24,744 |
| #1 | 1 | 1 | $1,031 |
| #2 | 1 | 1 | $1,031 |
| #3 | 1 | 1 | $1,031 |
| #4 | 1 | 1 | $1,031 |
| #5 | 1 | 1 | $1,031 |
| #6 | 1 | 1 | $1,031 |
| #7 | 1 | 1 | $1,031 |
| #8 | 1 | 1 | $1,031 |
| #9 | 1 | 1 | $1,031 |
| #10 | 1 | 1 | $1,031 |
| #11 | 1 | 1 | $1,031 |
| #12 | 1 | 1 | $1,031 |
| #13 | 1 | 1 | $1,031 |
| #14 | 1 | 1 | $1,031 |
| #15 | 1 | 1 | $1,031 |
| #16 | 1 | 1 | $1,031 |
| #17 | 1 | 1 | $1,031 |
| #18 | 1 | 1 | $1,031 |
| #19 | 1 | 1 | $1,031 |
| #20 | 1 | 1 | $1,031 |
| #21 | 1 | 1 | $1,031 |
| #22 | 1 | 1 | $1,031 |
| #23 | 1 | 1 | $1,031 |
| #24 | 1 | 1 | $1,031 |
| Total (24 units) | $24,753 | ||
UW: 25.0% down · 7.5% · 30yr · 1.5% tax · 5.0% vac · 8.0% maint · 8.0% mgmt
Financing live
Cash to close
- Down payment
- $475,000
- Closing costs
- $57,000
- Reserves months
- —
- Total cash needed
- —
Loan-product check · same deal, 3 products live
Conventional
25% down · 7.5% · 30yr
- Down + closing
- —
- Monthly P&I
- —
- Monthly cashflow
- —
- DSCR
- —
- Eligible?
- —
Personal DTI + credit; lowest rate.
DSCR
20% down · 8.5% · 30yr
- Down + closing
- —
- Monthly P&I
- —
- Monthly cashflow
- —
- DSCR
- —
- Eligible?
- —
No personal income docs; deal must DSCR.
Hard money
10% down · 12.0% · 12mo
- Down + closing
- —
- Monthly P&I
- —
- Monthly cashflow
- —
- DSCR
- —
- Eligible?
- —
Short-term bridge; refi at stabilization.
Listing history 16 events
-
2026-06-19days on market $1,900,000 Active 197 DOM
-
2026-06-18days on market $1,900,000 Active 196 DOM
-
2026-06-17days on market $1,900,000 Active 195 DOM
-
2026-06-16days on market $1,900,000 Active 194 DOM
-
2026-06-15days on market $1,900,000 Active 193 DOM
-
2026-06-14days on market $1,900,000 Active 191 DOM
-
2026-06-12days on market $1,900,000 Active 190 DOM
-
2026-06-09days on market $1,900,000 Active 187 DOM
-
2026-06-08days on market $1,900,000 Active 186 DOM
-
2026-06-07days on market $1,900,000 Active 185 DOM
-
2026-06-02days on market $1,900,000 Active 180 DOM
-
2026-06-01days on market $1,900,000 Active 179 DOM
-
2026-05-31days on market $1,900,000 Active 178 DOM
-
2026-05-30days on market $1,900,000 Active 177 DOM
-
2025-12-04$1,900,000 Active 1253-char remark
Show marketing remark (1253 chars)
This 18,386 +/- sq. ft. mixed-use property sits on a corner lot at N. Pine Street and W. 10th Street, offering excellent visibility and accessibility. Located within walking distance of Missouri S&T, this property includes a combination of office space and furnished residential units. The upper level features 16 furnished units with private baths, a shared kitchen, and on-site coin-operated laundry. The main level includes two professional office suites and 8 additional furnished living units. Each unit is furnished with a full-size bed and mattress pad, dresser, desk with chair and lamp, microwave, and a full-size refrigerator/freezer. The community area includes a full kitchen with seating and a comfortable lounge space. Suite A offers approximately 1,200 sq. ft. with a reception area, three offices, a conference room with kitchenette, and a private bath with shower. Suite B provides approximately 2,200 sq. ft. with a reception area, nine offices, a conference room, kitchen area, and two bathrooms. The property also includes asphalt parking with 16 spaces and a side parking garage. Great occupancy and steady income make this an excellent investment opportunity in a desirable Rolla location near downtown and Missouri S&T.
-
2004-03-02soldstatus
ⓘ Source: listings_history table (triggers on properties + properties_extension) + one-shot
backfill from property_details.listing_events for pre-trigger history.
Nearby sold comps map
Loading sold comps map…
Walkable amenities ~0.75 mi
Loading nearby amenities…
Taxation est. · year 1
- Rental income
- $297,036
- − Mortgage interest
- −$106,430
- − Property taxes
- −$28,500
- − Insurance
- −$9,500
- − Repairs & maintenance
- −$23,763
- − Management
- −$23,763
- − Depreciation
- −$55,273
- Taxable income
- $49,808
- Est. tax owed @ 24.0%
- −$11,954
- After-tax cash flow
- $65,139/yr
For passive investors: Depreciation is non-cash, so a rental often shows a tax loss while cash-flowing — sheltering income. Rental losses are passive: they offset passive income freely, and up to $25,000/yr can offset ordinary (W-2) income if you actively participate and your MAGI is under $100k (phasing out to $0 by $150k); unused losses carry forward. On sale, claimed depreciation is recaptured at up to 25%, and gains may owe capital-gains tax (a 1031 exchange can defer both). Figures are a year-1 estimate at your 24.0% rate — not tax advice; consult a CPA.
Schools (NCES district)
- District
- Rolla 31
- NCES district ID
- 2926890
- Math proficiency
- 38% ▼ -9.00%
- Reading proficiency
- 48% ▼ -7.00%
- Median HH income
- $40,057
- Composite
- 36.0/100
- National rank
- #4786
- State rank
- #118 of 324 in MO
Livability — Rolla
- Score
- 73/100
- State rank
- #76
- US rank
- #5115
Category grades
Schools grade is shown separately in the Schools card above.
Census & demographics
- Census place
- Rolla, MO
- County
- Phelps County · 42,017 people
- City population
- 32,714
- Metro
- Rolla, MO
- Population (ZIP)
- 32,714
- Household income
- $56,081
- Rent vs Own
- Severe rent burden
- 1122.0
Population outlook (Phelps County) Hauer SSP2
- Today (2025)
- 44,188 people
- By 2030
- 43,524 · -1.5%
- By 2040
- 41,211 · -6.7%
- By 2050
- 38,977 · -11.8%
- By 2075
- 33,846 · -23.4%
- By 2100
- 27,828 · -37.0%
Race, ethnicity, and origin ACS 2023
- Neighborhood character
- Predominantly White (84%)
- Race & ethnicity
- White 84% Two or more races 6% Asian 4% Hispanic / Latino 3% Black 3%
- Common ancestry
- Lithuanian 4% Italian 2% Slovak 2%
- Foreign-born
- 6% · China, Canada
- Languages at home
- 93% English-only · Chinese 2% Spanish 1% Other Indo-European 1%
Political lean MEDSL · Phelps
- 2024 margin
- Solid R (+42.9) · D 27.9% · R 70.8% · Other 1.3%
- 2008→2024 swing
- -20.7pp toward R · 2008: -22.2pp · 2024: -42.9pp
- All cycles
- 2024: R+42.9 2020: R+40.1 2016: R+42.9 2012: R+33.5 2008: R+22.2
Not yet ingested
- Civics
- —
Market trends
- HPI YoY
- ▼ -61.69%
- Current HPI
- 172.421
- Rent YoY
- ▲ 10.25%
- Metro
- Rolla, MO
- State GDP YoY
- ▲ 1.84%
- F500 in state
- 20
Industry mix (Fortune 500 HQ in MO)
| Industry | F500 HQs | Revenue |
|---|---|---|
| Healthcare | 1 | $163B |
|
||
| Insurance | 1 | $21B |
|
||
| Industrial Technology | 1 | $17B |
|
||
| Retail | 1 | $16B |
|
||
| Industrial Distribution | 1 | $10B |
|
||
| Utilities | 1 | $9B |
|
||
Price history
2 events — show timeline
- 2025-12-04 Listed $1,900,000 MARIS as Distributed by MLS Grid
- 2004-03-02 Sold (Public Records) — Public Records
Cash-flow waterfall
monthlySold comps — $/sqft
last 12 mo · ≤1 miLoading sold comps…