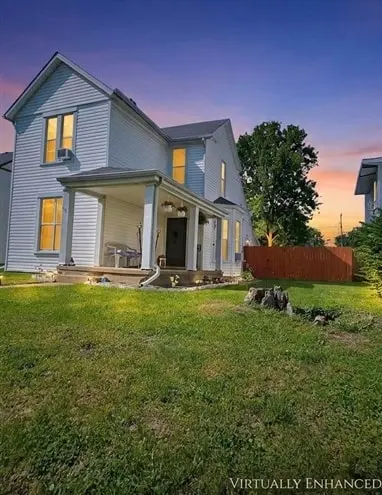
404 Lincoln St · Richmond, IN
Flood risk 1/10 · Minimal
- FEMA flood zone
- X (unshaded)
- Chance of flooding over 30 yrs
- 0.0%
- Est. flood insurance / yr
- $473 – $860
Fire risk 1/10 · Minimal
- Est. fire insurance / yr
- $717 – $1,331
Heat risk 3/10 · Minor
- Hot days now (above 100°F)
- 7 days/yr
- Hot days in 30 yrs
- 18 days/yr
Wind risk 2/10 · Minimal
- Chance of severe wind over 30 yrs
- 1.0%
Air-quality risk 3/10 · Minor
- Unhealthy air days now
- 2 days/yr
- Unhealthy air days in 30 yrs
- 3 days/yr
Risk factors via First Street. Map © Google.
Why this score? — see what drove the F grade
The composite is a weighted blend of 9 inputs, each scored 0–100. Each bar is that input's sub-score; the figure is the points it added to the 100-point composite (weight × sub-score).
- Cash flow +15.8/30.0
- DSCR +4.9/10.0
- Livability +4.2/5.0
- 1% rule +3.2/10.0
- Rent growth +2.5/5.0
- Condition / age +2.5/5.0
- Schools +1.9/10.0
- ARV discount +0.0/15.0
- Appreciation +0.0/10.0
$135,000
🖨 Deal sheet 📄 Offer letter ✓ Due diligence
Listing remarks
Enter into this inviting 4-bedroom, 2-bath home offering spacious rooms and a comfortable, functional layout. The main floor features convenient laundry access and generously sized living areas perfect for everyday living. Outside, enjoy a large privacy-fenced backyard—ideal for pets, gatherings, or quiet evenings. A covered front porch adds charm and a welcoming touch to this well-kept property.
Key facts
- Covered front porch
- 7,200 sq ft lot
- Garage
Tags
Property features AI
Exterior
- Parking: Detached 1-car garage
- Utilities: Public water; Public sewer
- Home design: Single-family residence; 2 stories
- Construction: Vinyl siding
- Exterior features: Fenced yard; Shingle roof
Interior
- Kitchen: Dishwasher; Electric range
- Bedrooms: Total of 8 rooms (bedroom count not specified)
- Bathrooms: 2 full bathrooms
- Heating & cooling: Natural gas heating; Window air conditioning units
- Interior features: Dishwasher; Electric range; Electric water heater; Partial crawl space basement
- Laundry & utility: Electric water heater
Neighborhood map
What this means for you Summary
Snapshot
- This is a 3-bed/2.0-bath single-family listed at $135k.
Deal economics
- At list price, monthly cash flow is $62 ($749/yr) — positive.
- The deal already cash-flows at list — no discount required.
- To meet the 1% rule (rent ≥ 1% of price), the offer needs to be $111k (17.8% below list).
- Recommended offer: $111k (17.8% below list) — sets the bar for 1% rule.
- Cap rate 6.8% vs local median 5.2% in Richmond — top-decile yield for the area; either an underpriced asset or a hidden risk that comps aren't pricing in. Stress-test before assuming the spread holds.
Location & tenants
- Location reads 83/100 on livability (#10 in IN, #869 nationally) — a professional / high-income tenant draw. Strengths: commute A+, cost of living A+, housing A+; Watch: crime D+, employment D-.
- Richmond Community Schools (town): math 18% / reading 27% proficiency, ranked #270 of 301 in IN (top 90%) — low school quality limits family demand, transient renter base, plan for 1-2y turnover; 65% free/reduced lunch — lower-income household profile, screen leases tightly.
- Zoned schools: Crestdale Elementary School (math 32% / reading 32%, grade F, #652 of 994 statewide, top 68%, 390 students, 80% FRL); Richmond High School (math 21% / reading 48%, grade F, #270 of 369 statewide, top 77%, 1,332 students, 66% FRL).
- Market conditions: 273 active listings in the ZIP; 2 comparable units currently listed for rent nearby; 38 units permitted in Wayne County in 2024 (0 in 5+ unit buildings).
Forward outlook
- Local home prices are declining (-3.0%/yr); year-one equity from $933 of loan paydown is wiped out by about $4k of value loss. Plan a longer hold.
- Wayne County population projected at -21% by 2050 — secular population decline; favor cash flow + early exit over multi-decade hold.
Negotiation context
- It's been on market 53 days — a 3% lower offer ($131k) is reasonable based on typical stale-listing flexibility.
Risks & watch-outs
- Watch-outs: built in 1928 — expect roof / HVAC / electrical / plumbing capex.
Questions for the listing agent
- It's been on market 53 days. Have you received any prior offers? Is the seller open to a 18% concession, seller financing, or rate buy-down credit?
- Built in 1928 — when were the roof, HVAC, electrical panel, plumbing, and water heater last replaced?
- Is there a deadline driving the sale (1031 exchange, divorce, estate, relocation)? That informs how much negotiation room exists.
- Schools are D-rated, which usually means shorter tenancies and higher turnover. Who's the typical renter profile here, and what's been the actual vacancy rate?
- Crime grade is D in this area — have there been break-ins, vandalism, or insurance claims at this property in the last 3 years? What carrier currently insures it and at what premium?
- The area grade is low — what's the realistic commute time and amenity access for the typical tenant pool here? Any planned neighborhood developments (good or bad) we should know about?
- What's the average days-on-market for RENTAL listings here right now (not sales)? A rising rental-DOM trend means longer vacancies and softer asking-rent achievability than the comps imply.
- What's the recent tenant-quality profile in this submarket — average credit score on applications, eviction rate, late-payment / NSF rate, and stable-employment percentage? A property-management company in the area should have these aggregated.
- How much new for-sale + rental construction is in the pipeline within 1–3 miles? Heavy new supply typically softens prices + rents 12–24 months out; constrained supply supports both.
Investment metrics
- 1% rule
- 0.82% ✗
- Cap rate
- 6.85%
- Cash-on-cash
- 1.98%
- DSCR
- 1.09
- GRM
- 10.1
CMA / ARV
- ARV (on-the-fly)
- $108,486
- Comps found
- 12
Show comp detail 12 sales within ~0.75 mi
| Address | Dist | Beds/Ba | Sqft | Sold | Price | $/sf | Match |
|---|---|---|---|---|---|---|---|
| 624 Peacock Rd | 0.21mi | 3/1.0 | 1,334 (+1%) | 7mo | $135,000 | $101 | 79 |
| 413 NW E St | 0.20mi | 3/1.0 | 1,167 (-12%) | 6mo | $95,000 | $81 | 62 |
| 105 SW 10th St | 0.58mi | 3/1.0 | 1,270 (-4%) | 1mo | $157,500 | $124 | 61 |
| 4 Court Rd | 0.55mi | 3/2.0 | 1,200 (-9%) | 1mo | $40,500 | $34 | 58 |
| 620 SW A St | 0.37mi | 3/1.5 | 1,456 (+10%) | 8mo | $119,000 | $82 | 57 |
| 900 W Main St | 0.49mi | 3/2.0 | 1,192 (-10%) | 6mo | $90,000 | $76 | 56 |
| 239 NW I St | 0.52mi | 2/1.0 (-1) | 1,416 (+7%) | 1mo | $112,000 | $79 | 54 |
| 223 SW 4th St | 0.44mi | 3/1.0 | 1,194 (-10%) | 6mo | $120,000 | $101 | 54 |
| 1034 Boyer St | 0.65mi | 2/1.5 (-1) | 1,404 (+6%) | 8mo | $37,600 | $27 | 46 |
| 124 NW I St | 0.58mi | 2/1.5 (-1) | 1,178 (-11%) | 7mo | $83,750 | $71 | 42 |
| 1022 Boyer St | 0.64mi | 2/2.0 (-1) | 1,152 (-13%) | 9mo | $114,900 | $100 | 36 |
| 450 SW 5th St | 0.71mi | 4/1.5 (+1) | 1,500 (+13%) | 4mo | $155,000 | $103 | 34 |
Match score weights: distance 35% · size 25% · config 20% · recency 20%. Top-matched comps best support the ARV.
Projected returns pro-forma
-3.0% appreciation · 3.0% rent growth · sell at horizon
- IRR
- -13.2%
- Equity multiple
- 0.52×
- Total profit
- $-17,955
- Equity at exit
- $20,129
- IRR
- -4.3%
- Equity multiple
- 0.72×
- Total profit
- $-10,743
- Equity at exit
- $11,672
Cash invested: $37,800 (down + closing). Projections, not guarantees.
Landlord ↔ Tenant lean methodology
- Overall (STATE)
- 90 Strongly Landlord-Friendly
- State Indiana
- 90 Strongly Landlord-Friendly · R+11
- County
- — inherits STATE
- City
- — inherits STATE
ZIP-level market 47374
- Active inventory
- 273
- Price-to-rent
- 10.1×
Monthly cashflow live
- Estimated rent
- $1,110 medium interval (Pro) →
- Mortgage (P&I)
- −$708
- Tax from tax record
- −$50 /mo · $604/yr
- Insurance
- −$56
- HOA
- −$0
- Vacancy / Maint / Mgmt
- −$233
- Net cashflow
- $62
Break-even live
UW: 25.0% down · 7.5% · 30yr · 1.5% tax · 5.0% vac · 8.0% maint · 8.0% mgmt
Financing live
Cash to close
- Down payment
- $33,750
- Closing costs
- $4,050
- Reserves months
- —
- Total cash needed
- —
Loan-product check · same deal, 3 products live
Conventional
25% down · 7.5% · 30yr
- Down + closing
- —
- Monthly P&I
- —
- Monthly cashflow
- —
- DSCR
- —
- Eligible?
- —
Personal DTI + credit; lowest rate.
DSCR
20% down · 8.5% · 30yr
- Down + closing
- —
- Monthly P&I
- —
- Monthly cashflow
- —
- DSCR
- —
- Eligible?
- —
No personal income docs; deal must DSCR.
Hard money
10% down · 12.0% · 12mo
- Down + closing
- —
- Monthly P&I
- —
- Monthly cashflow
- —
- DSCR
- —
- Eligible?
- —
Short-term bridge; refi at stabilization.
Rent comps 2 comps
| Address | Beds | Baths | Sqft | Rent | $/sqft | DOM | Units | Dist |
|---|---|---|---|---|---|---|---|---|
| 418 NW L St Richmond, IN | 3.0 | 1.0 | 1608 | $1,275 | $0.79 | 43d | 1 | 0.83mi |
| 401 N 10th St Richmond, IN | 1.0–2.0 | 1.0 | 817 | $895 | $1.09 | 43d | 3 | 0.99mi |
Listing history 18 events
-
2026-06-19days on market $135,000 Active 53 DOM
-
2026-06-18days on market $135,000 Active 52 DOM
-
2026-06-17days on market $135,000 Active 51 DOM
-
2026-06-16days on market $135,000 Active 50 DOM
-
2026-06-15days on market $135,000 Active 49 DOM
-
2026-06-14days on market $135,000 Active 47 DOM
-
2026-06-12days on market $135,000 Active 46 DOM
-
2026-06-09days on market $135,000 Active 43 DOM
-
2026-06-08days on market $135,000 Active 42 DOM
-
2026-06-07days on market $135,000 Active 41 DOM
-
2026-06-03days on market $135,000 Active 37 DOM
-
2026-06-02days on market $135,000 Active 36 DOM
-
2026-06-01days on market $135,000 Active 35 DOM
-
2026-05-31days on market $135,000 Active 34 DOM
-
2026-05-30days on market $135,000 Active 33 DOM
-
2026-05-18price $135,000
-
2026-05-16price $143,000
-
2026-04-27$145,000 Active
ⓘ Source: listings_history table (triggers on properties + properties_extension) + one-shot
backfill from property_details.listing_events for pre-trigger history.
Tax reassessment forecast IN · Partial reset (capped growth)
- Current annual tax
- $604 · $50/mo
- Projected year-2 tax
- $876 · $73/mo
- Expected delta
- +$272/yr (+$23/mo · 45.0%)
ⓘ Screening estimate from a state-policy table — verify with the county assessor before closing.
Climate risk First Street
- Flood 1/10 Low FEMA zone X (unshaded) · 0% chance over 30 yrs
- Wildfire 1/10 Low
- Heat 3/10 Moderate 7 d/yr ≥100°F today · 18 d/yr by 30 yrs out
- Wind 2/10 Low 100% chance of damaging wind over 30 yrs
- Air quality 3/10 Moderate 2 unhealthy d/yr today · 3 by 30 yrs out
Nearby sold comps map
Loading sold comps map…
Walkable amenities ~0.75 mi
Loading nearby amenities…
Taxation est. · year 1
- Rental income
- $13,321
- − Mortgage interest
- −$7,562
- − Property taxes
- −$604
- − Insurance
- −$675
- − Repairs & maintenance
- −$1,066
- − Management
- −$1,066
- − Depreciation
- −$3,927
- Taxable loss
- −$1,579
- Est. tax savings @ 24.0%
- +$379
- After-tax cash flow
- $1,128/yr
For passive investors: Depreciation is non-cash, so a rental often shows a tax loss while cash-flowing — sheltering income. Rental losses are passive: they offset passive income freely, and up to $25,000/yr can offset ordinary (W-2) income if you actively participate and your MAGI is under $100k (phasing out to $0 by $150k); unused losses carry forward. On sale, claimed depreciation is recaptured at up to 25%, and gains may owe capital-gains tax (a 1031 exchange can defer both). Figures are a year-1 estimate at your 24.0% rate — not tax advice; consult a CPA.
Schools (NCES district)
- District
- Richmond Community Schools
- NCES district ID
- 1809510
- Math proficiency
- 18% ▼ -7.00%
- Reading proficiency
- 27% ▼ -2.00%
- Median HH income
- $35,288
- Composite
- 18.55/100
- National rank
- #8913
- State rank
- #270 of 301 in IN
Livability — Richmond
- Score
- 83/100
- State rank
- #10
- US rank
- #869
Category grades
Schools grade is shown separately in the Schools card above.
Census & demographics
- Census place
- Richmond, IN
- County
- Wayne County · 44,615 people
- City population
- 44,615
- Metro
- Richmond, IN
- Population (ZIP)
- 44,615
- Household income
- $50,766
- Rent vs Own
- Severe rent burden
- 1600.0
Population outlook (Wayne County) Hauer SSP2
- Today (2025)
- 63,316 people
- By 2030
- 60,893 · -3.8%
- By 2040
- 55,386 · -12.5%
- By 2050
- 49,946 · -21.1%
- By 2075
- 37,900 · -40.1%
- By 2100
- 26,562 · -58.0%
Race, ethnicity, and origin ACS 2023
- Neighborhood character
- Predominantly White (82%)
- Race & ethnicity
- White 82% Two or more races 7% Black 6% Hispanic / Latino 4% Asian 1%
- Common ancestry
- Slovak 2% Italian 1% Lithuanian 1%
- Foreign-born
- 4% · Canada, China
- Languages at home
- 95% English-only · Spanish 3%
Political lean MEDSL · Wayne
- 2024 margin
- Solid R (+32.5) · D 32.9% · R 65.4% · Other 1.6%
- 2008→2024 swing
- -28.6pp toward R · 2008: -3.9pp · 2024: -32.5pp
- All cycles
- 2024: R+32.5 2020: R+29.1 2016: R+30.1 2012: R+14.7 2008: R+3.9
Not yet ingested
- Civics
- —
Market trends
- HPI YoY
- ▼ -118.64%
- Current HPI
- 182.5038
- Rent YoY
- —
- Metro
- Richmond, IN
- State GDP YoY
- ▲ 2.90%
- F500 in state
- 18
Industry mix (Fortune 500 HQ in IN)
| Industry | F500 HQs | Revenue |
|---|---|---|
| Industrial Machinery | 2 | $37B |
|
||
| Healthcare | 1 | $177B |
|
||
| Pharmaceuticals | 1 | $45B |
|
||
| Metals / Steel | 1 | $18B |
|
||
| Agriculture | 1 | $17B |
|
||
| Packaging | 1 | $12B |
|
||
Price history
-6.9% since first listed3 events — show timeline
- 2026-05-18 Price Changed $135,000 RRELMS
- 2026-05-16 Price Changed $143,000 RRELMS
- 2026-04-27 Listed $145,000 RRELMS
Property tax history
+5.9%/yrLatest (2024): $604 · +14.0% YoY. Source: county tax records.
Cash-flow waterfall
monthlySold comps — $/sqft
last 12 mo · ≤1 miLoading sold comps…