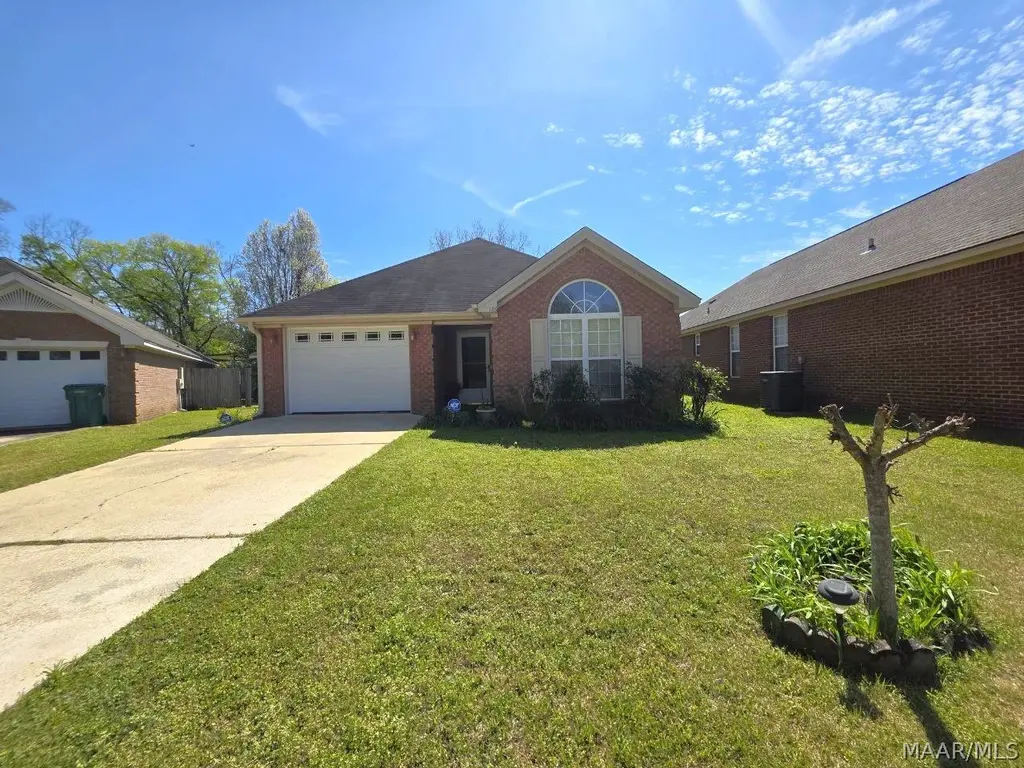
126 Forest Trl · Millbrook, AL
Flood risk 1/10 · Minimal
- FEMA flood zone
- X (unshaded)
- Chance of flooding over 30 yrs
- 0.0%
- Est. flood insurance / yr
- $507 – $1,088
Fire risk 4/10 · Minor
- Est. fire insurance / yr
- $916 – $1,700
Heat risk 7/10 · Major
- Hot days now (above 108°F)
- 7 days/yr
- Hot days in 30 yrs
- 20 days/yr
Wind risk 6/10 · Moderate
- Chance of severe wind over 30 yrs
- 77.0%
Air-quality risk 3/10 · Minor
- Unhealthy air days now
- 2 days/yr
- Unhealthy air days in 30 yrs
- 3 days/yr
Risk factors via First Street. Map © Google.
Why this score? — see what drove the D grade
The composite is a weighted blend of 9 inputs, each scored 0–100. Each bar is that input's sub-score; the figure is the points it added to the 100-point composite (weight × sub-score).
- Cash flow +12.1/30.0
- ARV discount +8.7/15.0
- Rent growth +4.8/5.0
- DSCR +3.6/10.0
- 1% rule +3.5/10.0
- Schools +3.5/10.0
- Livability +3.3/5.0
- Condition / age +2.5/5.0
- Appreciation +0.0/10.0
$175,999
🖨 Deal sheet (PDF) 📄 Offer letter ✓ Due diligence
Listing remarks MLS
Great home well taken care of. Very convenient to schools and shopping. Large greatroom with fireplace. Kitchen with a breakfast bar and dining area. Split plan. Screened back porch.
Key facts
- Screened back porch
- Expansive great room
- Privacy first layout
Tags
Property features AI
Exterior
- Parking: Attached garage; Driveway
- Security: Fire alarm
- Utilities: Cable available; Electricity available; Natural gas available; High-speed internet available; Public water; Public sewer
- Home design: Single-story home; Brick construction; Slab foundation; Built per public records; Located on a cul-de-sac city lot (86 x 47)
- Construction: Brick exterior; Slab foundation; Home warranty included
- Exterior features: Privacy fence; Storage; Porch (screened); Fire alarm
Interior
- Kitchen: Kitchen/Dining combo; Dishwasher; Electric range; Microwave; Plumbed for ice maker; Electric water heater
- Bedrooms: Bedroom on the first level
- Flooring: Carpet; Tile; Vinyl
- Bathrooms: 2 full bathrooms
- Heating & cooling: Central heating (gas); Central electric cooling
- Interior features: Blinds; Insulated doors and storm door(s); Walk-in closet(s); Window treatments; Breakfast bar; Split bedrooms; One fireplace
- Laundry & utility: Washer hookup; Dryer hookup; Laundry on the first level
Neighborhood map
What this means for you Summary
Snapshot
- This is a 2-bed/2.0-bath single-family listed at $176k.
Deal economics
- At list price, monthly cash flow is $-39 ($-463/yr) — negative.
- To cash-flow at today's rent, offer at most $170k (3.2% below list).
- To meet the 1% rule (rent ≥ 1% of price), the offer needs to be $149k (15.3% below list).
- Recommended offer: $149k (15.3% below list) — sets the bar for 1% rule.
- Cap rate 6.0% vs local median 4.4% in Millbrook — top-decile yield for the area; either an underpriced asset or a hidden risk that comps aren't pricing in. Stress-test before assuming the spread holds.
Location & tenants
- Location reads 66/100 on livability (#110 in AL) — a middle-class / working-renter tenant base. Strengths: cost of living A+, housing A+; Watch: crime D+, amenities F, commute F.
- Elmore County (town): math 27% / reading 54% proficiency, ranked #21 of 129 in AL (top 16%) — families likely to look elsewhere, expect single-tenant / working-renter base with shorter leases.
- Zoned schools: Coosada Elementary School (930 students, 70% FRL); Millbrook Middle School (math 27% / reading 52%, grade F, #61 of 257 statewide, top 24%, 1,185 students, 75% FRL); Stanhope Elmore High School (math 21% / reading 35%, grade F, #87 of 305 statewide, top 29%, 1,181 students, 62% FRL) — zoned schools average 69% FRL vs 44% district-wide (25 pts higher); higher-poverty schools than district average — tighter screening recommended.
- Market conditions: Rents rising fast (+9.0%/yr); 84 active listings in the ZIP; 4 comparable units currently listed for rent nearby; rentals at typical pace (median 16d on market — plan ~3-4 weeks tenant-placement turnaround); 92 units permitted in Elmore County in 2024 (0 in 5+ unit buildings).
Forward outlook
- Local home prices are declining (-3.0%/yr); year-one equity from $1k of loan paydown is wiped out by about $5k of value loss. Plan a longer hold.
- Elmore County population projected at +6% by 2050 — modest demand growth; plan on rents tracking national, not racing it.
Negotiation context
- It's been on market 33 days — a 3% lower offer ($171k) is reasonable based on typical stale-listing flexibility.
- 4 sale attempts since 20y ago with the ask held roughly flat each time — persistent listings suggest the price (not the market) is what's stuck; bring a comps-based counter.
- Current owner paid $135k; 30% above their basis — modest negotiation headroom, anchor on the comps not their cost.
Risks & watch-outs
- Climate carrying-cost: major wind risk, 77% chance of damaging wind over 30y; extreme-heat days projected 7→20/yr by 2055 (HVAC capex compounding) — expect insurance premiums to compound above CPI over the hold.
Questions for the listing agent
- What do current leases actually rent for vs. the listed asking? Can we see a recent rent roll and the last 12 months of T-12 income?
- It's been on market 33 days. Have you received any prior offers? Is the seller open to a 15% concession, seller financing, or rate buy-down credit?
- Is there a deadline driving the sale (1031 exchange, divorce, estate, relocation)? That informs how much negotiation room exists.
- Crime grade is D in this area — have there been break-ins, vandalism, or insurance claims at this property in the last 3 years? What carrier currently insures it and at what premium?
- The area grade is low — what's the realistic commute time and amenity access for the typical tenant pool here? Any planned neighborhood developments (good or bad) we should know about?
- What's the average days-on-market for RENTAL listings here right now (not sales)? A rising rental-DOM trend means longer vacancies and softer asking-rent achievability than the comps imply.
- What's the recent tenant-quality profile in this submarket — average credit score on applications, eviction rate, late-payment / NSF rate, and stable-employment percentage? A property-management company in the area should have these aggregated.
- How much new for-sale + rental construction is in the pipeline within 1–3 miles? Heavy new supply typically softens prices + rents 12–24 months out; constrained supply supports both.
Investment metrics
- 1% rule
- 0.85% ✗
- Cap rate
- 6.03%
- Cash-on-cash
- -0.94%
- DSCR
- 0.96
- GRM
- 9.8
CMA / ARV
- ARV (on-the-fly)
- $181,008
- Comps found
- 12
Show comp detail 12 sales within ~0.75 mi
| Address | Dist | Beds/Ba | Sqft | Sold | Price | $/sf | Match |
|---|---|---|---|---|---|---|---|
| 126 Forest Trl | 0.00mi | 2/2.0 | 1,324 (+5%) | 1mo | $163,999 | $124 | 90 |
| 256 James Dr | 0.23mi | 2/2.0 | 1,260 (+0%) | 8mo | $135,000 | $107 | 82 |
| 61 Penton Ct | 0.14mi | 3/2.0 (+1) | 1,268 (+1%) | 11mo | $190,000 | $150 | 78 |
| 87 Penton Ct | 0.11mi | 2/2.0 | 1,332 (+6%) | 9mo | $183,500 | $138 | 77 |
| 3340 Browns Rd | 0.35mi | 3/2.0 (+1) | 1,367 (+9%) | 2mo | $210,000 | $154 | 62 |
| 67 Forest Trl | 0.05mi | 3/2.0 (+1) | 1,422 (+13%) | 17mo | $205,000 | $144 | 56 |
| 157 Cattail Curv | 0.28mi | 3/2.0 (+1) | 1,433 (+14%) | 5mo | $205,000 | $143 | 55 |
| 3242 Browns Rd | 0.51mi | 3/2.0 (+1) | 1,375 (+9%) | 3mo | $215,000 | $156 | 53 |
| 125 N Springfield Dr | 0.65mi | 3/2.0 (+1) | 1,346 (+7%) | 2mo | $227,500 | $169 | 51 |
| 82 Swans Way | 0.30mi | 3/2.0 (+1) | 1,377 (+10%) | 17mo | $198,000 | $144 | 51 |
| 54 Meadow Oaks Pl | 0.42mi | 3/2.0 (+1) | 1,392 (+11%) | 15mo | $190,000 | $136 | 45 |
| 109 Mossey Ln | 0.37mi | 3/2.0 (+1) | 1,431 (+14%) | 15mo | $200,000 | $140 | 42 |
Match score weights: distance 35% · size 25% · config 20% · recency 20%. Top-matched comps best support the ARV.
Projected returns pro-forma
-3.0% appreciation · 8.0% rent growth · sell at horizon
- IRR
- -12.4%
- Equity multiple
- 0.53×
- Total profit
- $-23,075
- Equity at exit
- $26,242
- IRR
- 2.9%
- Equity multiple
- 1.26×
- Total profit
- $12,694
- Equity at exit
- $15,217
Cash invested: $49,280 (down + closing). Projections, not guarantees.
Landlord ↔ Tenant lean methodology
- Overall (STATE)
- 90 Strongly Landlord-Friendly
- State Alabama
- 90 Strongly Landlord-Friendly · R+15
- County
- — inherits STATE
- City
- — inherits STATE
ZIP-level market 36054
- Home prices YoY
- -26.9%
- Rents YoY
- 9.0%
- Active inventory
- 84
- Price-to-rent
- 9.8×
Monthly cashflow live
- Estimated rent
- $1,491 medium interval (Pro) →
- Mortgage (P&I)
- −$923
- Tax est. 1.5%
- −$220 /mo · $2,640/yr
- Insurance
- −$73
- HOA
- −$0
- Vacancy / Maint / Mgmt
- −$313
- Net cashflow
- $-39
Break-even live
Sensitivity live
| Price | -10% $83 | -5% $22 | +0% $-39 | +5% $-99 | +10% $-160 |
|---|---|---|---|---|---|
| Rent | -10% $-156 | -5% $-97 | +0% $-39 | +5% $20 | +10% $79 |
| Rate | -1.0pp $50 | -0.5pp $6 | base $-39 | +0.5pp $-84 | +1.0pp $-131 |
UW: 25.0% down · 7.5% · 30yr · 1.5% tax · 5.0% vac · 8.0% maint · 8.0% mgmt
Financing live
Cash to close
- Down payment
- $44,000
- Closing costs
- $5,280
- Reserves months
- —
- Total cash needed
- —
Loan-product check · same deal, 3 products live
Conventional
25% down · 7.5% · 30yr
- Down + closing
- —
- Monthly P&I
- —
- Monthly cashflow
- —
- DSCR
- —
- Eligible?
- —
Personal DTI + credit; lowest rate.
DSCR
20% down · 8.5% · 30yr
- Down + closing
- —
- Monthly P&I
- —
- Monthly cashflow
- —
- DSCR
- —
- Eligible?
- —
No personal income docs; deal must DSCR.
Hard money
10% down · 12.0% · 12mo
- Down + closing
- —
- Monthly P&I
- —
- Monthly cashflow
- —
- DSCR
- —
- Eligible?
- —
Short-term bridge; refi at stabilization.
Rent comps 4 comps
| Address | Beds | Baths | Sqft | Rent | $/sqft | DOM | Units | Dist |
|---|---|---|---|---|---|---|---|---|
| 33 Jamestown Loop Millbrook, AL | 2.0 | 2.0 | 1245 | $1,375 | $1.10 | 15d | 1 | 0.30mi |
| 63 Lilly Pad Cir Millbrook, AL | 3.0 | 2.0 | 1521 | $1,700 | $1.12 | 15d | 1 | 0.44mi |
| 223 S Springfield Dr Millbrook, AL | 3.0 | 2.0 | 1761 | $1,950 | $1.11 | 45d | 1 | 0.66mi |
| 101 Crossings Dr Millbrook, AL | 1.0–3.0 | 1.0–2.0 | 1086 | $1,428 | $1.31 | 15d | 7 | 1.35mi |
Listing history 10 events
-
2026-04-30status Pending
-
2026-04-26historical Contingent
-
2026-04-20status Active
-
2026-04-06historical Contingent
-
2026-03-28$175,999 Active
-
2008-07-30soldstatus $135,000 182-char remark
Show marketing remark (182 chars)
Great home well taken care of. Very convenient to schools and shopping. Large greatroom with fireplace. Kitchen with a breakfast bar and dining area. Split plan. Screened back porch.
-
2008-06-06$135,900 182-char remark
Show marketing remark (182 chars)
Great home well taken care of. Very convenient to schools and shopping. Large greatroom with fireplace. Kitchen with a breakfast bar and dining area. Split plan. Screened back porch.
-
2006-12-27soldstatus $120,000 70-char remark
Show marketing remark (70 chars)
GREAT NEIGHBORHOOD. VERY CONVENIENT TO SCHOOLS, SHOPPING, AND TO I-65.
-
2006-10-09$120,000 70-char remark
Show marketing remark (70 chars)
GREAT NEIGHBORHOOD. VERY CONVENIENT TO SCHOOLS, SHOPPING, AND TO I-65.
-
2003-08-28soldstatus $107,000
ⓘ Source: listings_history table (triggers on properties + properties_extension) + one-shot
backfill from property_details.listing_events for pre-trigger history.
Climate risk First Street
- Flood 1/10 Low FEMA zone X (unshaded) · 0% chance over 30 yrs
- Wildfire 4/10 Moderate
- Heat 7/10 Severe 7 d/yr ≥108°F today · 20 d/yr by 30 yrs out
- Wind 6/10 Major 77% chance of damaging wind over 30 yrs
- Air quality 3/10 Moderate 2 unhealthy d/yr today · 3 by 30 yrs out
Nearby sold comps map
Loading sold comps map…
Walkable amenities ~0.75 mi
Loading nearby amenities…
Taxation est. · year 1
- Rental income
- $17,889
- − Mortgage interest
- −$9,859
- − Property taxes
- −$2,640
- − Insurance
- −$880
- − Repairs & maintenance
- −$1,431
- − Management
- −$1,431
- − Depreciation
- −$5,120
- Taxable loss
- −$3,471
- Est. tax savings @ 24.0%
- +$833
- After-tax cash flow
- $370/yr
For passive investors: Depreciation is non-cash, so a rental often shows a tax loss while cash-flowing — sheltering income. Rental losses are passive: they offset passive income freely, and up to $25,000/yr can offset ordinary (W-2) income if you actively participate and your MAGI is under $100k (phasing out to $0 by $150k); unused losses carry forward. On sale, claimed depreciation is recaptured at up to 25%, and gains may owe capital-gains tax (a 1031 exchange can defer both). Figures are a year-1 estimate at your 24.0% rate — not tax advice; consult a CPA.
Schools (NCES district)
- District
- Elmore County
- NCES district ID
- 0101290
- Math proficiency
- 27% ▼ -25.00%
- Reading proficiency
- 54% ▲ 3.00%
- Median HH income
- $54,898
- Composite
- 35.27/100
- National rank
- #4974
- State rank
- #21 of 129 in AL
Livability — Millbrook
- Score
- 66/100
- State rank
- #110
- US rank
- #12087
Category grades
Schools grade is shown separately in the Schools card above.
Census & demographics
- Census place
- Millbrook, AL
- County
- Elmore County · 36,842 people
- City population
- 14,600
- Metro
- Montgomery, AL
- Population (ZIP)
- 14,600
- Household income
- $68,438
- Rent vs Own
- Severe rent burden
- 201.0
Population outlook (Elmore County) Hauer SSP2
- Today (2025)
- 85,154 people
- By 2030
- 86,667 · +1.8%
- By 2040
- 89,014 · +4.5%
- By 2050
- 90,331 · +6.1%
- By 2075
- 96,096 · +12.8%
- By 2100
- 95,290 · +11.9%
Race, ethnicity, and origin ACS 2023
- Neighborhood character
- Diverse neighborhood (Simpson 0.56)
- Race & ethnicity
- White 60% Black 27% Hispanic / Latino 7% Two or more races 5% Asian 1%
- Hispanic origin (detail)
- Mexican 5%
- Common ancestry
- Italian 2% Slovak 1% Lithuanian 1%
- Foreign-born
- 3% · Canada
- Languages at home
- 94% English-only · Spanish 5% Other Indo-European 0%
Political lean MEDSL · Elmore
- 2024 margin
- Solid R (+52.1) · D 23.6% · R 75.6%
- 2008→2024 swing
- -1.1pp toward R · 2008: -50.9pp · 2024: -52.1pp
- All cycles
- 2024: R+52.1 2020: R+48.2 2016: R+52.0 2012: R+48.8 2008: R+50.9
Not yet ingested
- Civics
- —
Market trends
- HPI YoY
- ▼ -55.96%
- Current HPI
- 151.6671
- Rent YoY
- ▲ 9.03%
- Metro
- Montgomery, AL
- State GDP YoY
- ▲ 2.94%
- F500 in state
- 4
Industry mix (Fortune 500 HQ in AL)
| Industry | F500 HQs | Revenue |
|---|---|---|
| Financial Services | 1 | $8B |
|
||
| Healthcare | 1 | $5B |
|
||
Price history
+64.5% since first listed10 events — show timeline
- 2026-04-30 Pending — MAAR
- 2026-04-26 Contingent — MAAR
- 2026-04-20 Relisted — MAAR
- 2026-04-06 Contingent — MAAR
- 2026-03-28 Listed $175,999 MAAR
- 2008-07-30 Sold (MLS) $135,000 MAAR
- 2008-06-06 Listed $135,900 MAAR
- 2006-12-27 Sold (MLS) $120,000 MAAR
- 2006-10-09 Listed $120,000 MAAR
- 2003-08-28 Sold (Public Records) $107,000 Public Records
Property tax history
-1.9%/yrLatest (2017): $349 · -5.8% YoY. Source: county tax records.
Cash-flow waterfall
monthlySold comps — $/sqft
last 12 mo · ≤1 miLoading sold comps…