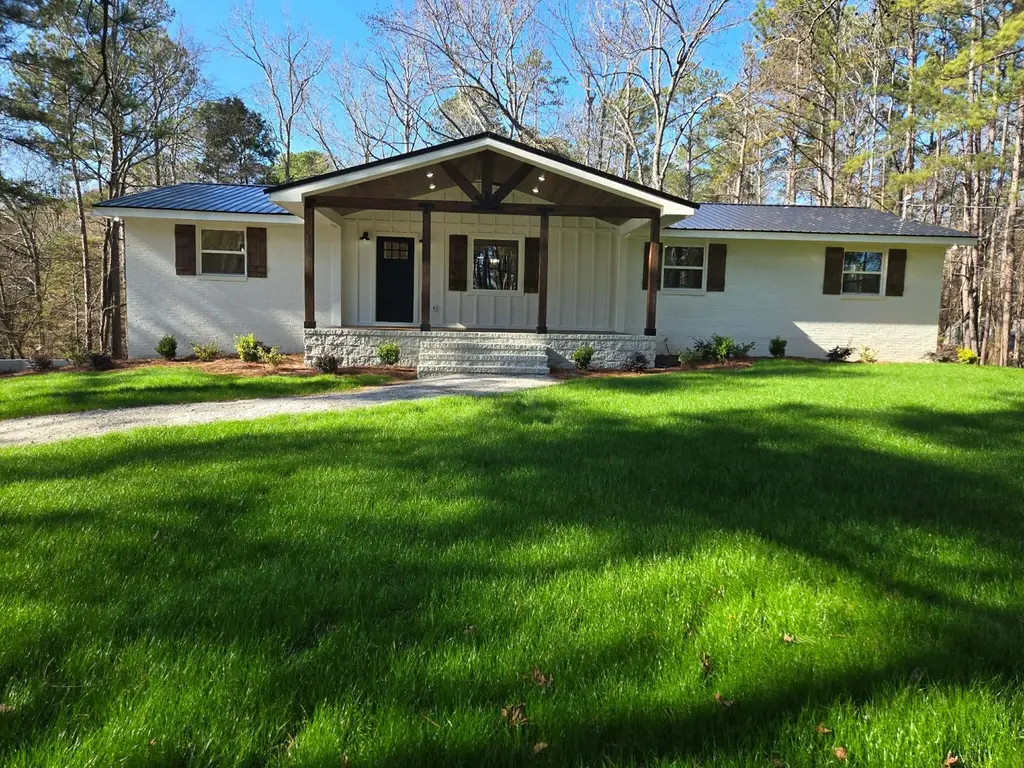
3428 Ray Owens Rd · Appling, GA
Flood risk 1/10 · Minimal
- FEMA flood zone
- X (unshaded)
- Chance of flooding over 30 yrs
- 0.0%
- Est. flood insurance / yr
- $507 – $1,088
Fire risk 4/10 · Minor
- Est. fire insurance / yr
- $963 – $1,789
Heat risk 6/10 · Moderate
- Hot days now (above 106°F)
- 7 days/yr
- Hot days in 30 yrs
- 17 days/yr
Wind risk 6/10 · Moderate
- Chance of severe wind over 30 yrs
- 57.0%
Air-quality risk 2/10 · Minimal
- Unhealthy air days now
- 1 days/yr
- Unhealthy air days in 30 yrs
- 1 days/yr
Risk factors via First Street. Map © Google.
Why this score? — see what drove the D grade
The composite is a weighted blend of 9 inputs, each scored 0–100. Each bar is that input's sub-score; the figure is the points it added to the 100-point composite (weight × sub-score).
- ARV discount +14.7/15.0
- Appreciation +10.0/10.0
- Schools +4.5/10.0
- Cash flow +3.5/30.0
- Livability +2.9/5.0
- Rent growth +2.5/5.0
- Condition / age +2.5/5.0
- 1% rule +0.0/10.0
- DSCR +0.0/10.0
$459,900
🖨 Deal sheet 📄 Offer letter ✓ Due diligence
Listing remarks
Completely Remodeled Brick Home on 4 Private Acres with Metal Roof & Unfinished Basement Flex Space. Welcome to this beautifully renovated brick home offering 2,050 heated and finished square feet of stylish living space, perfectly situated on 4 private acres. Enjoy peaceful mornings on the 24x10 covered front porch featuring a stunning tongue-and-groove pine ceiling, and unwind in the evenings on the 12x16 covered rear deck overlooking a large, private backyard with freshly cleared land and new grass planted. Inside, this home has been completely remodeled with knotty pine wood flooring throughout, complemented by tile bathrooms and a modern, cohesive design. The kitchen and baths fe
Key facts
- Private acres
- Covered front porch
- Private backyard
Tags
Property features AI
Finance
- Other: Property listed by REALTORS® of Greater Augusta
Exterior
- Parking: Garage with 2 parking spaces
- Utilities: Well water; Septic tank
- Home design: Single-family residence; Residential property
- Construction: Fiber cement exterior; Other foundation
- Exterior features: Composition roof; Approximately 4.12-acre lot
Interior
- Kitchen: Range, Dishwasher, Microwave
- Bedrooms: 7 total rooms (bedroom count not specified)
- Flooring: Concrete; Ceramic tile; Hardwood
- Bathrooms: 2 full bathrooms
- Heating & cooling: Central air; Ceiling fans; Electric heating; Fireplace(s)
- Interior features: Range, Dishwasher, Microwave; Concrete, Ceramic tile, Hardwood flooring; No basement
Neighborhood map
What this means for you Summary
Snapshot
- This is a 3-bed/3.0-bath other listed at $460k.
Deal economics
- At list price, monthly cash flow is $-1k ($-17k/yr) — negative.
- To cash-flow at today's rent, offer at most $214k (53.4% below list).
- To meet the 1% rule (rent ≥ 1% of price), the offer needs to be $186k (59.6% below list).
- Recommended offer: $186k (59.6% below list) — sets the bar for 1% rule.
- Cap rate 2.7% vs local median 1.1% in Appling — top-decile yield for the area; either an underpriced asset or a hidden risk that comps aren't pricing in. Stress-test before assuming the spread holds.
Location & tenants
- Location reads 57/100 on livability (#457 in GA) — a working-class tenant base; expect higher turnover. Strengths: cost of living A; Watch: housing D+, amenities F, commute F.
- Columbia County (suburban): math 49% / reading 52% proficiency, ranked #13 of 174 in GA (top 8%) — acceptable for families but not a draw, mixed tenant base, ~2y average lease.
- Zoned schools: North Columbia Elementary School (math 67% / reading 67%, grade B+, #79 of 1,228 statewide, top 7%, 459 students, 22% FRL); Harlem Middle School (math 36% / reading 42%, grade F, #155 of 470 statewide, top 33%, 981 students, 39% FRL); Harlem High School (math 8% / reading 22%, grade F, #297 of 424 statewide, top 74%, 1,223 students, 33% FRL).
- Market conditions: 154 active listings in the ZIP; 1,213 units permitted in Columbia County in 2024 (0 in 5+ unit buildings).
Forward outlook
- In year one you build about $49k of equity ($3k loan paydown + $46k appreciation (10.0% local appreciation)).
- Columbia County population projected at +62% by 2050 — long-run rental-demand tailwind backs the buy-and-hold thesis.
- By year 2, paydown + projected appreciation supports a ~$79k cash-out refi (75% LTV) — recoverable capital for the next deal without selling this one.
Negotiation context
- It's been on market 36 days — a 3% lower offer ($446k) is reasonable based on typical stale-listing flexibility.
- 3 sale attempts; this cycle's ask has dropped $30k (6%) from the opening price — seller is motivated, your offer sets the floor, not the list.
- Current owner paid $150k; list at $460k implies a 207% gain — meaningful room to come down on a strong offer.
Risks & watch-outs
- Climate carrying-cost: major wind risk, 57% chance of damaging wind over 30y; extreme-heat days projected 7→17/yr by 2055 (HVAC capex compounding) — expect insurance premiums to compound above CPI over the hold.
Questions for the listing agent
- What do current leases actually rent for vs. the listed asking? Can we see a recent rent roll and the last 12 months of T-12 income?
- It's been on market 36 days. Have you received any prior offers? Is the seller open to a 60% concession, seller financing, or rate buy-down credit?
- Built in 1974 — when were the roof, HVAC, electrical panel, plumbing, and water heater last replaced?
- Is there a deadline driving the sale (1031 exchange, divorce, estate, relocation)? That informs how much negotiation room exists.
- The area grade is low — what's the realistic commute time and amenity access for the typical tenant pool here? Any planned neighborhood developments (good or bad) we should know about?
- What's the average days-on-market for RENTAL listings here right now (not sales)? A rising rental-DOM trend means longer vacancies and softer asking-rent achievability than the comps imply.
- What's the recent tenant-quality profile in this submarket — average credit score on applications, eviction rate, late-payment / NSF rate, and stable-employment percentage? A property-management company in the area should have these aggregated.
- How much new for-sale + rental construction is in the pipeline within 1–3 miles? Heavy new supply typically softens prices + rents 12–24 months out; constrained supply supports both.
Investment metrics
- 1% rule
- 0.40% ✗
- Cap rate
- 2.67%
- Cash-on-cash
- -12.95%
- DSCR
- 0.42
- GRM
- 20.6
CMA / ARV
- ARV (median comp)
- $547,958
- List price
- $459,900
- Delta
- -16.07%
- Verdict
- UNDERPRICED
- Comps
- 3 within 1.0 mi
Projected returns pro-forma
10.0% appreciation · 3.0% rent growth · sell at horizon
- IRR
- 15.2%
- Equity multiple
- 2.26×
- Total profit
- $161,797
- Equity at exit
- $414,314
- IRR
- 14.9%
- Equity multiple
- 5.24×
- Total profit
- $545,733
- Equity at exit
- $893,485
Cash invested: $128,772 (down + closing). Projections, not guarantees.
Landlord ↔ Tenant lean methodology
- Overall (STATE)
- 90 Strongly Landlord-Friendly
- State Georgia
- 90 Strongly Landlord-Friendly · R+3
- County
- — inherits STATE
- City
- — inherits STATE
ZIP-level market 30802
- Home prices YoY
- 4.8%
- Active inventory
- 154
- Price-to-rent
- 20.6×
Monthly cashflow live
- Estimated rent
- $1,860 medium interval (Pro) →
- Mortgage (P&I)
- −$2,412
- Tax from tax record
- −$255 /mo · $3,065/yr
- Insurance
- −$192
- HOA
- −$0
- Vacancy / Maint / Mgmt
- −$391
- Net cashflow
- $-1,390
Break-even live
UW: 25.0% down · 7.5% · 30yr · 1.5% tax · 5.0% vac · 8.0% maint · 8.0% mgmt
Financing live
Cash to close
- Down payment
- $114,975
- Closing costs
- $13,797
- Reserves months
- —
- Total cash needed
- —
Loan-product check · same deal, 3 products live
Conventional
25% down · 7.5% · 30yr
- Down + closing
- —
- Monthly P&I
- —
- Monthly cashflow
- —
- DSCR
- —
- Eligible?
- —
Personal DTI + credit; lowest rate.
DSCR
20% down · 8.5% · 30yr
- Down + closing
- —
- Monthly P&I
- —
- Monthly cashflow
- —
- DSCR
- —
- Eligible?
- —
No personal income docs; deal must DSCR.
Hard money
10% down · 12.0% · 12mo
- Down + closing
- —
- Monthly P&I
- —
- Monthly cashflow
- —
- DSCR
- —
- Eligible?
- —
Short-term bridge; refi at stabilization.
Listing history 20 events
-
2026-06-18days on market $459,900 Active 36 DOM
-
2026-06-17days on market $459,900 Active 35 DOM
-
2026-06-16days on market $459,900 Active 34 DOM
-
2026-06-15days on market $459,900 Active 33 DOM
-
2026-06-14days on market $459,900 Active 31 DOM
-
2026-06-13days on market $459,900 Active 30 DOM
-
2026-06-10days on market $459,900 Active 28 DOM
-
2026-06-09days on market $459,900 Active 27 DOM
-
2026-06-08days on market $459,900 Active 26 DOM
-
2026-06-07days on market $459,900 Active 25 DOM
-
2026-06-03days on market $459,900 Active 21 DOM
-
2026-06-02days on market $459,900 Active 20 DOM
-
2026-06-01days on market $459,900 Active 19 DOM
-
2026-05-31days on market $459,900 Active 18 DOM
-
2026-05-11historical
-
2026-04-12price $459,900
-
2026-01-13price $469,900
-
2025-12-24$489,900 Active
-
2025-12-24$459,900 Active 1149-char remark
-
2025-04-21soldstatus $150,000
ⓘ Source: listings_history table (triggers on properties + properties_extension) + one-shot
backfill from property_details.listing_events for pre-trigger history.
Tax reassessment forecast GA · Resets to sale price
- Current annual tax
- $3,065 · $255/mo
- Projected year-2 tax
- $4,231 · $353/mo
- Expected delta
- +$1,166/yr (+$97/mo · 38.0%)
ⓘ Screening estimate from a state-policy table — verify with the county assessor before closing.
Climate risk First Street
- Flood 1/10 Low FEMA zone X (unshaded) · 0% chance over 30 yrs
- Wildfire 4/10 Moderate
- Heat 6/10 Major 7 d/yr ≥106°F today · 17 d/yr by 30 yrs out
- Wind 6/10 Major 57% chance of damaging wind over 30 yrs
- Air quality 2/10 Low 1 unhealthy d/yr today · 1 by 30 yrs out
Nearby sold comps map
Loading sold comps map…
Walkable amenities ~0.75 mi
Loading nearby amenities…
Taxation est. · year 1
- Rental income
- $22,316
- − Mortgage interest
- −$25,762
- − Property taxes
- −$3,065
- − Insurance
- −$2,300
- − Repairs & maintenance
- −$1,785
- − Management
- −$1,785
- − Depreciation
- −$13,379
- Taxable loss
- −$25,759
- Est. tax savings @ 24.0%
- +$6,182
- After-tax cash flow
- $-10,494/yr
For passive investors: Depreciation is non-cash, so a rental often shows a tax loss while cash-flowing — sheltering income. Rental losses are passive: they offset passive income freely, and up to $25,000/yr can offset ordinary (W-2) income if you actively participate and your MAGI is under $100k (phasing out to $0 by $150k); unused losses carry forward. On sale, claimed depreciation is recaptured at up to 25%, and gains may owe capital-gains tax (a 1031 exchange can defer both). Figures are a year-1 estimate at your 24.0% rate — not tax advice; consult a CPA.
Schools (NCES district)
- District
- Columbia County
- NCES district ID
- 1301410
- Math proficiency
- 49% ▼ -6.00%
- Reading proficiency
- 52% ▼ -4.00%
- Median HH income
- $69,358
- Composite
- 45.04/100
- National rank
- #2695
- State rank
- #13 of 174 in GA
Livability — Appling
- Score
- 57/100
- State rank
- #457
- US rank
- #21719
Category grades
Schools grade is shown separately in the Schools card above.
Census & demographics
- Population (ZIP)
- 6,375
Population outlook (Columbia County) Hauer SSP2
- Today (2025)
- 189,073 people
- By 2030
- 212,277 · +12.3%
- By 2040
- 259,480 · +37.2%
- By 2050
- 306,991 · +62.4%
- By 2075
- 421,213 · +122.8%
- By 2100
- 496,722 · +162.7%
Race, ethnicity, and origin ACS 2023
- Neighborhood character
- Predominantly White (74%)
- Race & ethnicity
- White 74% Black 17% Two or more races 7% Hispanic / Latino 3%
- Common ancestry
- Serbian 3% Slovak 1% Italian 1%
- Foreign-born
- 1% · Canada
- Languages at home
- 97% English-only · Spanish 2%
Political lean MEDSL · Columbia
- 2024 margin
- Strong R (+25.6) · D 36.8% · R 62.5%
- 2008→2024 swing
- +17.0pp toward D · 2008: -42.7pp · 2024: -25.6pp
- All cycles
- 2024: R+25.6 2020: R+25.8 2016: R+37.7 2012: R+43.0 2008: R+42.7
Not yet ingested
- Civics
- —
Market trends
- HPI YoY
- ▲ 15.67%
- Current HPI
- 339.0061
- Rent YoY
- —
- Metro
- —
- State GDP YoY
- ▲ 2.66%
- F500 in state
- 28
Industry mix (Fortune 500 HQ in GA)
| Industry | F500 HQs | Revenue |
|---|---|---|
| Paper / Packaging | 2 | $29B |
|
||
| Retail | 1 | $160B |
|
||
| Transportation / Logistics | 1 | $91B |
|
||
| Airlines | 1 | $62B |
|
||
| Consumer Goods | 1 | $47B |
|
||
| Utilities | 1 | $25B |
|
||
Price history
+206.6% since first listed8 events — show timeline
- 2026-05-30 Relisted — Hive MLS
- 2026-05-28 Listing Removed — Hive MLS
- 2026-05-11 Listing Removed — Hive MLS
- 2026-04-12 Price Changed $459,900 Hive MLS
- 2026-01-13 Price Changed $469,900 Hive MLS
- 2025-12-24 Listed $489,900 Hive MLS
- 2025-12-24 Listed $459,900 Hive MLS
- 2025-04-21 Sold (Public Records) $150,000 Public Records
Property tax history
+14.2%/yrLatest (2025): $3,065 · +30.4% YoY. Source: county tax records.
Cash-flow waterfall
monthlySold comps — $/sqft
last 12 mo · ≤1 miLoading sold comps…