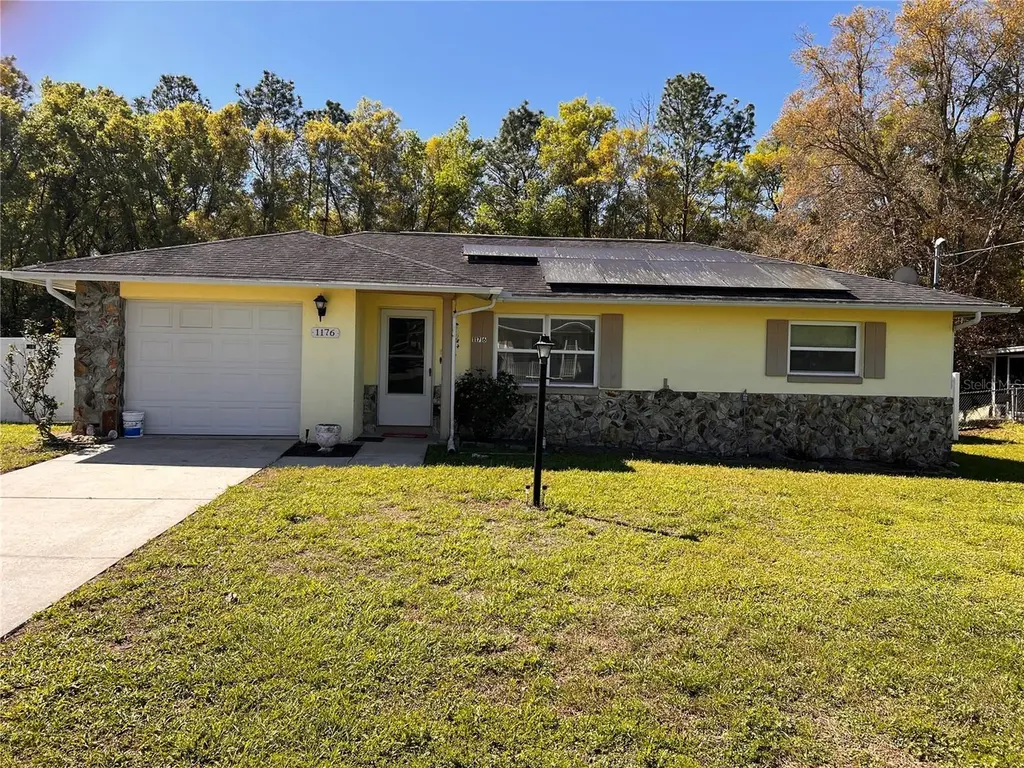
1176 W Buttonbush Dr · Pine Ridge, FL
Flood risk 5/10 · Moderate
- FEMA flood zone
- X (unshaded)
- Chance of flooding over 30 yrs
- 0.27%
- Est. flood insurance / yr
- $507 – $1,088
Fire risk 4/10 · Minor
- Est. fire insurance / yr
- $947 – $1,759
Heat risk 9/10 · Severe
- Hot days now (above 108°F)
- 7 days/yr
- Hot days in 30 yrs
- 23 days/yr
Wind risk 9/10 · Severe
- Chance of severe wind over 30 yrs
- 99.0%
Air-quality risk 1/10 · Minimal
- Unhealthy air days now
- 0 days/yr
- Unhealthy air days in 30 yrs
- 0 days/yr
Risk factors via First Street. Map © Google.
Why this score? — see what drove the F grade
The composite is a weighted blend of 9 inputs, each scored 0–100. Each bar is that input's sub-score; the figure is the points it added to the 100-point composite (weight × sub-score).
- Cash flow +11.5/30.0
- ARV discount +4.8/15.0
- Schools +4.1/10.0
- DSCR +3.4/10.0
- Livability +3.4/5.0
- 1% rule +2.6/10.0
- Rent growth +2.5/5.0
- Condition / age +2.5/5.0
- Appreciation +0.0/10.0
$179,900
🖨 Deal sheet (PDF) 📄 Offer letter ✓ Due diligence
Listing remarks
Welcome to your slice of sunny Florida living at 1176 W Buttonbush in Beverly Hills! This charming 2-bedroom, 1-1/2 bath home features an additional bonus room that can easily be used as a third bedroom, home office, or flex space to fit your needs. Nestled in a growing and desirable area, you’ll enjoy convenient access to new restaurants, shopping, and medical facilities, along with nearby interstates for an easy commute. Step outside and fall in love with the spacious, fully fenced backyard—perfect for entertaining, pets, or family fun. Take a dip in the above-ground pool or relax in your private outdoor oasis with no rear neighbors. The property backs up to protected land, en
Key facts
- Above-ground pool
- 9,385 sq ft lot
- Garage
Tags
Property features AI
Finance
- Other: Unfurnished; Lot about 0.21 acre
Exterior
- Parking: Attached garage (1 car)
- Utilities: Public water; Public sewer; Cable available; Solar energy
- Home design: Single family residence; Residential property; One story; Faces west
- Construction: Built with block, concrete, stone and stucco; Shingle roof; Slab foundation
- Exterior features: Private mailbox; Above-ground private pool; Asphalt road access
Interior
- Kitchen: Cooktop; Refrigerator
- Bedrooms: 2 bedrooms
- Flooring: Carpet; Tile
- Bathrooms: 1 full bath; 1 half bath
- Heating & cooling: Electric heat; Heat pump; Central air conditioning
- Interior features: Ceiling fans
- Laundry & utility: Washer; Dryer; Electric dryer hookup in garage
Neighborhood map
What this means for you Summary
Snapshot
- This is a 2-bed/1.5-bath single-family listed at $180k.
Deal economics
- At list price, monthly cash flow is $-59 ($-712/yr) — negative.
- To cash-flow at today's rent, offer at most $169k (5.8% below list).
- To meet the 1% rule (rent ≥ 1% of price), the offer needs to be $137k (24.0% below list).
- Recommended offer: $137k (24.0% below list) — sets the bar for 1% rule.
- Cap rate 5.9% vs local median 3.4% in Pine Ridge — top-decile yield for the area; either an underpriced asset or a hidden risk that comps aren't pricing in. Stress-test before assuming the spread holds.
Location & tenants
- Location reads 67/100 on livability (#565 in FL) — a middle-class / working-renter tenant base. Strengths: crime A+, housing A+, cost of living A-; Watch: health & safety C-, amenities F, commute F.
- Citrus (rural): math 49% / reading 50% proficiency, ranked #44 of 73 in FL (top 60%) — families likely to look elsewhere, expect single-tenant / working-renter base with shorter leases.
- Zoned schools: Forest Ridge Elementary School (math 55% / reading 59%, grade C+, #781 of 2,144 statewide, top 38%, 708 students, 67% FRL); Lecanto High School (math 46% / reading 53%, grade D, #179 of 667 statewide, top 29%, 1,630 students, 46% FRL) — zoned schools at 56% FRL track the district average.
- Market conditions: 396 active listings in the ZIP; 10 comparable units currently listed for rent nearby; rentals at typical pace (median 22d on market — plan ~3-4 weeks tenant-placement turnaround); 2,443 units permitted in Citrus County in 2024 (0 in 5+ unit buildings).
Forward outlook
- Local home prices are declining (-3.0%/yr); year-one equity from $1k of loan paydown is wiped out by about $5k of value loss. Plan a longer hold.
- Citrus County population projected to shrink 10% by 2050 — rents likely to lag national; underwrite the cash flow, not the appreciation.
Negotiation context
- It's been on market 81 days — a 6% lower offer ($169k) is reasonable based on typical stale-listing flexibility.
- Current owner paid $80k; list at $180k implies a 124% gain — meaningful room to come down on a strong offer.
Risks & watch-outs
- Climate carrying-cost: moderate flood risk; severe wind risk, 99% chance of damaging wind over 30y; extreme-heat days projected 7→23/yr by 2055 (HVAC capex compounding) — expect insurance premiums to compound above CPI over the hold.
Questions for the listing agent
- What do current leases actually rent for vs. the listed asking? Can we see a recent rent roll and the last 12 months of T-12 income?
- It's been on market 81 days. Have you received any prior offers? Is the seller open to a 24% concession, seller financing, or rate buy-down credit?
- Why hasn't it sold? Are there any deal-killer items the seller is aware of (foundation, flood, title, zoning, code violations)?
- Is there a deadline driving the sale (1031 exchange, divorce, estate, relocation)? That informs how much negotiation room exists.
- Schools are F-rated, which usually means shorter tenancies and higher turnover. Who's the typical renter profile here, and what's been the actual vacancy rate?
- The area grade is low — what's the realistic commute time and amenity access for the typical tenant pool here? Any planned neighborhood developments (good or bad) we should know about?
- What's the average days-on-market for RENTAL listings here right now (not sales)? A rising rental-DOM trend means longer vacancies and softer asking-rent achievability than the comps imply.
- What's the recent tenant-quality profile in this submarket — average credit score on applications, eviction rate, late-payment / NSF rate, and stable-employment percentage? A property-management company in the area should have these aggregated.
- How much new for-sale + rental construction is in the pipeline within 1–3 miles? Heavy new supply typically softens prices + rents 12–24 months out; constrained supply supports both.
Investment metrics
- 1% rule
- 0.76% ✗
- Cap rate
- 5.90%
- Cash-on-cash
- -1.41%
- DSCR
- 0.94
- GRM
- 11.0
CMA / ARV
- ARV (on-the-fly)
- $169,632
- Comps found
- 12
Show comp detail 12 sales within ~0.75 mi
| Address | Dist | Beds/Ba | Sqft | Sold | Price | $/sf | Match |
|---|---|---|---|---|---|---|---|
| 99 S Lucille St | 0.16mi | 2/2.0 | 1,016 (+2%) | 7mo | $205,000 | $202 | 81 |
| 206 S Desoto St | 0.35mi | 2/1.5 | 1,064 (+7%) | 8mo | $204,000 | $192 | 65 |
| 95 S Fillmore St | 0.56mi | 2/1.0 | 1,040 (+5%) | 4mo | $142,500 | $137 | 61 |
| 58 S Columbus St | 0.53mi | 2/1.0 | 950 (-4%) | 8mo | $130,000 | $137 | 60 |
| 204 S Davis St | 0.40mi | 2/1.5 | 1,134 (+14%) | 1mo | $189,000 | $167 | 57 |
| 303 S Fillmore St | 0.61mi | 2/1.5 | 1,064 (+7%) | 8mo | $205,000 | $193 | 53 |
| 49 S Osceola St | 0.54mi | 2/1.0 | 1,112 (+12%) | 1mo | $153,600 | $138 | 52 |
| 36 S Lucille St | 0.61mi | 2/1.0 | 908 (-8%) | 4mo | $190,000 | $209 | 52 |
| 73 S Lincoln Ave | 0.57mi | 2/1.0 | 1,108 (+12%) | 6mo | $190,000 | $171 | 47 |
| 75 Rose Ave | 0.66mi | 2/1.0 | 864 (-13%) | 2mo | $170,000 | $197 | 44 |
| 3621 N Lucille Dr | 0.71mi | 2/2.0 | 1,080 (+9%) | 9mo | $159,900 | $148 | 43 |
| 41 S Lincoln Ave | 0.73mi | 2/2.0 | 874 (-12%) | 6mo | $130,000 | $149 | 39 |
Match score weights: distance 35% · size 25% · config 20% · recency 20%. Top-matched comps best support the ARV.
Projected returns pro-forma
-3.0% appreciation · 3.0% rent growth · sell at horizon
- IRR
- -18.7%
- Equity multiple
- 0.35×
- Total profit
- $-32,972
- Equity at exit
- $26,824
- IRR
- -11.2%
- Equity multiple
- 0.33×
- Total profit
- $-33,751
- Equity at exit
- $15,554
Cash invested: $50,372 (down + closing). Projections, not guarantees.
Landlord ↔ Tenant lean methodology
- Overall (STATE)
- 87 Strongly Landlord-Friendly
- State Florida
- 87 Strongly Landlord-Friendly · R+3
- County
- — inherits STATE
- City
- — inherits STATE
ZIP-level market 34465
- Home prices YoY
- -33.1%
- Active inventory
- 396
- Price-to-rent
- 11.0×
Monthly cashflow live
- Estimated rent
- $1,367 high interval (Pro) →
- Mortgage (P&I)
- −$943
- Tax from tax record
- −$121 /mo · $1,451/yr
- Insurance
- −$75
- HOA
- −$0
- Vacancy / Maint / Mgmt
- −$287
- Net cashflow
- $-59
Break-even live
Sensitivity live
| Price | -10% $43 | -5% $-8 | +0% $-59 | +5% $-110 | +10% $-161 |
|---|---|---|---|---|---|
| Rent | -10% $-167 | -5% $-113 | +0% $-59 | +5% $-5 | +10% $49 |
| Rate | -1.0pp $31 | -0.5pp $-14 | base $-59 | +0.5pp $-106 | +1.0pp $-153 |
UW: 25.0% down · 7.5% · 30yr · 1.5% tax · 5.0% vac · 8.0% maint · 8.0% mgmt
Financing live
Cash to close
- Down payment
- $44,975
- Closing costs
- $5,397
- Reserves months
- —
- Total cash needed
- —
Loan-product check · same deal, 3 products live
Conventional
25% down · 7.5% · 30yr
- Down + closing
- —
- Monthly P&I
- —
- Monthly cashflow
- —
- DSCR
- —
- Eligible?
- —
Personal DTI + credit; lowest rate.
DSCR
20% down · 8.5% · 30yr
- Down + closing
- —
- Monthly P&I
- —
- Monthly cashflow
- —
- DSCR
- —
- Eligible?
- —
No personal income docs; deal must DSCR.
Hard money
10% down · 12.0% · 12mo
- Down + closing
- —
- Monthly P&I
- —
- Monthly cashflow
- —
- DSCR
- —
- Eligible?
- —
Short-term bridge; refi at stabilization.
Rent comps 10 comps
| Address | Beds | Baths | Sqft | Rent | $/sqft | DOM | Units | Dist |
|---|---|---|---|---|---|---|---|---|
| 95 S Fillmore St Beverly Hills, FL | 2.0 | 1.0 | 1056 | $1,300 | $1.23 | 22d | 1 | 0.60mi |
| 45 S Jackson St Beverly Hills, FL | 2.0 | 1.0 | 1108 | $1,275 | $1.15 | 22d | 1 | 0.92mi |
| 41 S Monroe St Beverly Hills, FL | 2.0 | 1.0 | 932 | $1,300 | $1.39 | 22d | 1 | 0.98mi |
| 5 New North Ct Beverly Hills, FL | 1.0 | 1.0 | 864 | $1,100 | $1.27 | 22d | 1 | 1.02mi |
| 17 N Davis St Beverly Hills, FL | 2.0 | 1.0 | 1108 | $1,000 | $0.90 | 22d | 1 | 1.09mi |
| 7 Donna Ct Beverly Hills, FL | 1.0 | 1.0 | 675 | $1,225 | $1.81 | 22d | 1 | 1.15mi |
| 31 S Barbour St Beverly Hills, FL | 2.0 | 1.0 | 1027 | $1,525 | $1.48 | 22d | 1 | 1.16mi |
| 12 Montana St Beverly Hills, FL | 2.0 | 1.0 | 1088 | $1,700 | $1.56 | 22d | 1 | 1.21mi |
| 11 S Barbour St Beverly Hills, FL | 2.0 | 1.0 | 808 | $1,349 | $1.67 | 22d | 1 | 1.25mi |
| 13 S Washington St Beverly Hills, FL | 3.0 | 1.0 | 1062 | $1,350 | $1.27 | 22d | 1 | 1.33mi |
Listing history 16 events
-
2026-06-19days on market $179,900 Active 81 DOM
-
2026-06-18days on market $179,900 Active 80 DOM
-
2026-06-17days on market $179,900 Active 79 DOM
-
2026-06-16days on market $179,900 Active 78 DOM
-
2026-06-15days on market $179,900 Active 77 DOM
-
2026-06-14days on market $179,900 Active 75 DOM
-
2026-06-13pricedays on market $179,900 Active 74 DOM
-
2026-06-09days on market $185,000 Active 71 DOM
-
2026-06-08days on market $185,000 Active 70 DOM
-
2026-06-07pricestatusdays on market $185,000 Active 69 DOM
-
2026-05-25status Pending
-
2026-04-24price $197,500
-
2026-04-06price $205,000
-
2026-03-19$215,000 Active
-
2020-10-21soldstatus $80,200
-
1986-06-01soldstatus $44,900
ⓘ Source: listings_history table (triggers on properties + properties_extension) + one-shot
backfill from property_details.listing_events for pre-trigger history.
Tax reassessment forecast FL · Resets to sale price
- Current annual tax
- $1,451 · $121/mo
- Projected year-2 tax
- $1,493 · $124/mo
- Expected delta
- +$43/yr (+$4/mo · 2.9%)
ⓘ Screening estimate from a state-policy table — verify with the county assessor before closing.
Climate risk First Street
- Flood 5/10 Major FEMA zone X (unshaded) · 27% chance over 30 yrs
- Wildfire 4/10 Moderate
- Heat 9/10 Extreme 7 d/yr ≥108°F today · 23 d/yr by 30 yrs out
- Wind 9/10 Extreme 99% chance of damaging wind over 30 yrs
- Air quality 1/10 Low 0 unhealthy d/yr today · 0 by 30 yrs out
Nearby sold comps map
Loading sold comps map…
Walkable amenities ~0.75 mi
Loading nearby amenities…
Taxation est. · year 1
- Rental income
- $16,404
- − Mortgage interest
- −$10,077
- − Property taxes
- −$1,451
- − Insurance
- −$900
- − Repairs & maintenance
- −$1,312
- − Management
- −$1,312
- − Depreciation
- −$5,233
- Taxable loss
- −$3,881
- Est. tax savings @ 24.0%
- +$931
- After-tax cash flow
- $220/yr
For passive investors: Depreciation is non-cash, so a rental often shows a tax loss while cash-flowing — sheltering income. Rental losses are passive: they offset passive income freely, and up to $25,000/yr can offset ordinary (W-2) income if you actively participate and your MAGI is under $100k (phasing out to $0 by $150k); unused losses carry forward. On sale, claimed depreciation is recaptured at up to 25%, and gains may owe capital-gains tax (a 1031 exchange can defer both). Figures are a year-1 estimate at your 24.0% rate — not tax advice; consult a CPA.
Schools (NCES district)
- District
- Citrus
- NCES district ID
- 1200270
- Math proficiency
- 49% ▼ -10.00%
- Reading proficiency
- 50% ▼ -6.00%
- Median HH income
- $38,618
- Composite
- 41.28/100
- National rank
- #3519
- State rank
- #44 of 73 in FL
Livability — Pine Ridge
- Score
- 67/100
- State rank
- #565
- US rank
- #10798
Category grades
Schools grade is shown separately in the Schools card above.
Census & demographics
- Census place
- Pine Ridge, FL
- County
- Citrus County · 111,314 people
- City population
- 18,514
- Metro
- Homosassa Springs, FL
- Population (ZIP)
- 18,879
- Household income
- $54,869
- Rent vs Own
- Severe rent burden
- 334.0
Population outlook (Citrus County) Hauer SSP2
- Today (2025)
- 138,622 people
- By 2030
- 136,886 · -1.3%
- By 2040
- 132,009 · -4.8%
- By 2050
- 125,196 · -9.7%
- By 2075
- 108,570 · -21.7%
- By 2100
- 84,454 · -39.1%
Race, ethnicity, and origin ACS 2023
- Neighborhood character
- Predominantly White (82%)
- Race & ethnicity
- White 82% Hispanic / Latino 8% Black 4% Two or more races 3% Asian 2%
- Hispanic origin (detail)
- Mexican 1% Puerto Rican 3%
- Common ancestry
- Romanian 4% Lithuanian 3% Slovak 2%
- Foreign-born
- 8% · Canada, Vietnam, Dominican Republic
- Languages at home
- 93% English-only · Spanish 4% French/Haitian/Cajun 1% Other Asian/Pacific 1%
Political lean MEDSL · Citrus
- 2024 margin
- Solid R (+45.9) · D 26.8% · R 72.6%
- 2008→2024 swing
- -29.8pp toward R · 2008: -16.1pp · 2024: -45.9pp
- All cycles
- 2024: R+45.9 2020: R+41.0 2016: R+39.7 2012: R+21.9 2008: R+16.1
Not yet ingested
- Civics
- —
Market trends
- HPI YoY
- ▼ -138.62%
- Current HPI
- 279.7183
- Rent YoY
- —
- Metro
- Homosassa Springs, FL
- State GDP YoY
- ▲ 3.28%
- F500 in state
- 36
Industry mix (Fortune 500 HQ in FL)
| Industry | F500 HQs | Revenue |
|---|---|---|
| Industrial Technology | 2 | $29B |
|
||
| Insurance | 2 | $17B |
|
||
| Retail | 1 | $60B |
|
||
| Technology Distribution | 1 | $58B |
|
||
| Homebuilding | 1 | $35B |
|
||
| Technology Manufacturing | 1 | $35B |
|
||
Price history
+339.9% since first listed6 events — show timeline
- 2026-05-25 Pending — Stellar MLS as Distributed by MLS Grid
- 2026-04-24 Price Changed $197,500 Stellar MLS as Distributed by MLS Grid
- 2026-04-06 Price Changed $205,000 Stellar MLS as Distributed by MLS Grid
- 2026-03-19 Listed $215,000 Stellar MLS as Distributed by MLS Grid
- 2020-10-21 Sold (Public Records) $80,200 Public Records
- 1986-06-01 Sold (Public Records) $44,900 Public Records
Property tax history
+15.9%/yrLatest (2025): $1,451 · +6.7% YoY. Source: county tax records.
Cash-flow waterfall
monthlySold comps — $/sqft
last 12 mo · ≤1 miLoading sold comps…