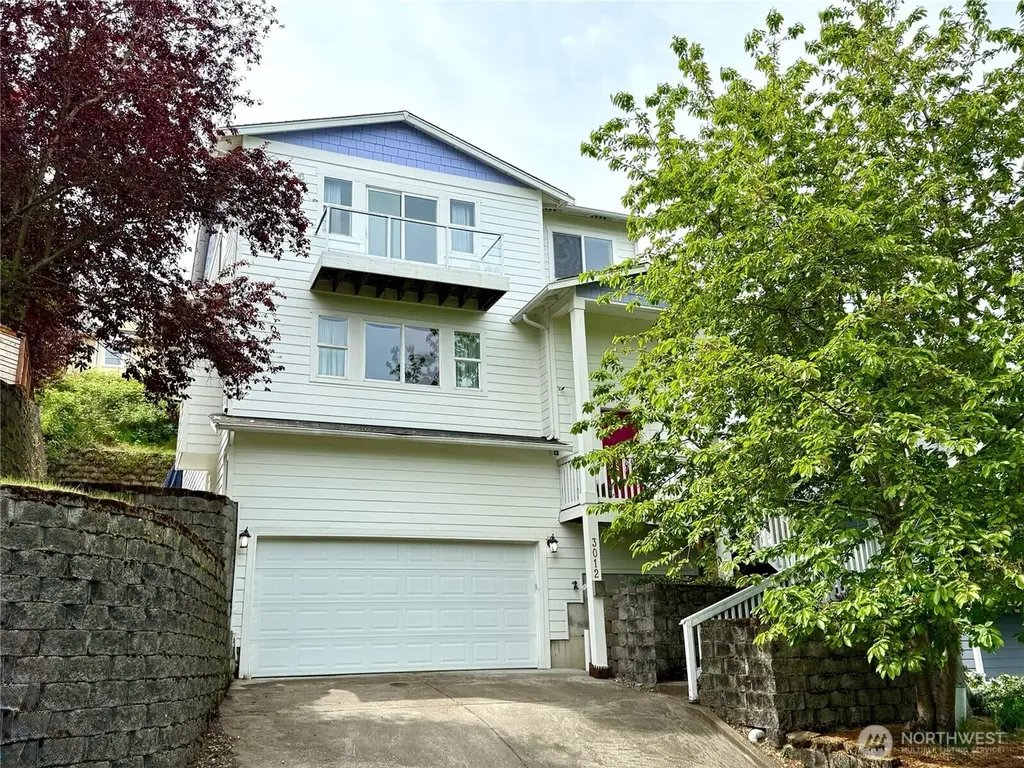
3012 E Valley View Ter · Tacoma, WA
Flood risk 1/10 · Minimal
- FEMA flood zone
- X (unshaded)
- Chance of flooding over 30 yrs
- 0.0%
- Est. flood insurance / yr
- $473 – $860
Fire risk 1/10 · Minimal
- Est. fire insurance / yr
- $604 – $1,122
Heat risk 3/10 · Minor
- Hot days now (above 87°F)
- 7 days/yr
- Hot days in 30 yrs
- 15 days/yr
Wind risk 1/10 · Minimal
- Chance of severe wind over 30 yrs
- —
Air-quality risk 7/10 · Major
- Unhealthy air days now
- 10 days/yr
- Unhealthy air days in 30 yrs
- 12 days/yr
Risk factors via First Street. Map © Google.
Why this score? — see what drove the D grade
The composite is a weighted blend of 9 inputs, each scored 0–100. Each bar is that input's sub-score; the figure is the points it added to the 100-point composite (weight × sub-score).
- Cash flow +12.3/30.0
- ARV discount +7.9/15.0
- Schools +4.2/10.0
- Livability +3.9/5.0
- DSCR +3.6/10.0
- 1% rule +3.3/10.0
- Rent growth +2.9/5.0
- Condition / age +2.5/5.0
- Appreciation +0.0/10.0
$612,000
🖨 Deal sheet (PDF) 📄 Offer letter ✓ Due diligence
Listing remarks
Experience breathtaking views and timeless charm in this beautifully maintained split-level home located in Tacoma’s desirable McKinley Park area. With easy access to downtown Tacoma, this home offers both convenience and comfort in a prime location. The open main floor features a spacious living room with rich hardwood floors, a cozy fireplace, wood-wrapped windows, and an abundance of natural light. Enjoy sweeping views of the Puget Sound that create a truly inviting atmosphere. The gourmet kitchen includes granite countertops, a large island, eating space, and quality millwork throughout—perfect for everyday living and entertaining. Upstairs, the primary suite offers a privat
Key facts
- Wood-wrapped windows
- Breathtaking views
- Cozy fireplace
Tags
Property features AI
Finance
- Other: Located in McKinley Hill; Lot features: Lots 7 & 8, dimensions 50 x 115 x 50 x 115
- Financial info: Accepts Cash, Conventional, FHA, and VA financing
Exterior
- Parking: Attached garage; Has garage; 2 covered spaces; 2 uncovered spaces; Driveway and off-street parking
- Security: Partially fenced
- Utilities: Public water (Tacoma Public Utilities); Sewer connected (Pierce County); Power from Tacoma Public Utilities; Cable connected (various); Internet connected (various)
- Home design: Single-family residence; Two stories with basement; Split entry; House with view; Built in 2007 (effective); Good condition
- Construction: Built on lot; Cement plank and wood construction; Composition roof; Poured concrete foundation; Effective year built 2007
- Exterior features: Cement-planked and wood exterior; Partially fenced; Patio; Garden space; Cable TV available; High-speed internet available; Propane on site; Partially sloped topography; Curbs, paved streets, and sidewalk
Interior
- Kitchen: Dishwasher; Microwave; Refrigerator; Stove/Range; See remarks
- Bedrooms: 4 bedrooms (3 upper, 1 lower)
- Flooring: Hardwood; Vinyl
- Bathrooms: 3 full bathrooms; 1 half bathroom; 3 bathtubs; 2 showers
- Heating & cooling: Forced air heating; No central cooling listed; Electric and propane energy sources
- Interior features: Ceiling fans; Dining room; Fireplace; Walk-in closets
- Laundry & utility: Washer; Dryer; Water heater located in garage
Neighborhood map
What this means for you Summary
Snapshot
- This is a 4-bed/4.0-bath single-family listed at $612k.
Deal economics
- At list price, monthly cash flow is $-117 ($-1k/yr) — negative.
- To cash-flow at today's rent, offer at most $591k (3.4% below list).
- To meet the 1% rule (rent ≥ 1% of price), the offer needs to be $507k (17.1% below list).
- Recommended offer: $507k (17.1% below list) — sets the bar for 1% rule.
- Cap rate 6.1% vs local median 2.9% in Tacoma — top-decile yield for the area; either an underpriced asset or a hidden risk that comps aren't pricing in. Stress-test before assuming the spread holds.
Location & tenants
- Location reads 78/100 on livability (#127 in WA, #2,535 nationally) — a middle-class / working-renter tenant base. Strengths: amenities A+, commute A+, housing A+; Watch: cost of living D, crime F.
- Tacoma School District (urban): math 40% / reading 53% proficiency, ranked #169 of 291 in WA (top 58%) — families likely to look elsewhere, expect single-tenant / working-renter base with shorter leases.
- Zoned schools: Blix Elementary School (475 students, 69% FRL); First Creek Middle School (575 students, 82% FRL); Lincoln High School (1,578 students, 73% FRL) — zoned schools average 75% FRL vs 53% district-wide (22 pts higher); higher-poverty schools than district average — tighter screening recommended.
- Market conditions: Rents rising (+1.6%/yr); 182 active listings in the ZIP; 3 comparable units currently listed for rent nearby; rentals at typical pace (median 19d on market — plan ~3-4 weeks tenant-placement turnaround); solid renter incomes; 3,209 units permitted in Pierce County in 2024 (1,269 in 5+ unit buildings).
- At $5,071/mo this rent would consume 74% of the median local household income ($82k/yr) (locally 989% of renters already pay >50% of income on rent) — very limited rent-growth headroom before tenants either downsize or default.
Forward outlook
- Local home prices are declining (-3.0%/yr); year-one equity from $4k of loan paydown is wiped out by about $18k of value loss. Plan a longer hold.
- Pierce County population projected at +26% by 2050 — long-run rental-demand tailwind backs the buy-and-hold thesis.
Negotiation context
- It's been on market 44 days — a 3% lower offer ($594k) is reasonable based on typical stale-listing flexibility.
- 3 sale attempts since 15y ago with the ask held roughly flat each time — persistent listings suggest the price (not the market) is what's stuck; bring a comps-based counter.
- Current owner paid $310k; list at $612k implies a 97% gain — meaningful room to come down on a strong offer.
Questions for the listing agent
- What do current leases actually rent for vs. the listed asking? Can we see a recent rent roll and the last 12 months of T-12 income?
- It's been on market 44 days. Have you received any prior offers? Is the seller open to a 17% concession, seller financing, or rate buy-down credit?
- Is there a deadline driving the sale (1031 exchange, divorce, estate, relocation)? That informs how much negotiation room exists.
- Schools are B-rated — typically a magnet for longer-tenancy family renters. What's the average tenant stay here, and is there a school-zone premium baked into asking?
- Crime grade is F in this area — have there been break-ins, vandalism, or insurance claims at this property in the last 3 years? What carrier currently insures it and at what premium?
- The area grade is low — what's the realistic commute time and amenity access for the typical tenant pool here? Any planned neighborhood developments (good or bad) we should know about?
- What's the average days-on-market for RENTAL listings here right now (not sales)? A rising rental-DOM trend means longer vacancies and softer asking-rent achievability than the comps imply.
- What's the recent tenant-quality profile in this submarket — average credit score on applications, eviction rate, late-payment / NSF rate, and stable-employment percentage? A property-management company in the area should have these aggregated.
- How much new for-sale + rental construction is in the pipeline within 1–3 miles? Heavy new supply typically softens prices + rents 12–24 months out; constrained supply supports both.
Investment metrics
- 1% rule
- 0.83% ✗
- Cap rate
- 6.06%
- Cash-on-cash
- -0.82%
- DSCR
- 0.96
- GRM
- 10.1
CMA / ARV
- ARV (on-the-fly)
- $617,176
- Comps found
- 10
Show comp detail 10 sales within ~0.75 mi
| Address | Dist | Beds/Ba | Sqft | Sold | Price | $/sf | Match |
|---|---|---|---|---|---|---|---|
| 1005 E 30th St | 0.12mi | 3/2.0 (-1) | 2,906 (+1%) | 9mo | $662,500 | $228 | 73 |
| 1206 E 30th | 0.06mi | 4/2.0 | 2,577 (-11%) | 6mo | $500,000 | $194 | 67 |
| 3301 McKinley Ave | 0.30mi | 5/2.5 (+1) | 2,800 (-3%) | 8mo | $705,000 | $252 | 64 |
| 1206 E 29th St | 0.11mi | 3/2.0 (-1) | 2,580 (-10%) | 2mo | $600,000 | $233 | 62 |
| 1006 E Harrison St | 0.39mi | 4/1.0 | 3,011 (+4%) | 9mo | $500,000 | $166 | 55 |
| 1006 E 34th St | 0.26mi | 3/2.5 (-1) | 3,063 (+6%) | 18mo | $615,000 | $201 | 52 |
| 1014 E 32nd St | 0.13mi | 3/1.0 (-1) | 2,456 (-15%) | 11mo | $525,000 | $214 | 44 |
| 3626 E Howe St | 0.69mi | 5/3.0 (+1) | 2,650 (-8%) | 4mo | $600,000 | $226 | 42 |
| 3571 E F St | 0.62mi | 3/2.0 (-1) | 2,508 (-13%) | 2mo | $290,000 | $116 | 34 |
| 1625 E 34th St | 0.44mi | 3/1.0 (-1) | 2,588 (-10%) | 19mo | $495,800 | $192 | 29 |
Match score weights: distance 35% · size 25% · config 20% · recency 20%. Top-matched comps best support the ARV.
Projected returns pro-forma
-3.0% appreciation · 1.64% rent growth · sell at horizon
- IRR
- -19.1%
- Equity multiple
- 0.34×
- Total profit
- $-113,428
- Equity at exit
- $91,251
- IRR
- -14.7%
- Equity multiple
- 0.21×
- Total profit
- $-135,621
- Equity at exit
- $52,915
Cash invested: $171,360 (down + closing). Projections, not guarantees.
Landlord ↔ Tenant lean methodology
- Overall (STATE)
- 28 Tenant-Leaning
- State Washington
- 28 Tenant-Leaning · D+8
- County
- — inherits STATE
- City
- — inherits STATE
ZIP-level market 98404
- Rents YoY
- 1.6%
- Active inventory
- 182
- Price-to-rent
- 10.1×
Monthly cashflow live
- Estimated rent
- $5,071 medium interval (Pro) →
- Mortgage (P&I)
- −$3,209
- Tax from tax record
- −$659 /mo · $7,903/yr
- Insurance
- −$255
- HOA
- −$0
- Lot rent
- −$0
- Vacancy / Maint / Mgmt
- −$1,065
- Net cashflow
- $-117
Break-even live
Sensitivity live
| Price | -10% $230 | -5% $57 | +0% $-117 | +5% $-290 | +10% $-463 |
|---|---|---|---|---|---|
| Rent | -10% $-517 | -5% $-317 | +0% $-117 | +5% $84 | +10% $284 |
| Rate | -1.0pp $192 | -0.5pp $39 | base $-117 | +0.5pp $-275 | +1.0pp $-436 |
UW: 25.0% down · 7.5% · 30yr · 1.5% tax · 5.0% vac · 8.0% maint · 8.0% mgmt
Financing live
Cash to close
- Down payment
- $153,000
- Closing costs
- $18,360
- Reserves months
- —
- Total cash needed
- —
Loan-product check · same deal, 3 products live
Conventional
25% down · 7.5% · 30yr
- Down + closing
- —
- Monthly P&I
- —
- Monthly cashflow
- —
- DSCR
- —
- Eligible?
- —
Personal DTI + credit; lowest rate.
DSCR
20% down · 8.5% · 30yr
- Down + closing
- —
- Monthly P&I
- —
- Monthly cashflow
- —
- DSCR
- —
- Eligible?
- —
No personal income docs; deal must DSCR.
Hard money
10% down · 12.0% · 12mo
- Down + closing
- —
- Monthly P&I
- —
- Monthly cashflow
- —
- DSCR
- —
- Eligible?
- —
Short-term bridge; refi at stabilization.
Rent comps 3 comps
| Address | Beds | Baths | Sqft | Rent | $/sqft | DOM | Units | Dist |
|---|---|---|---|---|---|---|---|---|
| 106 E 37th St Tacoma, WA | 3.0 | 1.0 | 2127 | $2,475 | $1.16 | 10d | 1 | 1.01mi |
| 2135 Commerce St Tacoma, WA | 3.0 | 3.5 | 2800 | $11,500 | $4.11 | 19d | 1 | 1.11mi |
| 3620 S D St Tacoma, WA | 4.0 | 2.0 | 2368 | $2,660 | $1.12 | 26d | 1 | 1.16mi |
Listing history 29 events
-
2026-06-22days on market $612,000 Active 44 DOM
-
2026-06-21days on market $612,000 Active 43 DOM
-
2026-06-18days on market $612,000 Active 40 DOM
-
2026-06-17days on market $612,000 Active 39 DOM
-
2026-06-16days on market $612,000 Active 38 DOM
-
2026-06-15days on market $612,000 Active 37 DOM
-
2026-06-13days on market $612,000 Active 35 DOM
-
2026-06-13days on market $612,000 Active 34 DOM
-
2026-06-09days on market $612,000 Active 31 DOM
-
2026-06-08days on market $612,000 Active 30 DOM
-
2026-06-07days on market $612,000 Active 29 DOM
-
2026-06-04days on market $612,000 Active 26 DOM
-
2026-06-03days on market $612,000 Active 25 DOM
-
2026-06-02days on market $612,000 Active 24 DOM
-
2026-06-01days on market $612,000 Active 23 DOM
-
2026-05-31days on market $612,000 Active 22 DOM
-
2026-05-22price $612,000
-
2026-05-09$615,000 Active
-
2016-05-12soldstatus $310,000 Sold
-
2016-05-12soldstatus $310,000
-
2016-04-15status Pending Inspection
-
2016-04-10price $319,950
-
2016-03-12$329,950 Active
-
2012-05-02soldstatus $170,000 Sold
-
2012-05-02soldstatus $170,000
-
2012-02-08status Pending
-
2011-11-05status Pending Inspection
-
2011-08-11$215,000 Active
-
2011-04-27soldstatus $404,560
ⓘ Source: listings_history table (triggers on properties + properties_extension) + one-shot
backfill from property_details.listing_events for pre-trigger history.
Tax reassessment forecast WA · Resets to sale price
- Current annual tax
- $7,903 · $659/mo
- Projected year-2 tax
- $7,903 · $659/mo
- Expected delta
- $0/yr ($0/mo · 0.0%)
ⓘ Screening estimate from a state-policy table — verify with the county assessor before closing.
Climate risk First Street
- Flood 1/10 Low FEMA zone X (unshaded) · 0% chance over 30 yrs
- Wildfire 1/10 Low
- Heat 3/10 Moderate 7 d/yr ≥87°F today · 15 d/yr by 30 yrs out
- Wind 1/10 Low
- Air quality 7/10 Severe 10 unhealthy d/yr today · 12 by 30 yrs out
Nearby sold comps map
Loading sold comps map…
Walkable amenities ~0.75 mi
Loading nearby amenities…
Taxation est. · year 1
- Rental income
- $60,857
- − Mortgage interest
- −$34,282
- − Property taxes
- −$7,903
- − Insurance
- −$3,060
- − Repairs & maintenance
- −$4,869
- − Management
- −$4,869
- − Depreciation
- −$17,804
- Taxable loss
- −$11,928
- Est. tax savings @ 24.0%
- +$2,863
- After-tax cash flow
- $1,464/yr
For passive investors: Depreciation is non-cash, so a rental often shows a tax loss while cash-flowing — sheltering income. Rental losses are passive: they offset passive income freely, and up to $25,000/yr can offset ordinary (W-2) income if you actively participate and your MAGI is under $100k (phasing out to $0 by $150k); unused losses carry forward. On sale, claimed depreciation is recaptured at up to 25%, and gains may owe capital-gains tax (a 1031 exchange can defer both). Figures are a year-1 estimate at your 24.0% rate — not tax advice; consult a CPA.
Schools (NCES district)
- District
- Tacoma School District
- NCES district ID
- 5308700
- Math proficiency
- 40% ▬ 0.00%
- Reading proficiency
- 53% ▲ 1.00%
- Median HH income
- $52,467
- Composite
- 42.25/100
- National rank
- #6987
- State rank
- #169 of 291 in WA
Livability — Tacoma
- Score
- 78/100
- State rank
- #127
- US rank
- #2535
Category grades
Schools grade is shown separately in the Schools card above.
Census & demographics
- Census place
- Tacoma, WA
- County
- Pierce County · 788,257 people
- City population
- 212,935
- Metro
- Seattle-Tacoma-Bellevue, WA
- Population (ZIP)
- 35,961
- Household income
- $82,191
- Rent vs Own
- Severe rent burden
- 989.0
Population outlook (Pierce County) Hauer SSP2
- Today (2025)
- 956,648 people
- By 2030
- 1,010,862 · +5.7%
- By 2040
- 1,113,170 · +16.4%
- By 2050
- 1,206,524 · +26.1%
- By 2075
- 1,436,425 · +50.2%
- By 2100
- 1,563,654 · +63.5%
Race, ethnicity, and origin ACS 2023
- Neighborhood character
- Highly diverse neighborhood (Simpson 0.77)
- Race & ethnicity
- White 38% Hispanic / Latino 20% Asian 17% Two or more races 16% Black 11% Native American 3% Pacific Islander 1%
- Hispanic origin (detail)
- Mexican 16% Puerto Rican 1%
- Common ancestry
- Italian 3% Portuguese 2% Slovak 1%
- Foreign-born
- 20% · Canada, Vietnam, South Korea
- Languages at home
- 68% English-only · Spanish 13% Other Asian/Pacific 7% Vietnamese 4%
Political lean MEDSL · Pierce
- 2024 margin
- D (+10.8) · D 53.9% · R 43.1% · Other 3.0%
- 2008→2024 swing
- -1.4pp toward R · 2008: 12.2pp · 2024: 10.8pp
- All cycles
- 2024: D+10.8 2020: D+11.2 2016: D+7.5 2012: D+11.0 2008: D+12.2
Not yet ingested
- Civics
- —
Market trends
- HPI YoY
- ▼ -462.09%
- Current HPI
- 360.0843
- Rent YoY
- ▲ 1.64%
- Metro
- Seattle-Tacoma-Bellevue, WA
- State GDP YoY
- ▲ 4.65%
- F500 in state
- 22
Industry mix (Fortune 500 HQ in WA)
| Industry | F500 HQs | Revenue |
|---|---|---|
| Retail | 2 | $269B |
|
||
| Technology / Retail | 1 | $638B |
|
||
| Technology | 1 | $245B |
|
||
| Telecommunications | 1 | $38B |
|
||
| Food / Beverage | 1 | $36B |
|
||
| Automotive / Trucks | 1 | $34B |
|
||
Price history
+51.3% since first listed13 events — show timeline
- 2026-05-22 Price Changed $612,000 NWMLS as Distributed by MLS Grid
- 2026-05-09 Listed $615,000 NWMLS as Distributed by MLS Grid
- 2016-05-12 Sold (Public Records) $310,000 Public Records
- 2016-05-12 Sold (MLS) $310,000 NWMLS as Distributed by MLS Grid
- 2016-04-15 Pending — NWMLS as Distributed by MLS Grid
- 2016-04-10 Price Changed $319,950 NWMLS as Distributed by MLS Grid
- 2016-03-12 Listed $329,950 NWMLS as Distributed by MLS Grid
- 2012-05-02 Sold (Public Records) $170,000 Public Records
- 2012-05-02 Sold (MLS) $170,000 NWMLS as Distributed by MLS Grid
- 2012-02-08 Pending — NWMLS as Distributed by MLS Grid
- 2011-11-05 Pending — NWMLS as Distributed by MLS Grid
- 2011-08-11 Listed $215,000 NWMLS as Distributed by MLS Grid
- 2011-04-27 Sold (Public Records) $404,560 Public Records
Property tax history
+3.6%/yrLatest (2026): $7,903 · +2.7% YoY. Source: county tax records.
Cash-flow waterfall
monthlySold comps — $/sqft
last 12 mo · ≤1 miLoading sold comps…