10 Foster Ln · Hempstead, TX
Flood risk 1/10 · Minimal
- FEMA flood zone
- X (unshaded)
- Chance of flooding over 30 yrs
- 0.0%
- Est. flood insurance / yr
- $507 – $1,088
Fire risk 5/10 · Moderate
- Est. fire insurance / yr
- $1,222 – $2,270
Heat risk 8/10 · Major
- Hot days now (above 111°F)
- 7 days/yr
- Hot days in 30 yrs
- 22 days/yr
Wind risk 8/10 · Major
- Chance of severe wind over 30 yrs
- 99.0%
Air-quality risk 2/10 · Minimal
- Unhealthy air days now
- 1 days/yr
- Unhealthy air days in 30 yrs
- 1 days/yr
Risk factors via First Street. Map © Google.
Why this score? — see what drove the A- grade
The composite is a weighted blend of 9 inputs, each scored 0–100. Each bar is that input's sub-score; the figure is the points it added to the 100-point composite (weight × sub-score).
- Cash flow +30.0/30.0
- ARV discount +15.0/15.0
- 1% rule +10.0/10.0
- DSCR +10.0/10.0
- Appreciation +10.0/10.0
- Livability +3.0/5.0
- Rent growth +2.5/5.0
- Schools +1.5/10.0
- Condition / age +1.0/5.0
$71,999
🖨 Deal sheet 📄 Offer letter ✓ Due diligence
Listing remarks
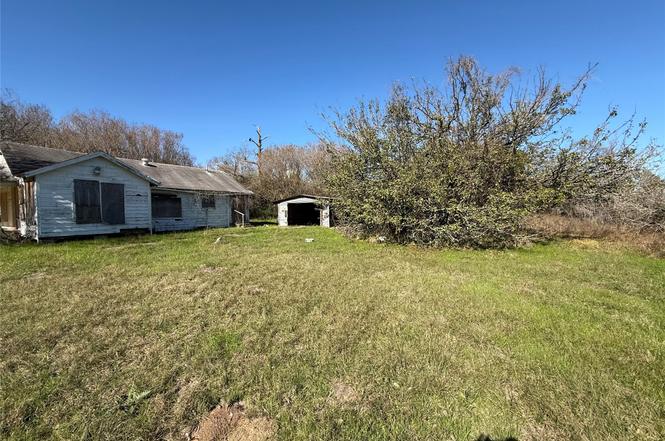
Great investment property located at the end of a Cul-de-sac, very private . call from more information.
Key facts
- Very private
- Cul-de-sac
- 0.4 acre lot
Tags
Neighborhood map
What this means for you Summary
Snapshot
- This is a 3-bed/1.0-bath single-family listed at $72k. Condition is rated poor.
Deal economics
- At list price, monthly cash flow is $426 ($5k/yr) — positive.
- The deal already cash-flows at list — no discount required.
- Meets the 1% rule at list price ($1k rent vs $72k).
- Recommended offer: $63k (12.0% below list) — sets the bar for market timing.
- Cap rate 13.4% vs local median 2.3% in Hempstead — top-decile yield for the area; either an underpriced asset or a hidden risk that comps aren't pricing in. Stress-test before assuming the spread holds.
Location & tenants
- Location reads 60/100 on livability (#1,099 in TX) — a middle-class / working-renter tenant base. Strengths: cost of living A+, housing A+; Watch: crime D+, employment D, amenities F.
- Hempstead ISD (town): math 16% / reading 19% proficiency, ranked #795 of 826 in TX (top 96%) — low school quality limits family demand, transient renter base, plan for 1-2y turnover; 70% free/reduced lunch — lower-income household profile, screen leases tightly.
- Zoned schools: Hempstead El (math 19% / reading 15%, grade F, #3,836 of 4,322 statewide, top 91%, 834 students, 90% FRL); Hempstead Middle (math 14% / reading 16%, grade F, #1,569 of 1,662 statewide, top 95%, 339 students, 84% FRL); Hempstead H S (math 12% / reading 32%, grade F, #1,366 of 1,632 statewide, top 84%, 465 students, 80% FRL).
- Market conditions: 422 active listings in the ZIP; 6 comparable units currently listed for rent nearby; rentals lingering (median 44d on market — plan ~5-8 weeks vacancy on turnover, expect pricing pressure); 50% of comp listings sitting > 30 days — soft ceiling on asking rent; 483 units permitted in Waller County in 2024 (89 in 5+ unit buildings).
Forward outlook
- In year one you build about $8k of equity ($498 loan paydown + $7k appreciation (10.0% local appreciation)).
- Waller County population projected at +62% by 2050 — long-run rental-demand tailwind backs the buy-and-hold thesis.
- At projected returns (10.0% appreciation + 3.0% rent growth), your $20k cash investment doubles in ~2 years — after that, you're playing with house money.
- By year 5, paydown + projected appreciation supports a ~$36k cash-out refi (75% LTV) — recoverable capital for the next deal without selling this one.
Negotiation context
- It's been on market 235 days — a 12% lower offer ($63k) is reasonable based on typical stale-listing flexibility.
Risks & watch-outs
- Watch-outs: built in 1950 — expect roof / HVAC / electrical / plumbing capex.
- Climate carrying-cost: severe wind risk, 99% chance of damaging wind over 30y; moderate wildfire risk; extreme-heat days projected 7→22/yr by 2055 (HVAC capex compounding) — expect insurance premiums to compound above CPI over the hold.
Questions for the listing agent
- It's been on market 235 days. Have you received any prior offers? Is the seller open to a 12% concession, seller financing, or rate buy-down credit?
- Have any recent inspections been done? Can we get a copy of the seller's disclosures and any deferred-maintenance estimates?
- Built in 1950 — when were the roof, HVAC, electrical panel, plumbing, and water heater last replaced?
- Why hasn't it sold? Are there any deal-killer items the seller is aware of (foundation, flood, title, zoning, code violations)?
- Is there a deadline driving the sale (1031 exchange, divorce, estate, relocation)? That informs how much negotiation room exists.
- Schools are F-rated, which usually means shorter tenancies and higher turnover. Who's the typical renter profile here, and what's been the actual vacancy rate?
- Crime grade is D in this area — have there been break-ins, vandalism, or insurance claims at this property in the last 3 years? What carrier currently insures it and at what premium?
- What's the average days-on-market for RENTAL listings here right now (not sales)? A rising rental-DOM trend means longer vacancies and softer asking-rent achievability than the comps imply.
- What's the recent tenant-quality profile in this submarket — average credit score on applications, eviction rate, late-payment / NSF rate, and stable-employment percentage? A property-management company in the area should have these aggregated.
- How much new for-sale + rental construction is in the pipeline within 1–3 miles? Heavy new supply typically softens prices + rents 12–24 months out; constrained supply supports both.
Investment metrics
- 1% rule
- 1.62% ✓
- Cap rate
- 13.39%
- Cash-on-cash
- 25.36%
- DSCR
- 2.13
- GRM
- 5.1
CMA / ARV
- ARV (on-the-fly)
- $110,880
- Comps found
- 5
Show comp detail 5 sales within ~0.75 mi
| Address | Dist | Beds/Ba | Sqft | Sold | Price | $/sf | Match |
|---|---|---|---|---|---|---|---|
| 1335 3rd St | 0.28mi | 3/1.0 | 912 (-10%) | 6mo | $100,000 | $110 | 66 |
| 506 Kosse St | 0.45mi | 3/1.0 | 1,032 (+2%) | 11mo | $160,000 | $155 | 66 |
| 1620 2nd St | 0.30mi | 2/2.0 (-1) | 896 (-11%) | 13mo | $99,000 | $110 | 48 |
| 1343 3rd St | 0.28mi | 4/2.0 (+1) | 1,152 (+14%) | 8mo | $75,000 | $65 | 48 |
| 2029 6th St | 0.71mi | 3/2.0 | 1,080 (+7%) | 12mo | $185,000 | $171 | 41 |
Match score weights: distance 35% · size 25% · config 20% · recency 20%. Top-matched comps best support the ARV.
Projected returns pro-forma
10.0% appreciation · 3.0% rent growth · sell at horizon
- IRR
- 43.4%
- Equity multiple
- 4.29×
- Total profit
- $66,369
- Equity at exit
- $64,862
- IRR
- 37.5%
- Equity multiple
- 9.64×
- Total profit
- $174,138
- Equity at exit
- $139,878
Cash invested: $20,160 (down + closing). Projections, not guarantees.
Landlord ↔ Tenant lean methodology
- Overall (STATE)
- 87 Strongly Landlord-Friendly
- State Texas
- 87 Strongly Landlord-Friendly · R+5
- County
- — inherits STATE
- City
- — inherits STATE
ZIP-level market 77445
- Home prices YoY
- 12.3%
- Active inventory
- 422
- Price-to-rent
- 5.1×
Monthly cashflow live
- Estimated rent
- $1,169 high interval (Pro) →
- Mortgage (P&I)
- −$378
- Tax est. 1.5%
- −$90 /mo · $1,080/yr
- Insurance
- −$30
- HOA
- −$0
- Vacancy / Maint / Mgmt
- −$246
- Net cashflow
- $426
Break-even live
UW: 25.0% down · 7.5% · 30yr · 1.5% tax · 5.0% vac · 8.0% maint · 8.0% mgmt
Financing live
Cash to close
- Down payment
- $18,000
- Closing costs
- $2,160
- Reserves months
- —
- Total cash needed
- —
Loan-product check · same deal, 3 products live
Conventional
25% down · 7.5% · 30yr
- Down + closing
- —
- Monthly P&I
- —
- Monthly cashflow
- —
- DSCR
- —
- Eligible?
- —
Personal DTI + credit; lowest rate.
DSCR
20% down · 8.5% · 30yr
- Down + closing
- —
- Monthly P&I
- —
- Monthly cashflow
- —
- DSCR
- —
- Eligible?
- —
No personal income docs; deal must DSCR.
Hard money
10% down · 12.0% · 12mo
- Down + closing
- —
- Monthly P&I
- —
- Monthly cashflow
- —
- DSCR
- —
- Eligible?
- —
Short-term bridge; refi at stabilization.
Rent comps 6 comps
| Address | Beds | Baths | Sqft | Rent | $/sqft | DOM | Units | Dist |
|---|---|---|---|---|---|---|---|---|
| 1246 5th St Hempstead, TX | 2.0 | 1.5 | 1353 | $1,400 | $1.03 | 10d | 1 | 0.39mi |
| 1235 11th St Unit 15 Hempstead, TX | 2.0 | 1.0 | 900 | $950 | $1.06 | 43d | 1 | 0.86mi |
| 1235 11th St Apt 8 Hempstead, TX | 2.0 | 1.0 | 900 | $975 | $1.08 | 44d | 1 | 0.86mi |
| 1046 15th St Hempstead, TX | 2.0 | 1.0 | 884 | $1,100 | $1.24 | 12d | 1 | 1.11mi |
| 302 16th St Hempstead, TX | 3.0 | 2.0 | 1408 | $1,450 | $1.03 | 43d | 1 | 1.30mi |
| 117 Clear Creek St Hempstead, TX | 2.0 | 2.0 | 1192 | $1,003 | $0.84 | 22d | 1 | 1.31mi |
Listing history 10 events
-
2026-04-25status Pending
-
2026-04-25historical
-
2026-04-23status Pending
-
2026-04-22status Pending
-
2026-03-28status Pending
-
2026-03-18status Pending
-
2026-03-02price $71,999
-
2025-10-02price $76,999
-
2025-08-25price $80,999
-
2025-08-05$100,000 Active
ⓘ Source: listings_history table (triggers on properties + properties_extension) + one-shot
backfill from property_details.listing_events for pre-trigger history.
Climate risk First Street
- Flood 1/10 Low FEMA zone X (unshaded) · 0% chance over 30 yrs
- Wildfire 5/10 Major
- Heat 8/10 Severe 7 d/yr ≥111°F today · 22 d/yr by 30 yrs out
- Wind 8/10 Severe 99% chance of damaging wind over 30 yrs
- Air quality 2/10 Low 1 unhealthy d/yr today · 1 by 30 yrs out
Nearby sold comps map
Loading sold comps map…
Walkable amenities ~0.75 mi
Loading nearby amenities…
Taxation est. · year 1
- Rental income
- $14,030
- − Mortgage interest
- −$4,033
- − Property taxes
- −$1,080
- − Insurance
- −$360
- − Repairs & maintenance
- −$1,122
- − Management
- −$1,122
- − Depreciation
- −$2,095
- Taxable income
- $4,218
- Est. tax owed @ 24.0%
- −$1,012
- After-tax cash flow
- $4,101/yr
For passive investors: Depreciation is non-cash, so a rental often shows a tax loss while cash-flowing — sheltering income. Rental losses are passive: they offset passive income freely, and up to $25,000/yr can offset ordinary (W-2) income if you actively participate and your MAGI is under $100k (phasing out to $0 by $150k); unused losses carry forward. On sale, claimed depreciation is recaptured at up to 25%, and gains may owe capital-gains tax (a 1031 exchange can defer both). Figures are a year-1 estimate at your 24.0% rate — not tax advice; consult a CPA.
Condition & rehab AI · 12 photos
This property requires extensive repairs and maintenance, including roof replacement, siding repair, and landscaping. Significant value can be added through these improvements, making it a good investment opportunity.
Repairs flagged
- Major siding — Severe weathering
- Major roof — Signs of deterioration
- Major landscaping — Overgrown vegetation
Value-add opportunities
- Both landscaping and vegetation removal — Improves curb appeal and safety
- Both roof replacement — Essential for structural integrity and safety
- Both siding repair/replacement — Enhances curb appeal and structural integrity
Renovation cost estimate screening
| Repair item | Severity | Est. cost |
|---|---|---|
| siding · Severe weathering | Major | $15,000–50,000 |
| roof · Signs of deterioration | Major | $15,000–50,000 |
| landscaping · Overgrown vegetation | Major | $15,000–50,000 |
| Total estimated repair cost · 3 items | $45,000–150,000 |
Value-add ROI direction
- Both landscaping and vegetation removal — Improves curb appeal and safety ↑
- Both roof replacement — Essential for structural integrity and safety ↑
- Both siding repair/replacement — Enhances curb appeal and structural integrity ↑
ⓘ Cost ranges are severity-bucket heuristics (US national rule-of-thumb). Get contractor quotes + a written scope before underwriting a rehab budget.
Schools (NCES district)
- District
- Hempstead ISD
- NCES district ID
- 4822920
- Math proficiency
- 16% ▼ -8.00%
- Reading proficiency
- 19% ▼ -4.00%
- Median HH income
- $40,396
- Composite
- 14.92/100
- National rank
- #9371
- State rank
- #795 of 826 in TX
Livability — Hempstead
- Score
- 60/100
- State rank
- #1099
- US rank
- #19446
Category grades
Schools grade is shown separately in the Schools card above.
Census & demographics
- Census place
- Hempstead, TX
- City population
- 14,943
- Population (ZIP)
- 14,943
Population outlook (Waller County) Hauer SSP2
- Today (2025)
- 60,772 people
- By 2030
- 67,616 · +11.3%
- By 2040
- 82,283 · +35.4%
- By 2050
- 98,276 · +61.7%
- By 2075
- 142,860 · +135.1%
- By 2100
- 175,596 · +188.9%
Race, ethnicity, and origin ACS 2023
- Neighborhood character
- Diverse neighborhood (Simpson 0.69)
- Race & ethnicity
- Hispanic / Latino 34% White 32% Black 31% Two or more races 10% Native American 2%
- Hispanic origin (detail)
- Mexican 30% Cuban 1%
- Common ancestry
- Romanian 2% Lithuanian 2% Slovak 1%
- Foreign-born
- 13% · Canada
- Languages at home
- 74% English-only · Spanish 25%
Political lean MEDSL · Waller
- 2024 margin
- Strong R (+25.0) · D 37.0% · R 62.0% · Other 1.0%
- 2008→2024 swing
- -17.9pp toward R · 2008: -7.2pp · 2024: -25.0pp
- All cycles
- 2024: R+25.0 2020: R+26.7 2016: R+28.6 2012: R+17.6 2008: R+7.2
Not yet ingested
- Civics
- —
Market trends
- HPI YoY
- ▲ 39.43%
- Current HPI
- 359.93
- Rent YoY
- —
- Metro
- —
- State GDP YoY
- ▲ 3.95%
- F500 in state
- 110
Industry mix (Fortune 500 HQ in TX)
| Industry | F500 HQs | Revenue |
|---|---|---|
| Energy | 16 | $1,198B |
|
||
| Technology | 5 | $198B |
|
||
| Engineering / Construction | 4 | $72B |
|
||
| Energy Services | 3 | $60B |
|
||
| Utilities | 3 | $41B |
|
||
| Healthcare | 2 | $330B |
|
||
Price history
-28.0% since first listed10 events — show timeline
- 2026-04-25 Pending — HARMLS
- 2026-04-25 Listing Removed — HARMLS
- 2026-04-23 Pending — HARMLS
- 2026-04-22 Pending — HARMLS
- 2026-03-28 Pending — HARMLS
- 2026-03-18 Pending — HARMLS
- 2026-03-02 Price Changed $71,999 HARMLS
- 2025-10-02 Price Changed $76,999 HARMLS
- 2025-08-25 Price Changed $80,999 HARMLS
- 2025-08-05 Listed $100,000 HARMLS
Cash-flow waterfall
monthlySold comps — $/sqft
last 12 mo · ≤1 miLoading sold comps…