 6-Plex
1561 Jefferson Ave · Miami Beach, FL
Flood risk 9/10 · Severe
- FEMA flood zone
- AE
- Chance of flooding over 30 yrs
- 0.99%
- Est. flood insurance / yr
- $1,737 – $8,500
Fire risk 4/10 · Minor
- Est. fire insurance / yr
- $947 – $1,759
Heat risk 10/10 · Severe
- Hot days now (above 101°F)
- 8 days/yr
- Hot days in 30 yrs
- 31 days/yr
Wind risk 10/10 · Severe
- Chance of severe wind over 30 yrs
- 99.0%
Air-quality risk 2/10 · Minimal
- Unhealthy air days now
- 1 days/yr
- Unhealthy air days in 30 yrs
- 1 days/yr
Risk factors via First Street. Map © Google.
Why this score? — see what drove the D grade
The composite is a weighted blend of 9 inputs, each scored 0–100. Each bar is that input's sub-score; the figure is the points it added to the 100-point composite (weight × sub-score).
- Cash flow +12.8/30.0
- ARV discount +7.5/15.0
- Schools +4.2/10.0
- Livability +4.0/5.0
- Appreciation +3.9/10.0
- DSCR +3.8/10.0
- 1% rule +3.1/10.0
- Condition / age +2.5/5.0
- Rent growth +2.4/5.0
$4,500,000
🖨 Deal sheet (PDF) 📄 Offer letter ✓ Due diligence
Multi-family units
County records classify this as Multi-Family (5+ Unit). Listing-text estimate: 6 units. confirmed
5+ unit building — per-unit beds/baths from public records are typically unavailable; the breakdown below (if shown) is an estimate from the listing text.
Listing remarks
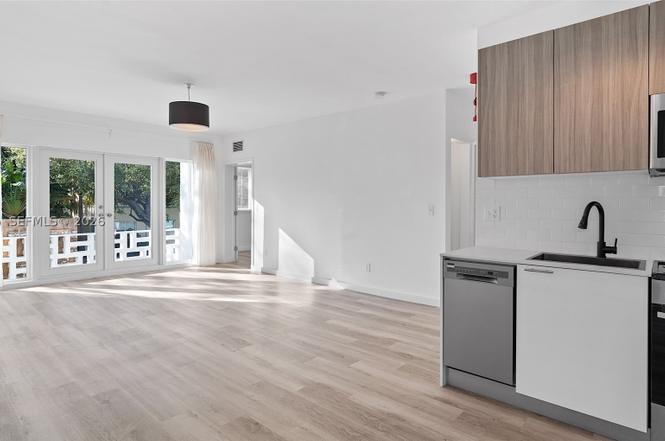
If you are an investor looking for the opportunity to own a multifamily rental income, 1561 Jefferson Avenue is the building for you. Expertly designed by a renowned Australian architect with interiors by Studio de la Vega, the building recently underwent a complete 2-year renovation of all mechanical and electrical wiring, plumbing, insulation, and flooring. The property features modern, bright, and open living spaces ranging from 450 to 895 square feet. Every unit is equipped with essential hurricane-impact windows, in-unit washer/dryer combos, refrigerators and dishwashers. This property sits in a fantastic location of South Beach living, culture, dining, and lifestyle. This is the inves
Key facts
- Turn-key opportunity
- Complete renovation
- Listed 121 days
Tags
Property features AI
Finance
- Other: Rent includes hot water, sewer, trash collection and water; Cable available
- Financial info: Total actual rent for property: $364,800; Operating expenses: $130,904; Sample actual rents by unit type: $2,500 for select 1-bedroom units, $3,000 for select 2-bedroom units, $3,600 for larger 2-bedroom units; Many units currently leased
- HOA & community: Association fees billed annually
Exterior
- Parking: On-street parking
- Security: Smoke detectors in some units
- Utilities: Public water; Public sewer
- Home design: Multifamily property; Two stories; Resale
- Construction: Block construction
- Exterior features: Balconies
Interior
- Kitchen: Dishwasher; Microwave; Range; Refrigerator; Kitchens with separate dining areas
- Bedrooms: One-bedroom units (6 units); Two-bedroom units (6 total units: 4 units of one type, 2 units of another type)
- Flooring: Laminate flooring
- Bathrooms: One-bathroom units (many units); Two full bathrooms (in select two-bedroom units)
- Heating & cooling: Central heating; Central air conditioning; Individual air conditioning units for units
- Interior features: Drapes; Impact glass windows
- Laundry & utility: Washer and dryer in units; Individual electric meters
Neighborhood map
What this means for you Summary
Snapshot
- This is a 6 × 3-bed/2.3-bath units multifamily listed at $4.50M.
Deal economics
- At list price, monthly cash flow is $-873 ($-10k/yr) — negative. Per door: $-145/mo.
- To cash-flow at today's rent, offer at most $4.35M (3.4% below list).
- To meet the 1% rule (rent ≥ 1% of price), the offer needs to be $3.64M (19.1% below list).
- Recommended offer: $3.64M (19.1% below list) — sets the bar for 1% rule.
- Cap rate 6.2% vs local median 1.5% in Miami Beach — top-decile yield for the area; either an underpriced asset or a hidden risk that comps aren't pricing in. Stress-test before assuming the spread holds.
Location & tenants
- Location reads 80/100 on livability (#108 in FL, #1,672 nationally) — a professional / high-income tenant draw. Strengths: crime A+, commute A+, health & safety A+; Watch: housing C-, amenities D-, cost of living F.
- Miami-Dade (suburban): math 45% / reading 54% proficiency, ranked #40 of 73 in FL (top 55%) — families likely to look elsewhere, expect single-tenant / working-renter base with shorter leases; 64% free/reduced lunch — lower-income household profile, screen leases tightly.
- Zoned schools: Miami Beach Feinberg/Fisher K-8 (math 37% / reading 34%, grade F, #1,684 of 2,144 statewide, top 79%, 842 students, 61% FRL); Miami Beach Nautilus Middle School (math 46% / reading 58%, grade C+, #217 of 571 statewide, top 40%, 918 students, 44% FRL); Miami Beach Senior High School (math 21% / reading 48%, grade F, #386 of 667 statewide, top 59%, 2,175 students, 40% FRL) — zoned schools average 48% FRL vs 64% district-wide (16 pts lower); this property's tenant base skews higher-income than the district average.
- Market conditions: Rents soft (-0.4%/yr); 1216 active listings in the ZIP; 10,051 units permitted in Miami-Dade County in 2024 (7,758 in 5+ unit buildings).
- At $36,410/mo this rent would consume 626% of the median local household income ($70k/yr) (locally 4052% of renters already pay >50% of income on rent) — very limited rent-growth headroom before tenants either downsize or default.
Forward outlook
- Local home prices are declining (-2.2%/yr); year-one equity from $31k of loan paydown is wiped out by about $98k of value loss. Plan a longer hold.
- Miami-Dade County population projected at +28% by 2050 — long-run rental-demand tailwind backs the buy-and-hold thesis.
Negotiation context
- It's been on market 121 days — a 12% lower offer ($3.96M) is reasonable based on typical stale-listing flexibility.
- 3 sale attempts since 4y ago; this cycle's ask has dropped $250k (5%) from the opening price — seller is motivated, your offer sets the floor, not the list.
- Current owner paid $1.10M; list at $4.50M implies a 309% gain — meaningful room to come down on a strong offer.
Risks & watch-outs
- Watch-outs: flood insurance adds $427/mo; built in 1957 — expect roof / HVAC / electrical / plumbing capex.
- Climate carrying-cost: in FEMA flood zone AE (mandatory federal flood insurance); severe wind risk, 99% chance of damaging wind over 30y; extreme-heat days projected 8→31/yr by 2055 (HVAC capex compounding) — expect insurance premiums to compound above CPI over the hold.
Questions for the listing agent
- What do current leases actually rent for vs. the listed asking? Can we see a recent rent roll and the last 12 months of T-12 income?
- It's been on market 121 days. Have you received any prior offers? Is the seller open to a 19% concession, seller financing, or rate buy-down credit?
- Can we see the unit-by-unit rent roll, current vacancy, and any below-market leases? What's the average tenancy length?
- What capital expenditures (roof, boiler, parking lot, exteriors) have been made in the last 5 years, and what's planned in the next 2?
- Built in 1957 — when were the roof, HVAC, electrical panel, plumbing, and water heater last replaced?
- What's the actual annual flood-insurance premium (NFIP or private), and is the property in a SFHA with mandatory coverage?
- Why hasn't it sold? Are there any deal-killer items the seller is aware of (foundation, flood, title, zoning, code violations)?
- Is there a deadline driving the sale (1031 exchange, divorce, estate, relocation)? That informs how much negotiation room exists.
- Schools are A-rated — typically a magnet for longer-tenancy family renters. What's the average tenant stay here, and is there a school-zone premium baked into asking?
- The area grade is low — what's the realistic commute time and amenity access for the typical tenant pool here? Any planned neighborhood developments (good or bad) we should know about?
- What's the average days-on-market for RENTAL listings here right now (not sales)? A rising rental-DOM trend means longer vacancies and softer asking-rent achievability than the comps imply.
- What's the recent tenant-quality profile in this submarket — average credit score on applications, eviction rate, late-payment / NSF rate, and stable-employment percentage? A property-management company in the area should have these aggregated.
- How much new apartment / multifamily construction is in the pipeline within 1–3 miles? Heavy new supply (>2% of stock underway) typically softens rents 12–24 months out; light construction supports rent growth.
Investment metrics
- 1% rule
- 0.81% ✗
- Cap rate
- 6.17%
- Cash-on-cash
- -0.42%
- DSCR
- 0.98
- GRM
- 10.3
CMA / ARV
No comps found within radius.
Projected returns pro-forma
-2.19% appreciation · 0.0% rent growth · sell at horizon
- IRR
- -15.6%
- Equity multiple
- 0.42×
- Total profit
- $-737,076
- Equity at exit
- $835,583
- IRR
- -12.4%
- Equity multiple
- 0.21×
- Total profit
- $-990,497
- Equity at exit
- $677,826
Cash invested: $1,260,000 (down + closing). Projections, not guarantees.
Landlord ↔ Tenant lean methodology
- Overall (STATE)
- 87 Strongly Landlord-Friendly
- State Florida
- 87 Strongly Landlord-Friendly · R+3
- County
- — inherits STATE
- City
- — inherits STATE
ZIP-level market 33139
- Home prices YoY
- -0.8%
- Rents YoY
- -0.4%
- Active inventory
- 1216
- Price-to-rent
- 61.8×
Monthly cashflow live
- Estimated rent
- $36,410 medium interval (Pro) →
- Mortgage (P&I)
- −$23,598
- Tax from tax record
- −$3,736 /mo · $44,837/yr
- Insurance
- −$1,875
- Flood insurance flood zone
- −$427 /mo · $5,118/yr
- HOA
- −$0
- Vacancy / Maint / Mgmt
- −$7,646
- Net cashflow
- $-873
Break-even live
Sensitivity live
| Price | -10% $1,675 | -5% $401 | +0% $-873 | +5% $-2,146 | +10% $-3,420 |
|---|---|---|---|---|---|
| Rent | -10% $-3,749 | -5% $-2,311 | +0% $-873 | +5% $566 | +10% $2,004 |
| Rate | -1.0pp $1,394 | -0.5pp $272 | base $-873 | +0.5pp $-2,039 | +1.0pp $-3,225 |
6-unit breakdown (identical units grouped — click to expand)
| Units | Beds | Baths | Est. rent |
|---|---|---|---|
| 6× units | 3 | 2.3 | $36,408 |
| #1 | 3 | 2.3 | $6,068 |
| #2 | 3 | 2.3 | $6,068 |
| #3 | 3 | 2.3 | $6,068 |
| #4 | 3 | 2.3 | $6,068 |
| #5 | 3 | 2.3 | $6,068 |
| #6 | 3 | 2.3 | $6,068 |
| Total (6 units) | $36,410 | ||
UW: 25.0% down · 7.5% · 30yr · 1.5% tax · 5.0% vac · 8.0% maint · 8.0% mgmt
Financing live
Cash to close
- Down payment
- $1,125,000
- Closing costs
- $135,000
- Reserves months
- —
- Total cash needed
- —
Loan-product check · same deal, 3 products live
Conventional
25% down · 7.5% · 30yr
- Down + closing
- —
- Monthly P&I
- —
- Monthly cashflow
- —
- DSCR
- —
- Eligible?
- —
Personal DTI + credit; lowest rate.
DSCR
20% down · 8.5% · 30yr
- Down + closing
- —
- Monthly P&I
- —
- Monthly cashflow
- —
- DSCR
- —
- Eligible?
- —
No personal income docs; deal must DSCR.
Hard money
10% down · 12.0% · 12mo
- Down + closing
- —
- Monthly P&I
- —
- Monthly cashflow
- —
- DSCR
- —
- Eligible?
- —
Short-term bridge; refi at stabilization.
Listing history 24 events
-
2026-06-21days on market $4,500,000 Active 121 DOM
-
2026-06-18days on market $4,500,000 Active 118 DOM
-
2026-06-17days on market $4,500,000 Active 117 DOM
-
2026-06-16days on market $4,500,000 Active 116 DOM
-
2026-06-15days on market $4,500,000 Active 115 DOM
-
2026-06-13days on market $4,500,000 Active 113 DOM
-
2026-06-09days on market $4,500,000 Active 109 DOM
-
2026-06-08days on market $4,500,000 Active 108 DOM
-
2026-06-07pricedays on market $4,500,000 Active 107 DOM
-
2026-06-04days on market $4,750,000 Active 104 DOM
-
2026-06-03days on market $4,750,000 Active 103 DOM
-
2026-06-02days on market $4,750,000 Active 102 DOM
-
2026-06-01days on market $4,750,000 Active 101 DOM
-
2026-05-31days on market $4,750,000 Active 100 DOM
-
2026-02-20$4,750,000 Active
-
2025-09-29historical
-
2024-12-04price $4,950,000
-
2024-11-12price $5,000,000
-
2024-07-01$4,900,000 Active
-
2023-02-22historical
-
2023-02-08price $5,500,000
-
2022-12-15$6,000,000 Active
-
2018-04-17soldstatus $1,100,000
-
2018-04-17soldstatus $1,950,000
ⓘ Source: listings_history table (triggers on properties + properties_extension) + one-shot
backfill from property_details.listing_events for pre-trigger history.
Tax reassessment forecast FL · Resets to sale price
- Current annual tax
- $44,837 · $3,736/mo
- Projected year-2 tax
- $44,837 · $3,736/mo
- Expected delta
- $0/yr ($0/mo · 0.0%)
ⓘ Screening estimate from a state-policy table — verify with the county assessor before closing.
Climate risk First Street
- Flood 9/10 Extreme FEMA zone AE · 99% chance over 30 yrs
- Wildfire 4/10 Moderate
- Heat 10/10 Extreme 8 d/yr ≥101°F today · 31 d/yr by 30 yrs out
- Wind 10/10 Extreme 99% chance of damaging wind over 30 yrs
- Air quality 2/10 Low 1 unhealthy d/yr today · 1 by 30 yrs out
Nearby sold comps map
Loading sold comps map…
Walkable amenities ~0.75 mi
Loading nearby amenities…
Taxation est. · year 1
- Rental income
- $436,920
- − Mortgage interest
- −$252,070
- − Property taxes
- −$44,837
- − Insurance
- −$27,618
- − Repairs & maintenance
- −$34,954
- − Management
- −$34,954
- − Depreciation
- −$130,909
- Taxable loss
- −$88,421
- Est. tax savings @ 24.0%
- +$21,221
- After-tax cash flow
- $10,751/yr
For passive investors: Depreciation is non-cash, so a rental often shows a tax loss while cash-flowing — sheltering income. Rental losses are passive: they offset passive income freely, and up to $25,000/yr can offset ordinary (W-2) income if you actively participate and your MAGI is under $100k (phasing out to $0 by $150k); unused losses carry forward. On sale, claimed depreciation is recaptured at up to 25%, and gains may owe capital-gains tax (a 1031 exchange can defer both). Figures are a year-1 estimate at your 24.0% rate — not tax advice; consult a CPA.
Schools (NCES district)
- District
- Miami-Dade
- NCES district ID
- 1200390
- Math proficiency
- 45% ▼ -16.00%
- Reading proficiency
- 54% ▼ -5.00%
- Median HH income
- $43,928
- Composite
- 41.76/100
- National rank
- #3397
- State rank
- #40 of 73 in FL
Livability — Miami Beach
- Score
- 80/100
- State rank
- #108
- US rank
- #1672
Category grades
Schools grade is shown separately in the Schools card above.
Census & demographics
- Census place
- Miami Beach, FL
- County
- Miami-Dade County · 2,697,751 people
- City population
- 90,533
- Metro
- Miami-Fort Lauderdale-Pompano Beach, FL
- Population (ZIP)
- 33,753
- Household income
- $69,793
- Rent vs Own
- Severe rent burden
- 4052.0
Population outlook (Miami-Dade County) Hauer SSP2
- Today (2025)
- 3,126,439 people
- By 2030
- 3,325,765 · +6.4%
- By 2040
- 3,697,561 · +18.3%
- By 2050
- 4,012,134 · +28.3%
- By 2075
- 4,605,612 · +47.3%
- By 2100
- 4,866,598 · +55.7%
Race, ethnicity, and origin ACS 2023
- Neighborhood character
- Diverse neighborhood (Simpson 0.58)
- Race & ethnicity
- Hispanic / Latino 51% White 40% Two or more races 17% Black 4% Asian 3%
- Hispanic origin (detail)
- Mexican 2% Puerto Rican 2% Cuban 15% Salvadoran 3%
- Common ancestry
- Lithuanian 3% Scotch-Irish 2% Romanian 2%
- Foreign-born
- 56% · Canada, Jamaica, Dominican Republic
- Languages at home
- 37% English-only · Spanish 49% Other Indo-European 5% French/Haitian/Cajun 3%
Political lean MEDSL · Miami-Dade
- 2024 margin
- R (+11.4) · D 43.9% · R 55.4%
- 2008→2024 swing
- -27.6pp toward R · 2008: 16.1pp · 2024: -11.4pp
- All cycles
- 2024: R+11.4 2020: D+7.3 2016: D+29.6 2012: D+23.7 2008: D+16.1
Not yet ingested
- Civics
- —
Market trends
- HPI YoY
- ▼ -2.19%
- Current HPI
- 277.9321
- Rent YoY
- ▼ -0.36%
- Metro
- Miami-Fort Lauderdale-Pompano Beach, FL
- State GDP YoY
- ▲ 3.28%
- F500 in state
- 36
Industry mix (Fortune 500 HQ in FL)
| Industry | F500 HQs | Revenue |
|---|---|---|
| Industrial Technology | 2 | $29B |
|
||
| Insurance | 2 | $17B |
|
||
| Retail | 1 | $60B |
|
||
| Technology Distribution | 1 | $58B |
|
||
| Homebuilding | 1 | $35B |
|
||
| Technology Manufacturing | 1 | $35B |
|
||
Price history
+331.8% since first listed10 events — show timeline
- 2026-02-20 Listed $4,750,000 MARMLS
- 2025-09-29 Listing Removed — MARMLS
- 2024-12-04 Price Changed $4,950,000 MARMLS
- 2024-11-12 Price Changed $5,000,000 MARMLS
- 2024-07-01 Listed $4,900,000 MARMLS
- 2023-02-22 Listing Removed — MARMLS
- 2023-02-08 Price Changed $5,500,000 MARMLS
- 2022-12-15 Listed $6,000,000 MARMLS
- 2018-04-17 Sold (Public Records) $1,950,000 Public Records
- 2018-04-17 Sold (Public Records) $1,100,000 Public Records
Property tax history
+4.9%/yrLatest (2025): $44,837 · +3.7% YoY. Source: county tax records.
Cash-flow waterfall
monthlySold comps — $/sqft
last 12 mo · ≤1 miLoading sold comps…