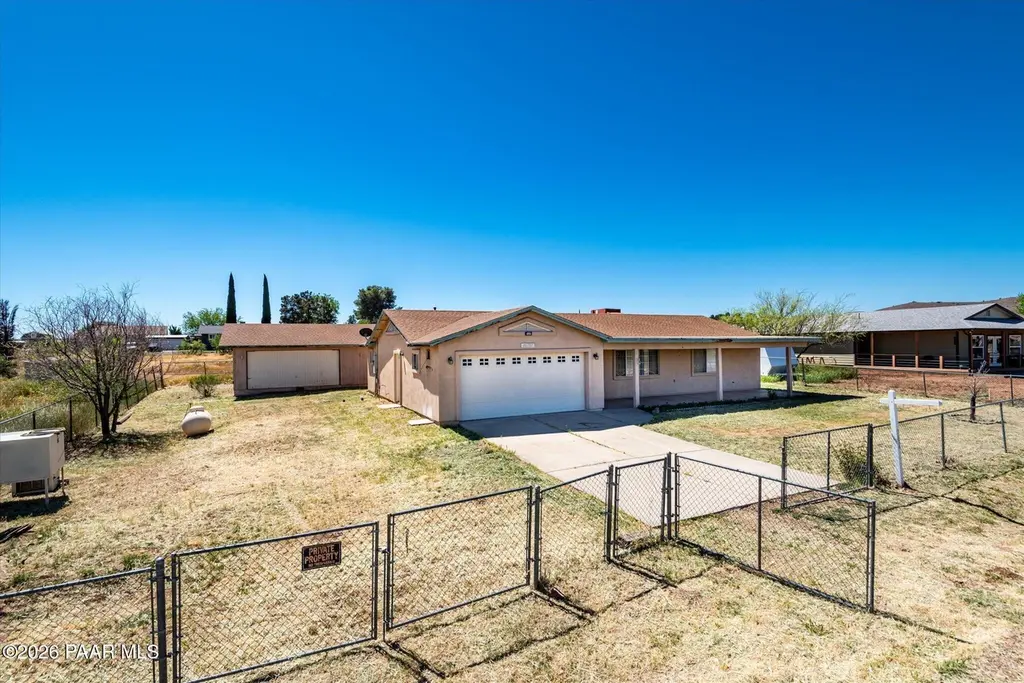
20287 E Sierra Dr · Cordes Lakes, AZ
Flood risk 1/10 · Minimal
- FEMA flood zone
- X (unshaded)
- Chance of flooding over 30 yrs
- 0.0%
- Est. flood insurance / yr
- $507 – $1,088
Fire risk 6/10 · Moderate
- Est. fire insurance / yr
- $610 – $1,132
Heat risk 6/10 · Moderate
- Hot days now (above 101°F)
- 7 days/yr
- Hot days in 30 yrs
- 17 days/yr
Wind risk 1/10 · Minimal
- Chance of severe wind over 30 yrs
- —
Air-quality risk 2/10 · Minimal
- Unhealthy air days now
- 1 days/yr
- Unhealthy air days in 30 yrs
- 1 days/yr
Risk factors via First Street. Map © Google.
Why this score? — see what drove the D+ grade
The composite is a weighted blend of 9 inputs, each scored 0–100. Each bar is that input's sub-score; the figure is the points it added to the 100-point composite (weight × sub-score).
- ARV discount +15.0/15.0
- Appreciation +10.0/10.0
- Cash flow +8.4/30.0
- Livability +3.0/5.0
- Rent growth +2.5/5.0
- Condition / age +2.5/5.0
- DSCR +2.3/10.0
- Schools +2.0/10.0
- 1% rule +1.5/10.0
$295,000
🖨 Deal sheet 📄 Offer letter ✓ Due diligence
Listing remarks MLS
OWC W/$70,000 DOWN, SELLER PREFERS FATCO - PV - FULL COVERED FRONT AND REA PATIOS ARCHITECTURAL SHINGLES, 2 X 6 CONSTRUCTION RV AREA, CERAMIC TILE UPGRADED CARPET AND KITCHEN CABINETS, LOADS OF STORAGE AND MORE 2 Car,Attached,RV
Key facts
- 0.26 acre lot
- 2 garage spots
- Built 1999
Property features AI
Finance
- Other: County-maintained paved road frontage; Zoning: R1L; Subdivision: Cordes Lakes
- HOA & community: Not a senior community
Exterior
- Parking: 2 total parking spaces; 2-car garage; RV parking/garage available
- Utilities: Electricity available; Propane (rent and available); Propane water heater; Septic (WWT - septic conventional); Other water utilities (per listing)
- Home design: Single-family residence; Single-story
- Construction: Stucco exterior; Composition roof; Slab foundation; Double-pane windows; Built area approximately 1,692
- Exterior features: Covered patio/porch; Concrete driveway; Front landscaping; Perimeter fencing; Views
Interior
- Kitchen: Dishwasher; Oven; Range
- Bedrooms: 4 possible bedrooms
- Flooring: Carpet; Tile
- Bathrooms: 1 full bathroom; 1 three-quarter bathroom (total 2 bathrooms)
- Heating & cooling: Forced gas heating; Propane heating; Central air; Ceiling fans
- Interior features: Kitchen/dining combination; Walk-in closet(s); Washer/dryer connection; Family room; Laundry room; Additional room (see remarks)
- Laundry & utility: Washer/dryer connection; Laundry room
Neighborhood map
What this means for you Summary
Snapshot
- This is a 3-bed/2.0-bath single-family listed at $295k.
Deal economics
- At list price, monthly cash flow is $-265 ($-3k/yr) — negative.
- To cash-flow at today's rent, offer at most $248k (15.8% below list).
- To meet the 1% rule (rent ≥ 1% of price), the offer needs to be $193k (34.6% below list).
- Recommended offer: $193k (34.6% below list) — sets the bar for 1% rule.
Location & tenants
- Location reads 60/100 on livability (#181 in AZ) — a middle-class / working-renter tenant base. Strengths: cost of living A+, housing A+, crime A-; Watch: schools F, amenities F, commute F.
- Mayer Unified School District (4473) (rural): math 23% / reading 26% proficiency, ranked #165 of 249 in AZ (top 66%) — low school quality limits family demand, transient renter base, plan for 1-2y turnover; 80% free/reduced lunch — lower-income household profile, screen leases tightly.
- Market conditions: 242 active listings in the ZIP; 2,062 units permitted in Yavapai County in 2024 (98 in 5+ unit buildings).
Forward outlook
- In year one you build about $32k of equity ($2k loan paydown + $30k appreciation (10.0% local appreciation)).
- Yavapai County population projected at +10% by 2050 — modest demand growth; plan on rents tracking national, not racing it.
- By year 2, paydown + projected appreciation supports a ~$51k cash-out refi (75% LTV) — recoverable capital for the next deal without selling this one.
Negotiation context
- It's been on market 84 days — a 6% lower offer ($277k) is reasonable based on typical stale-listing flexibility.
- Current owner paid $106k; list at $295k implies a 177% gain — meaningful room to come down on a strong offer.
Risks & watch-outs
- Climate carrying-cost: major wildfire risk; extreme-heat days projected 7→17/yr by 2055 (HVAC capex compounding) — expect insurance premiums to compound above CPI over the hold.
Questions for the listing agent
- What do current leases actually rent for vs. the listed asking? Can we see a recent rent roll and the last 12 months of T-12 income?
- It's been on market 84 days. Have you received any prior offers? Is the seller open to a 35% concession, seller financing, or rate buy-down credit?
- Why hasn't it sold? Are there any deal-killer items the seller is aware of (foundation, flood, title, zoning, code violations)?
- Is there a deadline driving the sale (1031 exchange, divorce, estate, relocation)? That informs how much negotiation room exists.
- Schools are F-rated, which usually means shorter tenancies and higher turnover. Who's the typical renter profile here, and what's been the actual vacancy rate?
- The area grade is low — what's the realistic commute time and amenity access for the typical tenant pool here? Any planned neighborhood developments (good or bad) we should know about?
- What's the average days-on-market for RENTAL listings here right now (not sales)? A rising rental-DOM trend means longer vacancies and softer asking-rent achievability than the comps imply.
- What's the recent tenant-quality profile in this submarket — average credit score on applications, eviction rate, late-payment / NSF rate, and stable-employment percentage? A property-management company in the area should have these aggregated.
- How much new for-sale + rental construction is in the pipeline within 1–3 miles? Heavy new supply typically softens prices + rents 12–24 months out; constrained supply supports both.
Investment metrics
- 1% rule
- 0.65% ✗
- Cap rate
- 5.22%
- Cash-on-cash
- -3.84%
- DSCR
- 0.83
- GRM
- 12.7
CMA / ARV
- ARV (on-the-fly)
- $360,396
- Comps found
- 12
Show comp detail 12 sales within ~0.75 mi
| Address | Dist | Beds/Ba | Sqft | Sold | Price | $/sf | Match |
|---|---|---|---|---|---|---|---|
| 15853 S Maverick Trl | 0.30mi | 3/2.0 | 1,782 (+5%) | 1mo | $274,900 | $154 | 77 |
| 20100 E Mesa Verde Rd | 0.33mi | 3/2.0 | 1,678 (-1%) | 12mo | $359,000 | $214 | 73 |
| 15318 S Cordes Lakes Dr | 0.37mi | 3/2.0 | 1,612 (-5%) | 3mo | $415,000 | $257 | 72 |
| 20187 E Mingus Dr | 0.34mi | 3/2.0 | 1,620 (-4%) | 11mo | $265,000 | $164 | 68 |
| 20187 E Ocotillo Dr | 0.20mi | 3/2.0 | 1,834 (+8%) | 11mo | $375,000 | $204 | 67 |
| 20140 E Ocotillo Dr | 0.26mi | 3/2.0 | 1,856 (+10%) | 10mo | $395,000 | $213 | 63 |
| 15630 S Oasis Rd | 0.20mi | 3/2.0 | 1,515 (-10%) | 16mo | $385,000 | $254 | 60 |
| 20558 E Mesa Verde Rd | 0.65mi | 3/2.0 | 1,631 (-4%) | 7mo | $320,000 | $196 | 57 |
| 15869 S Chestnut Ln | 0.25mi | 3/2.0 | 1,456 (-14%) | 10mo | $279,900 | $192 | 56 |
| 20002 E Zaragoza Dr | 0.33mi | 2/2.0 (-1) | 1,474 (-13%) | 12mo | $320,000 | $217 | 48 |
| 19981 E Zaragoza Dr | 0.36mi | 2/2.0 (-1) | 1,500 (-11%) | 14mo | $310,000 | $207 | 48 |
| 19680 E Ironwood Dr | 0.57mi | 3/2.0 | 1,496 (-12%) | 12mo | $330,000 | $221 | 44 |
Match score weights: distance 35% · size 25% · config 20% · recency 20%. Top-matched comps best support the ARV.
Projected returns pro-forma
10.0% appreciation · 3.0% rent growth · sell at horizon
- IRR
- 21.5%
- Equity multiple
- 2.74×
- Total profit
- $143,693
- Equity at exit
- $265,759
- IRR
- 19.4%
- Equity multiple
- 6.28×
- Total profit
- $436,154
- Equity at exit
- $573,120
Cash invested: $82,600 (down + closing). Projections, not guarantees.
Landlord ↔ Tenant lean methodology
- Overall (STATE)
- 87 Strongly Landlord-Friendly
- State Arizona
- 87 Strongly Landlord-Friendly · R+3
- County
- — inherits STATE
- City
- — inherits STATE
ZIP-level market 86333
- Home prices YoY
- 17.3%
- Active inventory
- 242
- Price-to-rent
- 12.7×
Monthly cashflow live
- Estimated rent
- $1,931 medium interval (Pro) →
- Mortgage (P&I)
- −$1,547
- Tax from tax record
- −$120 /mo · $1,439/yr
- Insurance
- −$123
- HOA
- −$0
- Vacancy / Maint / Mgmt
- −$405
- Net cashflow
- $-265
Break-even live
UW: 25.0% down · 7.5% · 30yr · 1.5% tax · 5.0% vac · 8.0% maint · 8.0% mgmt
Financing live
Cash to close
- Down payment
- $73,750
- Closing costs
- $8,850
- Reserves months
- —
- Total cash needed
- —
Loan-product check · same deal, 3 products live
Conventional
25% down · 7.5% · 30yr
- Down + closing
- —
- Monthly P&I
- —
- Monthly cashflow
- —
- DSCR
- —
- Eligible?
- —
Personal DTI + credit; lowest rate.
DSCR
20% down · 8.5% · 30yr
- Down + closing
- —
- Monthly P&I
- —
- Monthly cashflow
- —
- DSCR
- —
- Eligible?
- —
No personal income docs; deal must DSCR.
Hard money
10% down · 12.0% · 12mo
- Down + closing
- —
- Monthly P&I
- —
- Monthly cashflow
- —
- DSCR
- —
- Eligible?
- —
Short-term bridge; refi at stabilization.
Listing history 20 events
-
2026-06-18days on market $295,000 Active 84 DOM
-
2026-06-17days on market $295,000 Active 83 DOM
-
2026-06-16days on market $295,000 Active 82 DOM
-
2026-06-15days on market $295,000 Active 81 DOM
-
2026-06-14days on market $295,000 Active 79 DOM
-
2026-06-13days on market $295,000 Active 78 DOM
-
2026-06-10days on market $295,000 Active 76 DOM
-
2026-06-09days on market $295,000 Active 75 DOM
-
2026-06-08days on market $295,000 Active 74 DOM
-
2026-06-07statusdays on market $295,000 Active 73 DOM
-
2026-06-03days on market $295,000 Active Under Contract 69 DOM
-
2026-06-02days on market $295,000 Active Under Contract 68 DOM
-
2026-06-01days on market $295,000 Active Under Contract 67 DOM
-
2026-05-31days on market $295,000 Active Under Contract 66 DOM
-
2026-05-30days on market $295,000 Active Under Contract 65 DOM
-
2026-04-30historical Active Under Contract
-
2026-04-16price $295,000
-
2026-03-26$299,000 Active
-
1999-06-23soldstatus $106,500 228-char remark
Show marketing remark (228 chars)
OWC W/$70,000 DOWN, SELLER PREFERS FATCO - PV - FULL COVERED FRONT AND REA PATIOS ARCHITECTURAL SHINGLES, 2 X 6 CONSTRUCTION RV AREA, CERAMIC TILE UPGRADED CARPET AND KITCHEN CABINETS, LOADS OF STORAGE AND MORE 2 Car,Attached,RV
-
1999-06-22soldstatus $106,300
ⓘ Source: listings_history table (triggers on properties + properties_extension) + one-shot
backfill from property_details.listing_events for pre-trigger history.
Tax reassessment forecast AZ · Resets to sale price
- Current annual tax
- $1,439 · $120/mo
- Projected year-2 tax
- $1,947 · $162/mo
- Expected delta
- +$508/yr (+$42/mo · 35.3%)
ⓘ Screening estimate from a state-policy table — verify with the county assessor before closing.
Climate risk First Street
- Flood 1/10 Low FEMA zone X (unshaded) · 0% chance over 30 yrs
- Wildfire 6/10 Major
- Heat 6/10 Major 7 d/yr ≥101°F today · 17 d/yr by 30 yrs out
- Wind 1/10 Low
- Air quality 2/10 Low 1 unhealthy d/yr today · 1 by 30 yrs out
Nearby sold comps map
Loading sold comps map…
Walkable amenities ~0.75 mi
Loading nearby amenities…
Taxation est. · year 1
- Rental income
- $23,169
- − Mortgage interest
- −$16,525
- − Property taxes
- −$1,439
- − Insurance
- −$1,475
- − Repairs & maintenance
- −$1,854
- − Management
- −$1,854
- − Depreciation
- −$8,582
- Taxable loss
- −$8,558
- Est. tax savings @ 24.0%
- +$2,054
- After-tax cash flow
- $-1,120/yr
For passive investors: Depreciation is non-cash, so a rental often shows a tax loss while cash-flowing — sheltering income. Rental losses are passive: they offset passive income freely, and up to $25,000/yr can offset ordinary (W-2) income if you actively participate and your MAGI is under $100k (phasing out to $0 by $150k); unused losses carry forward. On sale, claimed depreciation is recaptured at up to 25%, and gains may owe capital-gains tax (a 1031 exchange can defer both). Figures are a year-1 estimate at your 24.0% rate — not tax advice; consult a CPA.
Schools (NCES district)
- District
- Mayer Unified School District (4473)
- NCES district ID
- 0404820
- Math proficiency
- 23% ▼ -11.00%
- Reading proficiency
- 26% ▼ -13.00%
- Median HH income
- $35,108
- Composite
- 20.22/100
- National rank
- #8627
- State rank
- #165 of 249 in AZ
Livability — Cordes Lakes
- Score
- 60/100
- State rank
- #181
- US rank
- #19144
Category grades
Schools grade is shown separately in the Schools card above.
Census & demographics
- Census place
- Cordes Lakes, AZ
- Population (ZIP)
- 6,425
Population outlook (Yavapai County) Hauer SSP2
- Today (2025)
- 241,389 people
- By 2030
- 249,523 · +3.4%
- By 2040
- 259,966 · +7.7%
- By 2050
- 264,736 · +9.7%
- By 2075
- 269,334 · +11.6%
- By 2100
- 256,505 · +6.3%
Race, ethnicity, and origin ACS 2023
- Neighborhood character
- Predominantly White (77%)
- Race & ethnicity
- White 77% Two or more races 15% Hispanic / Latino 14%
- Hispanic origin (detail)
- Mexican 11% Puerto Rican 1%
- Common ancestry
- Lithuanian 6% Iranian 3% Romanian 3%
- Foreign-born
- 5% · Canada
- Languages at home
- 93% English-only · Spanish 6% Russian/Polish/Slavic 1%
Political lean MEDSL · Yavapai
- 2024 margin
- Solid R (+33.9) · D 32.6% · R 66.5%
- 2008→2024 swing
- -9.5pp toward R · 2008: -24.4pp · 2024: -33.9pp
- All cycles
- 2024: R+33.9 2020: R+29.3 2016: R+31.4 2012: R+30.7 2008: R+24.4
Not yet ingested
- Civics
- —
Market trends
- HPI YoY
- ▲ 55.51%
- Current HPI
- 376.0374
- Rent YoY
- —
- Metro
- —
- State GDP YoY
- ▲ 4.54%
- F500 in state
- 20
Industry mix (Fortune 500 HQ in AZ)
| Industry | F500 HQs | Revenue |
|---|---|---|
| Technology | 2 | $13B |
|
||
| Mining / Metals | 1 | $23B |
|
||
| Environmental Services | 1 | $16B |
|
||
| Metals / Steel | 1 | $14B |
|
||
| Technology Distribution | 1 | $9B |
|
||
| Homebuilding | 1 | $8B |
|
||
Price history
+177.5% since first listed5 events — show timeline
- 2026-04-30 Contingent — PAARMLS as Distributed by MLS Grid
- 2026-04-16 Price Changed $295,000 PAARMLS as Distributed by MLS Grid
- 2026-03-26 Listed $299,000 PAARMLS as Distributed by MLS Grid
- 1999-06-23 Sold (MLS) $106,500 PAARMLS as Distributed by MLS Grid
- 1999-06-22 Sold (Public Records) $106,300 Public Records
Property tax history
+4.5%/yrLatest (2025): $1,439 · +6.1% YoY. Source: county tax records.
Cash-flow waterfall
monthlySold comps — $/sqft
last 12 mo · ≤1 miLoading sold comps…