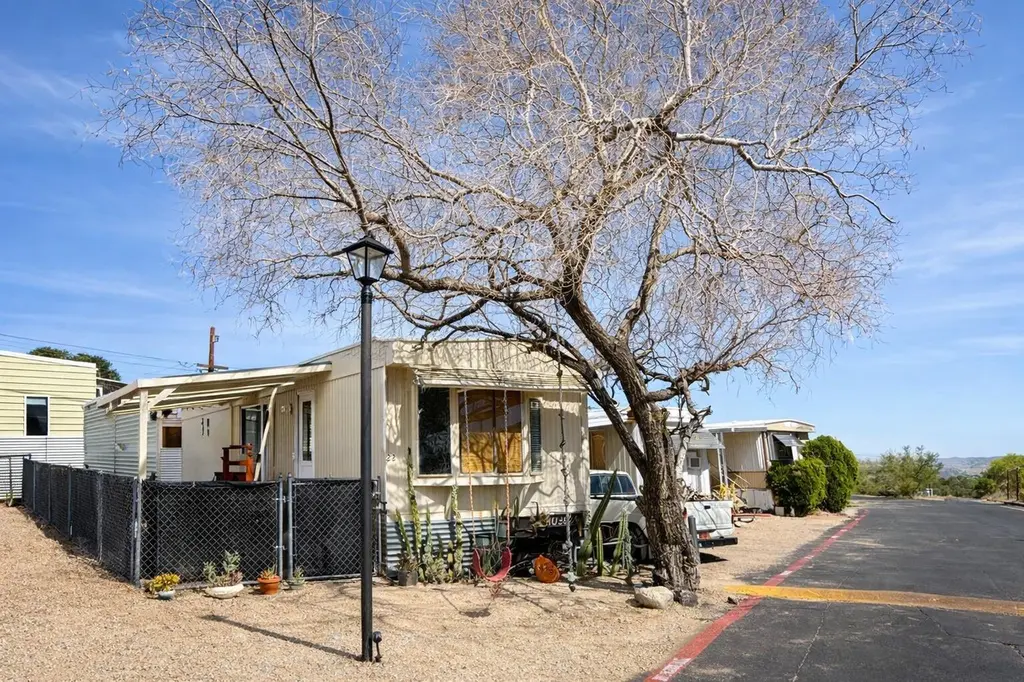
6117 Valley View St #22 · Joshua Tree, CA
Flood risk 1/10 · Minimal
- FEMA flood zone
- X (unshaded)
- Chance of flooding over 30 yrs
- 0.0%
- Est. flood insurance / yr
- $507 – $1,088
Fire risk 4/10 · Minor
- Est. fire insurance / yr
- $659 – $1,223
Heat risk 7/10 · Major
- Hot days now (above 99°F)
- 7 days/yr
- Hot days in 30 yrs
- 21 days/yr
Wind risk 1/10 · Minimal
- Chance of severe wind over 30 yrs
- —
Air-quality risk 6/10 · Moderate
- Unhealthy air days now
- 10 days/yr
- Unhealthy air days in 30 yrs
- 14 days/yr
Risk factors via First Street. Map © Google.
Why this score? — see what drove the D grade
The composite is a weighted blend of 9 inputs, each scored 0–100. Each bar is that input's sub-score; the figure is the points it added to the 100-point composite (weight × sub-score).
- Cash flow +15.0/30.0
- ARV discount +7.5/15.0
- 1% rule +5.0/10.0
- DSCR +5.0/10.0
- Condition / age +3.8/5.0
- Livability +2.5/5.0
- Rent growth +2.2/5.0
- Schools +2.2/10.0
- Appreciation +0.0/10.0
$35,000
🖨 Deal sheet (PDF) 📄 Offer letter ✓ Due diligence
Listing remarks MLS
Modern updates and desert charm come together in this adorable, move-in-ready home perched on a hill with sweeping mountain views. Whether you're an investor looking for strong rental potential or a family wanting to stay close while enjoying separate spaces, this property offers incredible versatility--live in one and rent out the other! Located in a small, welcoming community just minutes from downtown Joshua Tree, you'll have easy access to local shops, dining, and vibrant nightlife. Inside, the home has been thoughtfully updated with new plank vinyl and tile flooring, creating a clean, contemporary feel throughout. The bathroom features stylish tile floors, a beautifully tiled shower and a chic sliding barn door that adds both character and space-saving functionality. A dedicated laundry area with washer and dryer adds convenience and functionality. The spacious kitchen shines with an updated subway tile backsplash, perfect for both everyday living and entertaining. Set in a peaceful elevated location, you'll enjoy breathtaking desert and mountain views right from your doorstep. Purchase with Space 23 and both can be yours for just $80,000--an incredible opportunity you don't want to miss. Must see!
Key facts
- Laundry area
- Sliding barn door
- Mountain views
Tags
Neighborhood map
What this means for you Summary
Snapshot
- This is a 1-bed/1.0-bath manufactured listed at $35k. Condition is rated good.
Deal economics
- At list price, monthly cash flow is $929 ($11k/yr) — positive.
- The deal already cash-flows at list — no discount required.
- Meets the 1% rule at list price ($1k rent vs $35k).
- Recommended offer: $32k (9.0% below list) — sets the bar for market timing.
- Cap rate 38.1% vs local median 2.7% in Joshua Tree — top-decile yield for the area; either an underpriced asset or a hidden risk that comps aren't pricing in. Stress-test before assuming the spread holds.
Location & tenants
- Location reads 50/100 on livability (#1,114 in CA) — a working-class tenant base; expect higher turnover. Strengths: housing A+; Watch: schools F, crime F, amenities F.
- Morongo Unified (town): math 15% / reading 38% proficiency, ranked #395 of 517 in CA (top 76%) — low school quality limits family demand, transient renter base, plan for 1-2y turnover.
- Market conditions: Rents soft (-1.1%/yr); 534 active listings in the ZIP; 1 comparable units currently listed for rent nearby; 5,458 units permitted in San Bernardino County in 2024 (1,500 in 5+ unit buildings).
Forward outlook
- Local home prices are declining (-3.0%/yr); year-one equity from $242 of loan paydown is wiped out by about $1k of value loss. Plan a longer hold.
- San Bernardino County population projected at +15% by 2050 — modest demand growth; plan on rents tracking national, not racing it.
- At projected returns (-3.0% appreciation + 0.0% rent growth), your $10k cash investment doubles in ~1 year — after that, you're playing with house money.
Negotiation context
- It's been on market 93 days — a 9% lower offer ($32k) is reasonable based on typical stale-listing flexibility.
Risks & watch-outs
- Climate carrying-cost: extreme-heat days projected 7→21/yr by 2055 (HVAC capex compounding) — expect insurance premiums to compound above CPI over the hold.
Questions for the listing agent
- It's been on market 93 days. Have you received any prior offers? Is the seller open to a 9% concession, seller financing, or rate buy-down credit?
- Built in 1965 — when were the roof, HVAC, electrical panel, plumbing, and water heater last replaced?
- Why hasn't it sold? Are there any deal-killer items the seller is aware of (foundation, flood, title, zoning, code violations)?
- Is there a deadline driving the sale (1031 exchange, divorce, estate, relocation)? That informs how much negotiation room exists.
- Schools are F-rated, which usually means shorter tenancies and higher turnover. Who's the typical renter profile here, and what's been the actual vacancy rate?
- Crime grade is F in this area — have there been break-ins, vandalism, or insurance claims at this property in the last 3 years? What carrier currently insures it and at what premium?
- The area grade is low — what's the realistic commute time and amenity access for the typical tenant pool here? Any planned neighborhood developments (good or bad) we should know about?
- What's the average days-on-market for RENTAL listings here right now (not sales)? A rising rental-DOM trend means longer vacancies and softer asking-rent achievability than the comps imply.
- What's the recent tenant-quality profile in this submarket — average credit score on applications, eviction rate, late-payment / NSF rate, and stable-employment percentage? A property-management company in the area should have these aggregated.
- How much new for-sale + rental construction is in the pipeline within 1–3 miles? Heavy new supply typically softens prices + rents 12–24 months out; constrained supply supports both.
Investment metrics
- 1% rule
- 4.23% ✓
- Cap rate
- 38.13%
- Cash-on-cash
- 113.70%
- DSCR
- 6.06
- GRM
- 2.0
CMA / ARV
No comps found within radius.
Projected returns pro-forma
-3.0% appreciation · 0.0% rent growth · sell at horizon
- IRR
- —
- Equity multiple
- 6.02×
- Total profit
- $49,149
- Equity at exit
- $5,219
- IRR
- —
- Equity multiple
- 11.43×
- Total profit
- $102,261
- Equity at exit
- $3,026
Cash invested: $9,800 (down + closing). Projections, not guarantees.
Landlord ↔ Tenant lean methodology
- Overall (STATE)
- 18 Strongly Tenant-Friendly
- State California
- 18 Strongly Tenant-Friendly · D+13
- County
- — inherits STATE
- City
- — inherits STATE
ZIP-level market 92252
- Home prices YoY
- -7.1%
- Rents YoY
- -1.1%
- Active inventory
- 534
- Price-to-rent
- 2.0×
Monthly cashflow live
- Estimated rent
- $1,482 medium interval (Pro) →
- Mortgage (P&I)
- −$184
- Tax est. 1.5%
- −$44 /mo · $525/yr
- Insurance
- −$15
- HOA
- −$0
- Vacancy / Maint / Mgmt
- −$311
- Net cashflow
- $929
Break-even live
Sensitivity live
| Price | -10% $953 | -5% $941 | +0% $929 | +5% $916 | +10% $904 |
|---|---|---|---|---|---|
| Rent | -10% $812 | -5% $870 | +0% $929 | +5% $987 | +10% $1,046 |
| Rate | -1.0pp $946 | -0.5pp $937 | base $929 | +0.5pp $919 | +1.0pp $910 |
UW: 25.0% down · 7.5% · 30yr · 1.5% tax · 5.0% vac · 8.0% maint · 8.0% mgmt
Financing live
Cash to close
- Down payment
- $8,750
- Closing costs
- $1,050
- Reserves months
- —
- Total cash needed
- —
Loan-product check · same deal, 3 products live
Conventional
25% down · 7.5% · 30yr
- Down + closing
- —
- Monthly P&I
- —
- Monthly cashflow
- —
- DSCR
- —
- Eligible?
- —
Personal DTI + credit; lowest rate.
DSCR
20% down · 8.5% · 30yr
- Down + closing
- —
- Monthly P&I
- —
- Monthly cashflow
- —
- DSCR
- —
- Eligible?
- —
No personal income docs; deal must DSCR.
Hard money
10% down · 12.0% · 12mo
- Down + closing
- —
- Monthly P&I
- —
- Monthly cashflow
- —
- DSCR
- —
- Eligible?
- —
Short-term bridge; refi at stabilization.
Rent comps 1 comps
| Address | Beds | Baths | Sqft | Rent | $/sqft | DOM | Units | Dist |
|---|---|---|---|---|---|---|---|---|
| 6610 Park Blvd Unit A Joshua Tree, CA | 2.0 | 1.0 | 500 | $1,195 | $2.39 | 45d | 1 | 0.70mi |
Listing history 16 events
-
2026-06-21days on market $35,000 Active 93 DOM
-
2026-06-18days on market $35,000 Active 90 DOM
-
2026-06-17days on market $35,000 Active 89 DOM
-
2026-06-16days on market $35,000 Active 88 DOM
-
2026-06-15days on market $35,000 Active 87 DOM
-
2026-06-13days on market $35,000 Active 85 DOM
-
2026-06-13days on market $35,000 Active 84 DOM
-
2026-06-09days on market $35,000 Active 81 DOM
-
2026-06-08days on market $35,000 Active 80 DOM
-
2026-06-07pricedays on market $35,000 Active 79 DOM
-
2026-06-04days on market $43,000 Active 76 DOM
-
2026-06-03days on market $43,000 Active 75 DOM
-
2026-06-02days on market $43,000 Active 74 DOM
-
2026-06-01days on market $43,000 Active 73 DOM
-
2026-05-31days on market $43,000 Active 72 DOM
-
2026-03-19$43,000 Active 1222-char remark
Show marketing remark (1222 chars)
Modern updates and desert charm come together in this adorable, move-in-ready home perched on a hill with sweeping mountain views. Whether you're an investor looking for strong rental potential or a family wanting to stay close while enjoying separate spaces, this property offers incredible versatility--live in one and rent out the other! Located in a small, welcoming community just minutes from downtown Joshua Tree, you'll have easy access to local shops, dining, and vibrant nightlife. Inside, the home has been thoughtfully updated with new plank vinyl and tile flooring, creating a clean, contemporary feel throughout. The bathroom features stylish tile floors, a beautifully tiled shower and a chic sliding barn door that adds both character and space-saving functionality. A dedicated laundry area with washer and dryer adds convenience and functionality. The spacious kitchen shines with an updated subway tile backsplash, perfect for both everyday living and entertaining. Set in a peaceful elevated location, you'll enjoy breathtaking desert and mountain views right from your doorstep. Purchase with Space 23 and both can be yours for just $80,000--an incredible opportunity you don't want to miss. Must see!
ⓘ Source: listings_history table (triggers on properties + properties_extension) + one-shot
backfill from property_details.listing_events for pre-trigger history.
Climate risk First Street
- Flood 1/10 Low FEMA zone X (unshaded) · 0% chance over 30 yrs
- Wildfire 4/10 Moderate
- Heat 7/10 Severe 7 d/yr ≥99°F today · 21 d/yr by 30 yrs out
- Wind 1/10 Low
- Air quality 6/10 Major 10 unhealthy d/yr today · 14 by 30 yrs out
Nearby sold comps map
Loading sold comps map…
Walkable amenities ~0.75 mi
Loading nearby amenities…
Taxation est. · year 1
- Rental income
- $17,779
- − Mortgage interest
- −$1,961
- − Property taxes
- −$525
- − Insurance
- −$175
- − Repairs & maintenance
- −$1,422
- − Management
- −$1,422
- − Depreciation
- −$1,018
- Taxable income
- $11,255
- Est. tax owed @ 24.0%
- −$2,701
- After-tax cash flow
- $8,441/yr
For passive investors: Depreciation is non-cash, so a rental often shows a tax loss while cash-flowing — sheltering income. Rental losses are passive: they offset passive income freely, and up to $25,000/yr can offset ordinary (W-2) income if you actively participate and your MAGI is under $100k (phasing out to $0 by $150k); unused losses carry forward. On sale, claimed depreciation is recaptured at up to 25%, and gains may owe capital-gains tax (a 1031 exchange can defer both). Figures are a year-1 estimate at your 24.0% rate — not tax advice; consult a CPA.
Condition & rehab AI · 12 photos
This move-in-ready manufactured home offers modern updates and desert charm, with good condition and minimal maintenance required.
Value-add opportunities
- Both Paint exterior walls — Enhances curb appeal and value
- Both Replace curtains — Freshens up the interior and adds value
Renovation cost estimate screening
Value-add ROI direction
- Both Paint exterior walls — Enhances curb appeal and value ↑
- Both Replace curtains — Freshens up the interior and adds value ↑
ⓘ Cost ranges are severity-bucket heuristics (US national rule-of-thumb). Get contractor quotes + a written scope before underwriting a rehab budget.
Schools (NCES district)
- District
- Morongo Unified
- NCES district ID
- 0625860
- Math proficiency
- 15% ▼ -12.00%
- Reading proficiency
- 38% ▼ -3.00%
- Median HH income
- $39,399
- Composite
- 22.19/100
- National rank
- #8156
- State rank
- #395 of 517 in CA
Livability — Joshua Tree
- Score
- 50/100
- State rank
- #1114
- US rank
- #25611
Category grades
Schools grade is shown separately in the Schools card above.
Census & demographics
- Census place
- Joshua Tree, CA
- County
- San Bernardino County · 2,030,291 people
- City population
- 7,538
- Metro
- Riverside-San Bernardino-Ontario, CA
- Population (ZIP)
- 7,538
- Household income
- $66,598
- Rent vs Own
- Severe rent burden
- 345.0
Population outlook (San Bernardino County) Hauer SSP2
- Today (2025)
- 2,300,329 people
- By 2030
- 2,378,907 · +3.4%
- By 2040
- 2,523,137 · +9.7%
- By 2050
- 2,642,388 · +14.9%
- By 2075
- 2,880,769 · +25.2%
- By 2100
- 2,909,436 · +26.5%
Race, ethnicity, and origin ACS 2023
- Neighborhood character
- Predominantly White (67%)
- Race & ethnicity
- White 67% Hispanic / Latino 22% Two or more races 16% Black 3% Native American 1% Asian 1%
- Hispanic origin (detail)
- Mexican 17%
- Common ancestry
- Italian 6% Lithuanian 3% Portuguese 3%
- Foreign-born
- 8% · Canada
- Languages at home
- 88% English-only · Spanish 9% Other Indo-European 1% German/W. Germanic 1%
Political lean MEDSL · San Bernardino
- 2024 margin
- Toss-up / Even · D 47.5% · R 49.7% · Other 2.8%
- 2008→2024 swing
- -8.5pp toward R · 2008: 6.3pp · 2024: -2.1pp
- All cycles
- 2024: R+2.1 2020: D+10.7 2016: D+9.8 2012: D+5.4 2008: D+6.3
Not yet ingested
- Civics
- —
Market trends
- HPI YoY
- ▼ -41.66%
- Current HPI
- 541.8347
- Rent YoY
- ▼ -1.09%
- Metro
- Riverside-San Bernardino-Ontario, CA
- State GDP YoY
- ▲ 3.21%
- F500 in state
- 116
Industry mix (Fortune 500 HQ in CA)
| Industry | F500 HQs | Revenue |
|---|---|---|
| Technology | 27 | $1,492B |
|
||
| Financial Services | 3 | $174B |
|
||
| Retail | 3 | $44B |
|
||
| Insurance | 3 | $26B |
|
||
| Media / Entertainment | 2 | $115B |
|
||
| Pharmaceuticals / Biotech | 2 | $62B |
|
||
Price history
1 event — show timeline
- 2026-03-19 Listed $43,000 GPSMLS
Cash-flow waterfall
monthlySold comps — $/sqft
last 12 mo · ≤1 miLoading sold comps…