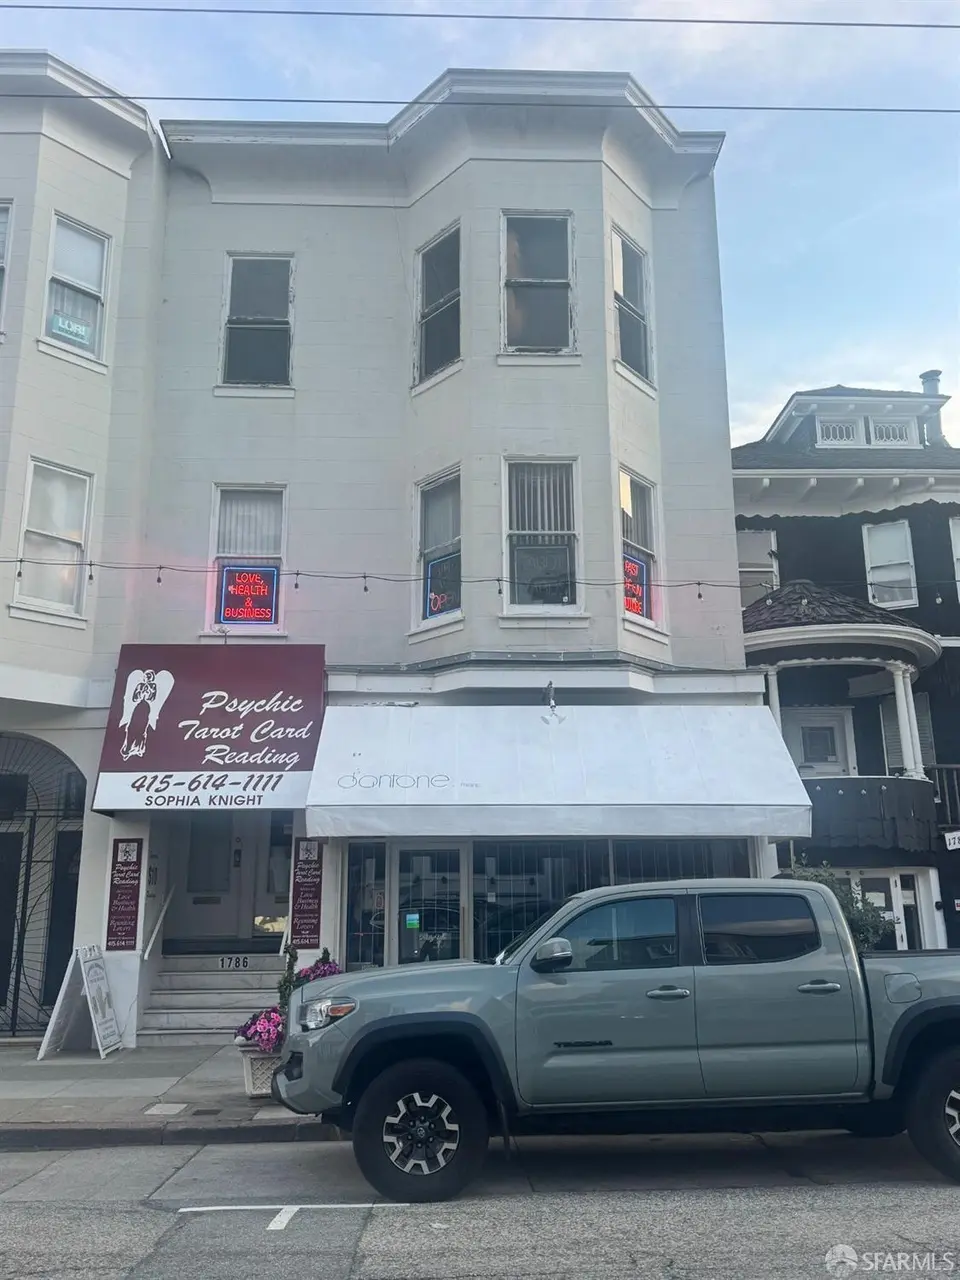
1784-1788 Union St · San Francisco, CA
Flood risk No data
- FEMA flood zone
- —
- Chance of flooding over 30 yrs
- —
- Est. flood insurance / yr
- —
Fire risk No data
- Est. fire insurance / yr
- —
Heat risk No data
- Hot days now (above threshold)
- —
- Hot days in 30 yrs
- —
Wind risk No data
- Chance of severe wind over 30 yrs
- —
Air-quality risk No data
- Unhealthy air days now
- —
- Unhealthy air days in 30 yrs
- —
Risk factors via First Street. Map © Google.
Why this score? — see what drove the D grade
The composite is a weighted blend of 9 inputs, each scored 0–100. Each bar is that input's sub-score; the figure is the points it added to the 100-point composite (weight × sub-score).
- ARV discount +14.9/15.0
- Appreciation +9.1/10.0
- Rent growth +5.0/5.0
- Schools +5.0/10.0
- Livability +3.8/5.0
- Condition / age +2.5/5.0
- Cash flow +0.0/30.0
- 1% rule +0.0/10.0
- DSCR +0.0/10.0
$2,595,000
🖨 Deal sheet 📄 Offer letter ✓ Due diligence
Listing remarks
Property subject to court confirmation. 3 unit building, top floor vacant unit, renovations needed, projected rental value $7500, middle unit, tenant occupied, current $3,875. protected tenant. Lower unit, commercial unit, $4,000, on month to month lease.
Key facts
- 2,125 sq ft lot
- Built 1902
- Listed 45 days
Property features AI
Finance
- Financial info: Triplex with three units total — two leased, one month-to-month, one vacant (projected rent $7,500 for the vacant unit); Includes a commercial unit on month-to-month tenancy
- HOA & community: No association fee
Exterior
- Home design: Residential income property (Mixed-use triplex); Three or more levels; Built in 1902
- Construction: Original condition — fixer; Assessor-reported building area 4,950 square feet
- Exterior features: Balcony / deck
Interior
- Flooring: Wood
- Interior features: Wood flooring
Neighborhood map
What this means for you Summary
Snapshot
- This is a other listed at $2.60M.
Deal economics
- At list price, monthly cash flow is $-15k ($-176k/yr) — negative.
- To cash-flow at today's rent, offer at most $467k (82.0% below list).
- To meet the 1% rule (rent ≥ 1% of price), the offer needs to be $408k (84.3% below list).
- Recommended offer: $408k (84.3% below list) — sets the bar for 1% rule.
- Cap rate -0.5% vs local median 2.1% in San Francisco — below-typical yield; the buyer is paying a premium for something (appreciation thesis, condition, location) that the cap rate doesn't capture.
Location & tenants
- Location reads 76/100 on livability (#90 in CA, #3,143 nationally) — a middle-class / working-renter tenant base. Strengths: amenities A+, commute A+, employment A+; Watch: crime F, cost of living F.
- San Francisco Unified (urban): math 50% / reading 56% proficiency, ranked #322 of 1,400 in CA (top 23%) — acceptable for families but not a draw, mixed tenant base, ~2y average lease.
- Market conditions: Rents rising fast (+19.2%/yr); 59 active listings in the ZIP; high-income renter base; 750 units permitted in San Francisco County in 2024 (688 in 5+ unit buildings).
Forward outlook
- In year one you build about $230k of equity ($18k loan paydown + $212k appreciation (8.2% local appreciation)).
- San Francisco County population projected at +39% by 2050 — long-run rental-demand tailwind backs the buy-and-hold thesis.
- By year 2, paydown + projected appreciation supports a ~$369k cash-out refi (75% LTV) — recoverable capital for the next deal without selling this one.
Negotiation context
- It's been on market 45 days — a 3% lower offer ($2.52M) is reasonable based on typical stale-listing flexibility.
- 2 sale attempts since 7y ago with the ask held roughly flat each time — persistent listings suggest the price (not the market) is what's stuck; bring a comps-based counter.
Risks & watch-outs
- Watch-outs: built in 1902 — expect roof / HVAC / electrical / plumbing capex.
Questions for the listing agent
- What do current leases actually rent for vs. the listed asking? Can we see a recent rent roll and the last 12 months of T-12 income?
- It's been on market 45 days. Have you received any prior offers? Is the seller open to a 84% concession, seller financing, or rate buy-down credit?
- Built in 1902 — when were the roof, HVAC, electrical panel, plumbing, and water heater last replaced?
- Is there a deadline driving the sale (1031 exchange, divorce, estate, relocation)? That informs how much negotiation room exists.
- Schools are B-rated — typically a magnet for longer-tenancy family renters. What's the average tenant stay here, and is there a school-zone premium baked into asking?
- Crime grade is F in this area — have there been break-ins, vandalism, or insurance claims at this property in the last 3 years? What carrier currently insures it and at what premium?
- The area grade is low — what's the realistic commute time and amenity access for the typical tenant pool here? Any planned neighborhood developments (good or bad) we should know about?
- What's the average days-on-market for RENTAL listings here right now (not sales)? A rising rental-DOM trend means longer vacancies and softer asking-rent achievability than the comps imply.
- What's the recent tenant-quality profile in this submarket — average credit score on applications, eviction rate, late-payment / NSF rate, and stable-employment percentage? A property-management company in the area should have these aggregated.
- How much new for-sale + rental construction is in the pipeline within 1–3 miles? Heavy new supply typically softens prices + rents 12–24 months out; constrained supply supports both.
Investment metrics
- 1% rule
- 0.16% ✗
- Cap rate
- -0.51%
- Cash-on-cash
- -24.29%
- DSCR
- -0.08
- GRM
- 53.0
CMA / ARV
- ARV (median comp)
- $3,109,274
- List price
- $2,595,000
- Delta
- -16.54%
- Verdict
- UNDERPRICED
- Comps
- 20 within 1.0 mi
Projected returns pro-forma
8.18% appreciation · 8.0% rent growth · sell at horizon
- IRR
- 3.2%
- Equity multiple
- 1.25×
- Total profit
- $183,326
- Equity at exit
- $2,002,762
- IRR
- 6.7%
- Equity multiple
- 2.77×
- Total profit
- $1,283,756
- Equity at exit
- $4,005,660
Cash invested: $726,600 (down + closing). Projections, not guarantees.
Landlord ↔ Tenant lean methodology
- Overall (CITY)
- 0 Strongly Tenant-Friendly
- State California
- 18 Strongly Tenant-Friendly · D+13
- County
- — inherits STATE
- City San Francisco
- 0 Strongly Tenant-Friendly · D+57
ZIP-level market 94123
- Home prices YoY
- 4.0%
- Rents YoY
- 19.2%
- Active inventory
- 59
- Price-to-rent
- 53.0×
Monthly cashflow live
- Estimated rent
- $4,084 medium interval (Pro) →
- Mortgage (P&I)
- −$13,608
- Tax est. 1.5%
- −$3,244 /mo · $38,925/yr
- Insurance
- −$1,081
- HOA
- −$0
- Vacancy / Maint / Mgmt
- −$858
- Net cashflow
- $-14,707
Break-even live
UW: 25.0% down · 7.5% · 30yr · 1.5% tax · 5.0% vac · 8.0% maint · 8.0% mgmt
Financing live
Cash to close
- Down payment
- $648,750
- Closing costs
- $77,850
- Reserves months
- —
- Total cash needed
- —
Loan-product check · same deal, 3 products live
Conventional
25% down · 7.5% · 30yr
- Down + closing
- —
- Monthly P&I
- —
- Monthly cashflow
- —
- DSCR
- —
- Eligible?
- —
Personal DTI + credit; lowest rate.
DSCR
20% down · 8.5% · 30yr
- Down + closing
- —
- Monthly P&I
- —
- Monthly cashflow
- —
- DSCR
- —
- Eligible?
- —
No personal income docs; deal must DSCR.
Hard money
10% down · 12.0% · 12mo
- Down + closing
- —
- Monthly P&I
- —
- Monthly cashflow
- —
- DSCR
- —
- Eligible?
- —
Short-term bridge; refi at stabilization.
Listing history 18 events
-
2026-06-18days on market $2,595,000 Active 45 DOM
-
2026-06-17days on market $2,595,000 Active 44 DOM
-
2026-06-16days on market $2,595,000 Active 43 DOM
-
2026-06-15days on market $2,595,000 Active 42 DOM
-
2026-06-13days on market $2,595,000 Active 40 DOM
-
2026-06-13days on market $2,595,000 Active 39 DOM
-
2026-06-09days on market $2,595,000 Active 36 DOM
-
2026-06-08days on market $2,595,000 Active 35 DOM
-
2026-06-07days on market $2,595,000 Active 34 DOM
-
2026-06-04days on market $2,595,000 Active 31 DOM
-
2026-06-03days on market $2,595,000 Active 30 DOM
-
2026-06-02days on market $2,595,000 Active 29 DOM
-
2026-06-01days on market $2,595,000 Active 28 DOM
-
2026-05-31days on market $2,595,000 Active 27 DOM
-
2026-05-04$2,595,000 Active 255-char remark
-
2019-08-28historical Canceled
-
2019-08-02price $2,649,000
-
2019-06-27$2,750,000 Active
ⓘ Source: listings_history table (triggers on properties + properties_extension) + one-shot
backfill from property_details.listing_events for pre-trigger history.
Nearby sold comps map
Loading sold comps map…
Walkable amenities ~0.75 mi
Loading nearby amenities…
Taxation est. · year 1
- Rental income
- $49,008
- − Mortgage interest
- −$145,360
- − Property taxes
- −$38,925
- − Insurance
- −$12,975
- − Repairs & maintenance
- −$3,921
- − Management
- −$3,921
- − Depreciation
- −$75,491
- Taxable loss
- −$231,585
- Est. tax savings @ 24.0%
- +$55,580
- After-tax cash flow
- $-120,905/yr
For passive investors: Depreciation is non-cash, so a rental often shows a tax loss while cash-flowing — sheltering income. Rental losses are passive: they offset passive income freely, and up to $25,000/yr can offset ordinary (W-2) income if you actively participate and your MAGI is under $100k (phasing out to $0 by $150k); unused losses carry forward. On sale, claimed depreciation is recaptured at up to 25%, and gains may owe capital-gains tax (a 1031 exchange can defer both). Figures are a year-1 estimate at your 24.0% rate — not tax advice; consult a CPA.
Schools (NCES district)
- District
- San Francisco Unified
- NCES district ID
- 0634410
- Math proficiency
- 50% ▬ 0.00%
- Reading proficiency
- 56% ▲ 1.00%
- Median HH income
- $81,249
- Composite
- 50.14/100
- National rank
- #4088
- State rank
- #322 of 1400 in CA
Livability — San Francisco
- Score
- 76/100
- State rank
- #90
- US rank
- #3143
Category grades
Schools grade is shown separately in the Schools card above.
Census & demographics
- Census place
- San Francisco, CA
- County
- San Francisco County · 827,552 people
- City population
- 827,552
- Metro
- San Francisco-Oakland-Berkeley, CA
- Population (ZIP)
- 24,054
- Household income
- $218,603
- Rent vs Own
- Severe rent burden
- 883.0
Population outlook (San Francisco County) Hauer SSP2
- Today (2025)
- 1,030,936 people
- By 2030
- 1,110,409 · +7.7%
- By 2040
- 1,270,010 · +23.2%
- By 2050
- 1,435,001 · +39.2%
- By 2075
- 1,779,074 · +72.6%
- By 2100
- 1,966,767 · +90.8%
Race, ethnicity, and origin ACS 2023
- Neighborhood character
- Predominantly White (73%)
- Race & ethnicity
- White 73% Asian 11% Two or more races 11% Hispanic / Latino 9%
- Hispanic origin (detail)
- Mexican 3% Salvadoran 1%
- Common ancestry
- Scotch-Irish 4% Italian 4% Lithuanian 3%
- Foreign-born
- 17% · Canada, China, Dominican Republic
- Languages at home
- 83% English-only · Spanish 5% Other Indo-European 3% Chinese 3%
Political lean MEDSL · San Francisco
- 2024 margin
- Solid D (+64.8) · D 80.3% · R 15.5% · Other 4.1%
- 2008→2024 swing
- -5.7pp toward R · 2008: 70.5pp · 2024: 64.8pp
- All cycles
- 2024: D+64.8 2020: D+72.5 2016: D+76.1 2012: D+70.2 2008: D+70.5
Not yet ingested
- Civics
- —
Market trends
- HPI YoY
- ▲ 8.18%
- Current HPI
- 212.9289
- Rent YoY
- ▲ 19.17%
- Metro
- San Francisco-Oakland-Berkeley, CA
- State GDP YoY
- ▲ 3.21%
- F500 in state
- 116
Industry mix (Fortune 500 HQ in CA)
| Industry | F500 HQs | Revenue |
|---|---|---|
| Technology | 27 | $1,492B |
|
||
| Financial Services | 3 | $174B |
|
||
| Retail | 3 | $44B |
|
||
| Insurance | 3 | $26B |
|
||
| Media / Entertainment | 2 | $115B |
|
||
| Pharmaceuticals / Biotech | 2 | $62B |
|
||
Price history
-5.6% since first listed4 events — show timeline
- 2026-05-04 Listed $2,595,000 San Francisco MLS
- 2019-08-28 Delisted — San Francisco MLS
- 2019-08-02 Price Changed $2,649,000 San Francisco MLS
- 2019-06-27 Listed $2,750,000 San Francisco MLS
Cash-flow waterfall
monthlySold comps — $/sqft
last 12 mo · ≤1 miLoading sold comps…