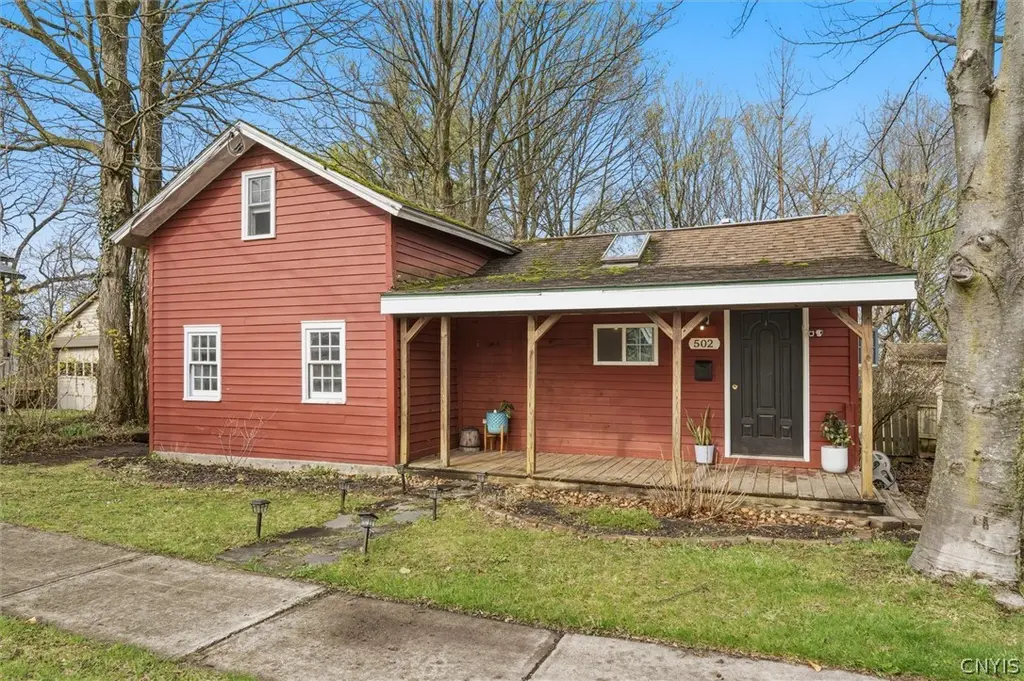
502 Warren St · Fayetteville, NY
Flood risk 1/10 · Minimal
- FEMA flood zone
- X (unshaded)
- Chance of flooding over 30 yrs
- 0.0%
- Est. flood insurance / yr
- $473 – $860
Fire risk 1/10 · Minimal
- Est. fire insurance / yr
- $691 – $1,283
Heat risk 3/10 · Minor
- Hot days now (above 94°F)
- 7 days/yr
- Hot days in 30 yrs
- 16 days/yr
Wind risk 1/10 · Minimal
- Chance of severe wind over 30 yrs
- 0.0%
Air-quality risk 2/10 · Minimal
- Unhealthy air days now
- 0 days/yr
- Unhealthy air days in 30 yrs
- 1 days/yr
Risk factors via First Street. Map © Google.
Why this score? — see what drove the B- grade
The composite is a weighted blend of 9 inputs, each scored 0–100. Each bar is that input's sub-score; the figure is the points it added to the 100-point composite (weight × sub-score).
- Cash flow +25.1/30.0
- ARV discount +10.7/15.0
- DSCR +8.2/10.0
- 1% rule +7.9/10.0
- Schools +7.1/10.0
- Livability +4.1/5.0
- Rent growth +2.5/5.0
- Condition / age +2.5/5.0
- Appreciation +0.0/10.0
$149,900
🖨 Deal sheet 📄 Offer letter ✓ Due diligence
Listing remarks
Welcome to this charming and unique home nestled in the heart of the Village of Fayetteville, located within the highly sought-after Fayetteville-Manlius School District. Offering 985 square feet of living space, this 1-bedroom, 1-bath residence w/ 2nd floor loft, blends character, functionality, and opportunity. Inside, you’ll find a versatile layout with a cozy loft area—perfect for additional living space or a creative retreat—as well as a dedicated small office ideal for remote work or hobbies. The convenience of first-floor laundry adds to the home’s practicality. Step outside to enjoy the inviting covered front porch, a perfect spot to relax and take in the nei
Key facts
- Covered front porch
- Cozy loft area
- First-floor laundry
Tags
Neighborhood map
What this means for you Summary
Snapshot
- This is a 1-bed/1.0-bath single-family listed at $150k.
Deal economics
- At list price, monthly cash flow is $331 ($4k/yr) — positive.
- The deal already cash-flows at list — no discount required.
- Meets the 1% rule at list price ($2k rent vs $150k).
- Recommended offer: $148k (1.5% below list) — sets the bar for market timing.
- Cap rate 8.9% vs local median 3.1% in Fayetteville — top-decile yield for the area; either an underpriced asset or a hidden risk that comps aren't pricing in. Stress-test before assuming the spread holds.
Location & tenants
- Location reads 82/100 on livability (#71 in NY, #1,067 nationally) — a professional / high-income tenant draw. Strengths: schools A+, employment A+, housing A+; Watch: amenities D, commute F.
- Fayetteville-Manlius Central School District (suburban): math 79% / reading 81% proficiency, ranked #49 of 590 in NY (top 8%) — strong family-tenant draw, lease renewals of 3-5y typical; only 7% free/reduced lunch — higher-income household profile.
- Market conditions: 65 active listings in the ZIP; 616 units permitted in Onondaga County in 2024 (256 in 5+ unit buildings).
Forward outlook
- Local home prices are declining (-3.0%/yr); year-one equity from $1k of loan paydown is wiped out by about $4k of value loss. Plan a longer hold.
- Onondaga County population projected to shrink 9% by 2050 — rents likely to lag national; underwrite the cash flow, not the appreciation.
Negotiation context
- It's been on market 16 days — a 2% lower offer ($148k) is reasonable based on typical stale-listing flexibility.
- Current owner paid $90k; list at $150k implies a 67% gain — meaningful room to come down on a strong offer.
Risks & watch-outs
- Watch-outs: property tax is 2.8% of price; built in 1840 — expect roof / HVAC / electrical / plumbing capex.
Questions for the listing agent
- Built in 1840 — when were the roof, HVAC, electrical panel, plumbing, and water heater last replaced?
- Property tax is high relative to price — has the assessment been appealed recently, and will the sale trigger a re-assessment?
- Is there a deadline driving the sale (1031 exchange, divorce, estate, relocation)? That informs how much negotiation room exists.
- Schools are A-rated — typically a magnet for longer-tenancy family renters. What's the average tenant stay here, and is there a school-zone premium baked into asking?
- What's the average days-on-market for RENTAL listings here right now (not sales)? A rising rental-DOM trend means longer vacancies and softer asking-rent achievability than the comps imply.
- What's the recent tenant-quality profile in this submarket — average credit score on applications, eviction rate, late-payment / NSF rate, and stable-employment percentage? A property-management company in the area should have these aggregated.
- How much new for-sale + rental construction is in the pipeline within 1–3 miles? Heavy new supply typically softens prices + rents 12–24 months out; constrained supply supports both.
Investment metrics
- 1% rule
- 1.29% ✓
- Cap rate
- 8.94%
- Cash-on-cash
- 9.47%
- DSCR
- 1.42
- GRM
- 6.4
CMA / ARV
- ARV (on-the-fly)
- $161,540
- Comps found
- 6
Show comp detail 6 sales within ~0.75 mi
| Address | Dist | Beds/Ba | Sqft | Sold | Price | $/sf | Match |
|---|---|---|---|---|---|---|---|
| 502 Warren St | 0.00mi | 1/1.0 | 985 (0%) | 0mo | $150,000 | $152 | 100 |
| 105 Beach St | 0.20mi | 2/1.5 (+1) | 1,032 (+5%) | 11mo | $247,500 | $240 | 67 |
| 110 Warner Rd | 0.46mi | 2/1.0 (+1) | 1,009 (+2%) | 14mo | $165,000 | $164 | 57 |
| 152 N Burdick St | 0.67mi | 2/1.0 (+1) | 1,110 (+13%) | 0mo | $90,000 | $81 | 42 |
| 210 S Burdick St | 0.39mi | 2/1.5 (+1) | 1,076 (+9%) | 20mo | $222,000 | $206 | 42 |
| 148 N Burdick St | 0.65mi | 2/1.0 (+1) | 1,064 (+8%) | 24mo | $170,000 | $160 | 31 |
Match score weights: distance 35% · size 25% · config 20% · recency 20%. Top-matched comps best support the ARV.
Projected returns pro-forma
-3.0% appreciation · 3.0% rent growth · sell at horizon
- IRR
- -1.9%
- Equity multiple
- 0.93×
- Total profit
- $-3,072
- Equity at exit
- $22,351
- IRR
- 7.8%
- Equity multiple
- 1.60×
- Total profit
- $25,010
- Equity at exit
- $12,961
Cash invested: $41,972 (down + closing). Projections, not guarantees.
Landlord ↔ Tenant lean methodology
- Overall (STATE)
- 15 Strongly Tenant-Friendly
- State New York
- 15 Strongly Tenant-Friendly · D+10
- County
- — inherits STATE
- City
- — inherits STATE
ZIP-level market 13066
- Home prices YoY
- -28.0%
- Active inventory
- 65
- Price-to-rent
- 6.4×
Monthly cashflow live
- Estimated rent
- $1,940 medium interval (Pro) →
- Mortgage (P&I)
- −$786
- Tax from tax record
- −$353 /mo · $4,233/yr
- Insurance
- −$62
- HOA
- −$0
- Vacancy / Maint / Mgmt
- −$407
- Net cashflow
- $331
Break-even live
UW: 25.0% down · 7.5% · 30yr · 1.5% tax · 5.0% vac · 8.0% maint · 8.0% mgmt
Financing live
Cash to close
- Down payment
- $37,475
- Closing costs
- $4,497
- Reserves months
- —
- Total cash needed
- —
Loan-product check · same deal, 3 products live
Conventional
25% down · 7.5% · 30yr
- Down + closing
- —
- Monthly P&I
- —
- Monthly cashflow
- —
- DSCR
- —
- Eligible?
- —
Personal DTI + credit; lowest rate.
DSCR
20% down · 8.5% · 30yr
- Down + closing
- —
- Monthly P&I
- —
- Monthly cashflow
- —
- DSCR
- —
- Eligible?
- —
No personal income docs; deal must DSCR.
Hard money
10% down · 12.0% · 12mo
- Down + closing
- —
- Monthly P&I
- —
- Monthly cashflow
- —
- DSCR
- —
- Eligible?
- —
Short-term bridge; refi at stabilization.
Listing history 5 events
-
2026-05-06status Pending
-
2026-04-27historical Active Under Contract
-
2026-04-20$149,900 Active
-
2012-06-20soldstatus $90,000
-
1996-04-11soldstatus $27,000
ⓘ Source: listings_history table (triggers on properties + properties_extension) + one-shot
backfill from property_details.listing_events for pre-trigger history.
Tax reassessment forecast NY · Partial reset (capped growth)
- Current annual tax
- $4,233 · $353/mo
- Projected year-2 tax
- $4,233 · $353/mo
- Expected delta
- $0/yr ($0/mo · 0.0%)
ⓘ Screening estimate from a state-policy table — verify with the county assessor before closing.
Climate risk First Street
- Flood 1/10 Low FEMA zone X (unshaded) · 0% chance over 30 yrs
- Wildfire 1/10 Low
- Heat 3/10 Moderate 7 d/yr ≥94°F today · 16 d/yr by 30 yrs out
- Wind 1/10 Low 0% chance of damaging wind over 30 yrs
- Air quality 2/10 Low 0 unhealthy d/yr today · 1 by 30 yrs out
Nearby sold comps map
Loading sold comps map…
Walkable amenities ~0.75 mi
Loading nearby amenities…
Taxation est. · year 1
- Rental income
- $23,276
- − Mortgage interest
- −$8,397
- − Property taxes
- −$4,233
- − Insurance
- −$750
- − Repairs & maintenance
- −$1,862
- − Management
- −$1,862
- − Depreciation
- −$4,361
- Taxable income
- $1,813
- Est. tax owed @ 24.0%
- −$435
- After-tax cash flow
- $3,538/yr
For passive investors: Depreciation is non-cash, so a rental often shows a tax loss while cash-flowing — sheltering income. Rental losses are passive: they offset passive income freely, and up to $25,000/yr can offset ordinary (W-2) income if you actively participate and your MAGI is under $100k (phasing out to $0 by $150k); unused losses carry forward. On sale, claimed depreciation is recaptured at up to 25%, and gains may owe capital-gains tax (a 1031 exchange can defer both). Figures are a year-1 estimate at your 24.0% rate — not tax advice; consult a CPA.
Schools (NCES district)
- District
- Fayetteville-Manlius Central School District
- NCES district ID
- 3618330
- Math proficiency
- 79% ▼ -5.00%
- Reading proficiency
- 81% ▲ 7.00%
- Median HH income
- $86,156
- Composite
- 71.12/100
- National rank
- #238
- State rank
- #49 of 590 in NY
Livability — Fayetteville
- Score
- 82/100
- State rank
- #71
- US rank
- #1067
Category grades
Schools grade is shown separately in the Schools card above.
Census & demographics
- Census place
- Fayetteville, NY
- City population
- 12,680
- Population (ZIP)
- 12,680
Population outlook (Onondaga County) Hauer SSP2
- Today (2025)
- 467,894 people
- By 2030
- 463,381 · -1.0%
- By 2040
- 447,697 · -4.3%
- By 2050
- 426,399 · -8.9%
- By 2075
- 373,661 · -20.1%
- By 2100
- 307,967 · -34.2%
Race, ethnicity, and origin ACS 2023
- Neighborhood character
- Predominantly White (88%)
- Race & ethnicity
- White 88% Two or more races 4% Hispanic / Latino 3% Asian 3% Black 2%
- Common ancestry
- Romanian 5% Scotch-Irish 3% Lithuanian 3%
- Foreign-born
- 7% · Canada, China
- Languages at home
- 92% English-only · Other Indo-European 2% Chinese 2% Spanish 1%
Political lean MEDSL · Onondaga
- 2024 margin
- D (+17.3) · D 58.6% · R 41.4%
- 2008→2024 swing
- -3.0pp toward R · 2008: 20.3pp · 2024: 17.3pp
- All cycles
- 2024: D+17.3 2020: D+20.6 2016: D+12.8 2012: D+21.1 2008: D+20.3
Not yet ingested
- Civics
- —
Market trends
- HPI YoY
- ▼ -124.65%
- Current HPI
- 319.9702
- Rent YoY
- —
- Metro
- —
- State GDP YoY
- ▲ 2.60%
- F500 in state
- 92
Industry mix (Fortune 500 HQ in NY)
| Industry | F500 HQs | Revenue |
|---|---|---|
| Financial Services | 10 | $950B |
|
||
| Consumer Goods | 9 | $162B |
|
||
| Insurance | 4 | $225B |
|
||
| Telecommunications | 2 | $144B |
|
||
| Pharmaceuticals | 2 | $112B |
|
||
| Media / Entertainment | 2 | $69B |
|
||
Price history
+455.2% since first listed5 events — show timeline
- 2026-05-06 Pending — CNYIS
- 2026-04-27 Contingent — CNYIS
- 2026-04-20 Listed $149,900 CNYIS
- 2012-06-20 Sold (Public Records) $90,000 Public Records
- 1996-04-11 Sold (Public Records) $27,000 Public Records
Property tax history
+6.4%/yrLatest (2025): $4,233 · +5.2% YoY. Source: county tax records.
Cash-flow waterfall
monthlySold comps — $/sqft
last 12 mo · ≤1 miLoading sold comps…