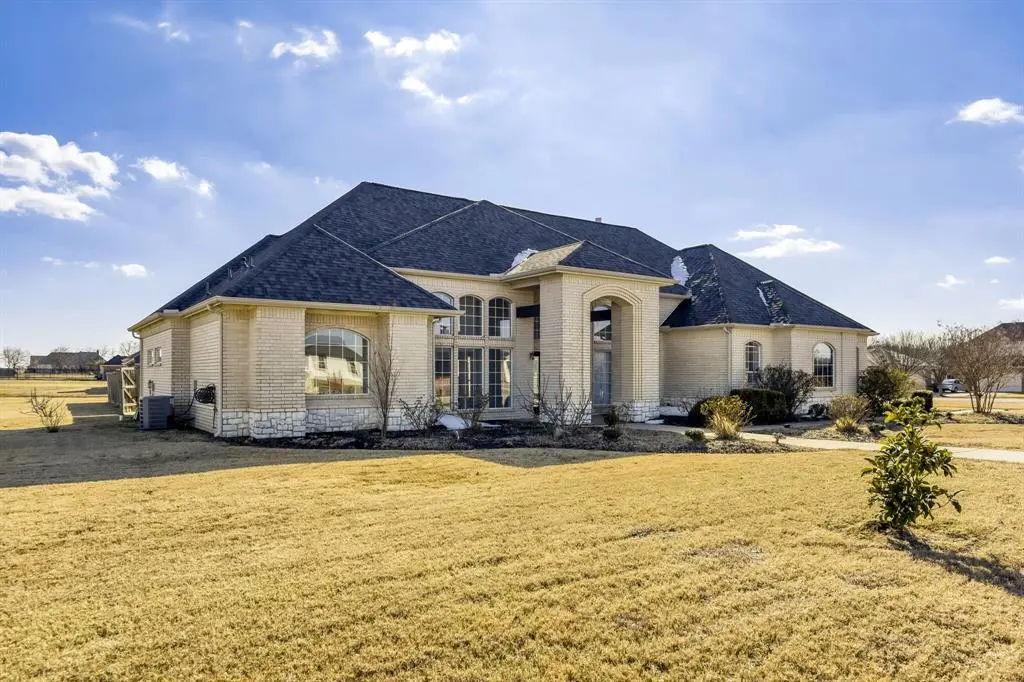
153 Whispering Winds Dr · Gunter, TX
Flood risk 1/10 · Minimal
- FEMA flood zone
- X (unshaded)
- Chance of flooding over 30 yrs
- 0.0%
- Est. flood insurance / yr
- $507 – $1,088
Fire risk 4/10 · Minor
- Est. fire insurance / yr
- $1,222 – $2,270
Heat risk 7/10 · Major
- Hot days now (above 110°F)
- 7 days/yr
- Hot days in 30 yrs
- 22 days/yr
Wind risk 6/10 · Moderate
- Chance of severe wind over 30 yrs
- 27.0%
Air-quality risk 3/10 · Minor
- Unhealthy air days now
- 3 days/yr
- Unhealthy air days in 30 yrs
- 3 days/yr
Risk factors via First Street. Map © Google.
Why this score? — see what drove the A grade
The composite is a weighted blend of 9 inputs, each scored 0–100. Each bar is that input's sub-score; the figure is the points it added to the 100-point composite (weight × sub-score).
- Cash flow +30.0/30.0
- ARV discount +15.0/15.0
- 1% rule +10.0/10.0
- DSCR +10.0/10.0
- Appreciation +10.0/10.0
- Schools +4.8/10.0
- Livability +3.6/5.0
- Rent growth +2.5/5.0
- Condition / age +2.5/5.0
$425,000
🖨 Deal sheet 📄 Offer letter ✓ Due diligence
Listing remarks MLS
Seller will assist with closing costs or rate buy down through a preferred lender. This charming home in Gunter, TX, offers a perfect blend of comfort and style with 3 bedrooms, 3 full baths, and 1 half bath. The open floor plan creates a welcoming atmosphere, featuring a spacious kitchen with ample storage, a dining room, and a second living area ideal for entertaining or relaxation. A dedicated office space provides versatility for work or study. The large primary bedroom is a true retreat, complete with a cozy fireplace, adding warmth and elegance to this beautiful home. With plenty of room for both relaxation and productivity, this home is an ideal choice for modern living.
Key facts
- 1 acre lot
- 2 garage spots
- Built 2002
Neighborhood map
What this means for you Summary
Snapshot
- This is a 3-bed/3.5-bath single-family listed at $425k.
Deal economics
- At list price, monthly cash flow is $2k ($24k/yr) — positive.
- The deal already cash-flows at list — no discount required.
- Meets the 1% rule at list price ($7k rent vs $425k).
- Recommended offer: $374k (12.0% below list) — sets the bar for market timing.
- Cap rate 11.9% vs local median 1.9% in Gunter — top-decile yield for the area; either an underpriced asset or a hidden risk that comps aren't pricing in. Stress-test before assuming the spread holds.
Location & tenants
- Location reads 72/100 on livability (#236 in TX) — a middle-class / working-renter tenant base. Strengths: crime A+, employment A+, housing A+; Watch: amenities F, commute F, health & safety F.
- Gunter ISD (rural): math 47% / reading 58% proficiency, ranked #103 of 826 in TX (top 12%) — acceptable for families but not a draw, mixed tenant base, ~2y average lease.
- Market conditions: 201 active listings in the ZIP; 1 comparable units currently listed for rent nearby; 2,272 units permitted in Grayson County in 2024 (750 in 5+ unit buildings).
Forward outlook
- In year one you build about $45k of equity ($3k loan paydown + $42k appreciation (10.0% local appreciation)).
- Grayson County population projected at +12% by 2050 — modest demand growth; plan on rents tracking national, not racing it.
- At projected returns (10.0% appreciation + 3.0% rent growth), your $119k cash investment doubles in ~2 years — after that, you're playing with house money.
- By year 2, paydown + projected appreciation supports a ~$73k cash-out refi (75% LTV) — recoverable capital for the next deal without selling this one.
Negotiation context
- It's been on market 122 days — a 12% lower offer ($374k) is reasonable based on typical stale-listing flexibility.
- 11 sale attempts since 22y ago; this cycle's ask has dropped $50k (11%) from the opening price — seller is motivated, your offer sets the floor, not the list.
Risks & watch-outs
- Watch-outs: property tax is 2.6% of price.
- Climate carrying-cost: major wind risk, 27% chance of damaging wind over 30y; extreme-heat days projected 7→22/yr by 2055 (HVAC capex compounding) — expect insurance premiums to compound above CPI over the hold.
Questions for the listing agent
- It's been on market 122 days. Have you received any prior offers? Is the seller open to a 12% concession, seller financing, or rate buy-down credit?
- Property tax is high relative to price — has the assessment been appealed recently, and will the sale trigger a re-assessment?
- What does the HOA fee cover, when was the last increase, and are there any pending special assessments or reserve-fund shortfalls?
- Why hasn't it sold? Are there any deal-killer items the seller is aware of (foundation, flood, title, zoning, code violations)?
- Is there a deadline driving the sale (1031 exchange, divorce, estate, relocation)? That informs how much negotiation room exists.
- What's the average days-on-market for RENTAL listings here right now (not sales)? A rising rental-DOM trend means longer vacancies and softer asking-rent achievability than the comps imply.
- What's the recent tenant-quality profile in this submarket — average credit score on applications, eviction rate, late-payment / NSF rate, and stable-employment percentage? A property-management company in the area should have these aggregated.
- How much new for-sale + rental construction is in the pipeline within 1–3 miles? Heavy new supply typically softens prices + rents 12–24 months out; constrained supply supports both.
Investment metrics
- 1% rule
- 1.60% ✓
- Cap rate
- 11.95%
- Cash-on-cash
- 20.20%
- DSCR
- 1.90
- GRM
- 5.2
CMA / ARV
- ARV (median comp)
- $716,181
- List price
- $425,000
- Delta
- -40.66%
- Verdict
- UNDERPRICED
- Comps
- 20 within 1.0 mi
Show comp detail 10 sales within ~0.75 mi
| Address | Dist | Beds/Ba | Sqft | Sold | Price | $/sf | Match |
|---|---|---|---|---|---|---|---|
| 154 Whispering Winds Dr | 0.05mi | 4/2.0 (+1) | 2,559 (+2%) | 0mo | $395,000 | $154 | 83 |
| 115 Beavers Bend Dr | 0.08mi | 4/3.0 (+1) | 2,420 (-3%) | 18mo | $535,000 | $221 | 69 |
| 300 Waterview Dr | 0.19mi | 4/3.0 (+1) | 2,784 (+11%) | 1mo | $700,000 | $251 | 64 |
| 145 Knoll Trl | 0.50mi | 3/2.5 | 2,623 (+5%) | 3mo | $674,999 | $257 | 62 |
| 150 Whispering Winds Dr | 0.11mi | 4/3.0 (+1) | 2,635 (+5%) | 21mo | $602,500 | $229 | 61 |
| 330 Waterview Dr | 0.50mi | 3/2.0 | 2,406 (-4%) | 23mo | $699,999 | $291 | 45 |
| 686 Cypress Point Dr | 0.69mi | 3/2.5 | 2,767 (+11%) | 1mo | $729,000 | $263 | 45 |
| 105 Meadow Ln | 0.36mi | 4/2.5 (+1) | 2,798 (+12%) | 12mo | $727,888 | $260 | 44 |
| 160 Waterview Dr | 0.50mi | 4/2.5 (+1) | 2,862 (+14%) | 2mo | $684,999 | $239 | 42 |
| 1389 Mcconnell Rd | 0.67mi | 3/3.0 | 2,243 (-10%) | 16mo | $1,150,000 | $513 | 36 |
Match score weights: distance 35% · size 25% · config 20% · recency 20%. Top-matched comps best support the ARV.
Projected returns pro-forma
10.0% appreciation · 3.0% rent growth · sell at horizon
- IRR
- 39.4%
- Equity multiple
- 4.02×
- Total profit
- $359,411
- Equity at exit
- $382,874
- IRR
- 34.0%
- Equity multiple
- 9.06×
- Total profit
- $958,813
- Equity at exit
- $825,682
Cash invested: $119,000 (down + closing). Projections, not guarantees.
Landlord ↔ Tenant lean methodology
- Overall (STATE)
- 87 Strongly Landlord-Friendly
- State Texas
- 87 Strongly Landlord-Friendly · R+5
- County
- — inherits STATE
- City
- — inherits STATE
ZIP-level market 75058
- Home prices YoY
- 6.4%
- Active inventory
- 201
- Price-to-rent
- 5.2×
Monthly cashflow live
- Estimated rent
- $6,800 medium interval (Pro) →
- Mortgage (P&I)
- −$2,229
- Tax from tax record
- −$934 /mo · $11,209/yr
- Insurance
- −$177
- HOA
- −$29
- Vacancy / Maint / Mgmt
- −$1,428
- Net cashflow
- $2,003
Break-even live
UW: 25.0% down · 7.5% · 30yr · 1.5% tax · 5.0% vac · 8.0% maint · 8.0% mgmt
Financing live
Cash to close
- Down payment
- $106,250
- Closing costs
- $12,750
- Reserves months
- —
- Total cash needed
- —
Loan-product check · same deal, 3 products live
Conventional
25% down · 7.5% · 30yr
- Down + closing
- —
- Monthly P&I
- —
- Monthly cashflow
- —
- DSCR
- —
- Eligible?
- —
Personal DTI + credit; lowest rate.
DSCR
20% down · 8.5% · 30yr
- Down + closing
- —
- Monthly P&I
- —
- Monthly cashflow
- —
- DSCR
- —
- Eligible?
- —
No personal income docs; deal must DSCR.
Hard money
10% down · 12.0% · 12mo
- Down + closing
- —
- Monthly P&I
- —
- Monthly cashflow
- —
- DSCR
- —
- Eligible?
- —
Short-term bridge; refi at stabilization.
Rent comps 1 comps
| Address | Beds | Baths | Sqft | Rent | $/sqft | DOM | Units | Dist |
|---|---|---|---|---|---|---|---|---|
| 300 Waterview Dr Gunter, TX | 4.0 | 3.0 | 2784 | $6,800 | $2.44 | 15d | 1 | 0.16mi |
HOA detail
- Monthly dues
- $29 · $348/yr
Listing history 50 events
-
2026-06-18days on market $425,000 Active 122 DOM
-
2026-06-17days on market $425,000 Active 121 DOM
-
2026-06-16days on market $425,000 Active 120 DOM
-
2026-06-15days on market $425,000 Active 119 DOM
-
2026-06-13days on market $425,000 Active 117 DOM
-
2026-06-09days on market $425,000 Active 113 DOM
-
2026-06-08days on market $425,000 Active 112 DOM
-
2026-06-07days on market $425,000 Active 111 DOM
-
2026-06-04days on market $425,000 Active 108 DOM
-
2026-06-03days on market $425,000 Active 107 DOM
-
2026-06-02days on market $425,000 Active 106 DOM
-
2026-06-02remarks 699-char remark
-
2026-06-01days on market $425,000 Active 105 DOM
-
2026-05-31days on market $425,000 Active 104 DOM
-
2026-04-20price $440,000 686-char remark
Show marketing remark (686 chars)
Seller will assist with closing costs or rate buy down through a preferred lender. This charming home in Gunter, TX, offers a perfect blend of comfort and style with 3 bedrooms, 3 full baths, and 1 half bath. The open floor plan creates a welcoming atmosphere, featuring a spacious kitchen with ample storage, a dining room, and a second living area ideal for entertaining or relaxation. A dedicated office space provides versatility for work or study. The large primary bedroom is a true retreat, complete with a cozy fireplace, adding warmth and elegance to this beautiful home. With plenty of room for both relaxation and productivity, this home is an ideal choice for modern living.
-
2026-04-02price $450,000 686-char remark
Show marketing remark (686 chars)
Seller will assist with closing costs or rate buy down through a preferred lender. This charming home in Gunter, TX, offers a perfect blend of comfort and style with 3 bedrooms, 3 full baths, and 1 half bath. The open floor plan creates a welcoming atmosphere, featuring a spacious kitchen with ample storage, a dining room, and a second living area ideal for entertaining or relaxation. A dedicated office space provides versatility for work or study. The large primary bedroom is a true retreat, complete with a cozy fireplace, adding warmth and elegance to this beautiful home. With plenty of room for both relaxation and productivity, this home is an ideal choice for modern living.
-
2026-03-03price $465,000 686-char remark
Show marketing remark (686 chars)
Seller will assist with closing costs or rate buy down through a preferred lender. This charming home in Gunter, TX, offers a perfect blend of comfort and style with 3 bedrooms, 3 full baths, and 1 half bath. The open floor plan creates a welcoming atmosphere, featuring a spacious kitchen with ample storage, a dining room, and a second living area ideal for entertaining or relaxation. A dedicated office space provides versatility for work or study. The large primary bedroom is a true retreat, complete with a cozy fireplace, adding warmth and elegance to this beautiful home. With plenty of room for both relaxation and productivity, this home is an ideal choice for modern living.
-
2026-02-16$475,000 Active 686-char remark
Show marketing remark (686 chars)
Seller will assist with closing costs or rate buy down through a preferred lender. This charming home in Gunter, TX, offers a perfect blend of comfort and style with 3 bedrooms, 3 full baths, and 1 half bath. The open floor plan creates a welcoming atmosphere, featuring a spacious kitchen with ample storage, a dining room, and a second living area ideal for entertaining or relaxation. A dedicated office space provides versatility for work or study. The large primary bedroom is a true retreat, complete with a cozy fireplace, adding warmth and elegance to this beautiful home. With plenty of room for both relaxation and productivity, this home is an ideal choice for modern living.
-
2025-10-06price $430,000
-
2025-09-16price $440,000
-
2025-08-31price $450,000
-
2025-07-28price $460,000
-
2025-07-08price $470,000
-
2025-06-19price $480,000
-
2025-05-30price $490,000
-
2025-05-09status Active
-
2025-05-09price $500,000
-
2025-04-28historical
-
2025-03-28$515,000
-
2025-03-20soldstatus
-
2013-07-08soldstatus
-
2013-07-03soldstatus Closed
-
2013-06-13status Pending
-
2013-05-31historical Active Option Contract
-
2013-05-09$210,000 Active
-
2012-07-17historical
-
2012-06-06status Pending
-
2012-04-05price $204,900
-
2012-01-19$207,900 Active
-
2011-06-08historical
-
2011-05-10price $198,000
-
2011-04-15status Active
-
2011-03-07historical Active Kick-Out
-
2011-02-23$200,000 Active
-
2011-01-31historical
-
2011-01-20price $200,000
-
2010-11-04status Active
-
2010-10-31historical
-
2010-10-26price $210,000
-
2010-04-12$219,000 Active
ⓘ Source: listings_history table (triggers on properties + properties_extension) + one-shot
backfill from property_details.listing_events for pre-trigger history.
Tax reassessment forecast TX · Resets to sale price
- Current annual tax
- $11,209 · $934/mo
- Projected year-2 tax
- $11,209 · $934/mo
- Expected delta
- $0/yr ($0/mo · 0.0%)
ⓘ Screening estimate from a state-policy table — verify with the county assessor before closing.
Climate risk First Street
- Flood 1/10 Low FEMA zone X (unshaded) · 0% chance over 30 yrs
- Wildfire 4/10 Moderate
- Heat 7/10 Severe 7 d/yr ≥110°F today · 22 d/yr by 30 yrs out
- Wind 6/10 Major 27% chance of damaging wind over 30 yrs
- Air quality 3/10 Moderate 3 unhealthy d/yr today · 3 by 30 yrs out
Nearby sold comps map
Loading sold comps map…
Walkable amenities ~0.75 mi
Loading nearby amenities…
Taxation est. · year 1
- Rental income
- $81,600
- − Mortgage interest
- −$23,807
- − Property taxes
- −$11,209
- − Insurance
- −$2,125
- − Repairs & maintenance
- −$6,528
- − Management
- −$6,528
- − HOA
- −$348
- − Depreciation
- −$12,364
- Taxable income
- $18,692
- Est. tax owed @ 24.0%
- −$4,486
- After-tax cash flow
- $19,551/yr
For passive investors: Depreciation is non-cash, so a rental often shows a tax loss while cash-flowing — sheltering income. Rental losses are passive: they offset passive income freely, and up to $25,000/yr can offset ordinary (W-2) income if you actively participate and your MAGI is under $100k (phasing out to $0 by $150k); unused losses carry forward. On sale, claimed depreciation is recaptured at up to 25%, and gains may owe capital-gains tax (a 1031 exchange can defer both). Figures are a year-1 estimate at your 24.0% rate — not tax advice; consult a CPA.
Schools (NCES district)
- District
- Gunter ISD
- NCES district ID
- 4821960
- Math proficiency
- 47% ▼ -8.00%
- Reading proficiency
- 58% ▼ -3.00%
- Median HH income
- $79,375
- Composite
- 47.63/100
- National rank
- #2254
- State rank
- #103 of 826 in TX
Livability — Gunter
- Score
- 72/100
- State rank
- #236
- US rank
- #5729
Category grades
Schools grade is shown separately in the Schools card above.
Census & demographics
- Census place
- Gunter, TX
- Population (ZIP)
- 3,614
Population outlook (Grayson County) Hauer SSP2
- Today (2025)
- 134,540 people
- By 2030
- 138,653 · +3.1%
- By 2040
- 145,958 · +8.5%
- By 2050
- 151,218 · +12.4%
- By 2075
- 161,802 · +20.3%
- By 2100
- 159,036 · +18.2%
Race, ethnicity, and origin ACS 2023
- Neighborhood character
- Predominantly White (75%)
- Race & ethnicity
- White 75% Hispanic / Latino 21% Two or more races 18% Black 1% Native American 1%
- Hispanic origin (detail)
- Mexican 20%
- Common ancestry
- Italian 3% Slovak 2% Lithuanian 2%
- Foreign-born
- 10% · Canada
- Languages at home
- 82% English-only · Spanish 18%
Political lean MEDSL · Grayson
- 2024 margin
- Solid R (+54.3) · D 22.5% · R 76.7%
- 2008→2024 swing
- -16.4pp toward R · 2008: -37.9pp · 2024: -54.3pp
- All cycles
- 2024: R+54.3 2020: R+49.9 2016: R+53.1 2012: R+48.0 2008: R+37.9
Not yet ingested
- Civics
- —
Market trends
- HPI YoY
- ▲ 18.56%
- Current HPI
- 309.3751
- Rent YoY
- —
- Metro
- —
- State GDP YoY
- ▲ 3.95%
- F500 in state
- 110
Industry mix (Fortune 500 HQ in TX)
| Industry | F500 HQs | Revenue |
|---|---|---|
| Energy | 16 | $1,198B |
|
||
| Technology | 5 | $198B |
|
||
| Engineering / Construction | 4 | $72B |
|
||
| Energy Services | 3 | $60B |
|
||
| Utilities | 3 | $41B |
|
||
| Healthcare | 2 | $330B |
|
||
Price history
+78.9% since first listed44 events — show timeline
- 2026-04-20 Price Changed $440,000 NTREIS
- 2026-04-02 Price Changed $450,000 NTREIS
- 2026-03-03 Price Changed $465,000 NTREIS
- 2026-02-16 Listed $475,000 NTREIS
- 2025-10-06 Price Changed $430,000 NTREIS
- 2025-09-16 Price Changed $440,000 NTREIS
- 2025-08-31 Price Changed $450,000 NTREIS
- 2025-07-28 Price Changed $460,000 NTREIS
- 2025-07-08 Price Changed $470,000 NTREIS
- 2025-06-19 Price Changed $480,000 NTREIS
- 2025-05-30 Price Changed $490,000 NTREIS
- 2025-05-09 Relisted — NTREIS
- 2025-05-09 Price Changed $500,000 NTREIS
- 2025-04-28 Listing Removed — NTREIS
- 2025-03-28 Listed $515,000 NTREIS
- 2025-03-20 Sold (Public Records) — Public Records
- 2013-07-08 Sold (Public Records) — Public Records
- 2013-07-03 Sold (MLS) — NTREIS
- 2013-06-13 Pending — NTREIS
- 2013-05-31 Contingent — NTREIS
- 2013-05-09 Listed $210,000 NTREIS
- 2012-07-17 Listing Removed — NTREIS
- 2012-06-06 Pending — NTREIS
- 2012-04-05 Price Changed $204,900 NTREIS
- 2012-01-19 Listed $207,900 NTREIS
- 2011-06-08 Listing Removed — NTREIS
- 2011-05-10 Price Changed $198,000 NTREIS
- 2011-04-15 Relisted — NTREIS
- 2011-03-07 Contingent — NTREIS
- 2011-02-23 Listed $200,000 NTREIS
- 2011-01-31 Listing Removed — NTREIS
- 2011-01-20 Price Changed $200,000 NTREIS
- 2010-11-04 Relisted — NTREIS
- 2010-10-31 Listing Removed — NTREIS
- 2010-10-26 Price Changed $210,000 NTREIS
- 2010-04-12 Listed $219,000 NTREIS
- 2008-09-30 Sold (MLS) — NTREIS
- 2008-09-11 Listing Removed — NTREIS
- 2008-03-31 Listed $159,900 NTREIS
- 2004-05-12 Sold (Public Records) — Public Records
- 2004-03-25 Sold (Public Records) — Public Records
- 2004-03-25 Sold (Public Records) — Public Records
- 2004-02-27 Listing Removed — NTREIS
- 2004-02-18 Listed $246,000 NTREIS
Property tax history
+5.0%/yrLatest (2025): $11,209 · +8.2% YoY. Source: county tax records.
Cash-flow waterfall
monthlySold comps — $/sqft
last 12 mo · ≤1 miLoading sold comps…