12718 Ashbury Dr · Rogers, MN
Flood risk No data
- FEMA flood zone
- —
- Chance of flooding over 30 yrs
- —
- Est. flood insurance / yr
- —
Fire risk No data
- Est. fire insurance / yr
- —
Heat risk No data
- Hot days now (above threshold)
- —
- Hot days in 30 yrs
- —
Wind risk No data
- Chance of severe wind over 30 yrs
- —
Air-quality risk No data
- Unhealthy air days now
- —
- Unhealthy air days in 30 yrs
- —
Risk factors via First Street. Map © Google.
Why this score? — see what drove the D- grade
The composite is a weighted blend of 9 inputs, each scored 0–100. Each bar is that input's sub-score; the figure is the points it added to the 100-point composite (weight × sub-score).
- Cash flow +10.5/30.0
- ARV discount +7.5/15.0
- Schools +5.2/10.0
- Condition / age +4.0/5.0
- Livability +3.5/5.0
- 1% rule +3.1/10.0
- DSCR +3.0/10.0
- Rent growth +2.5/5.0
- Appreciation +0.0/10.0
$319,990
🖨 Deal sheet 📄 Offer letter ✓ Due diligence
Listing remarks
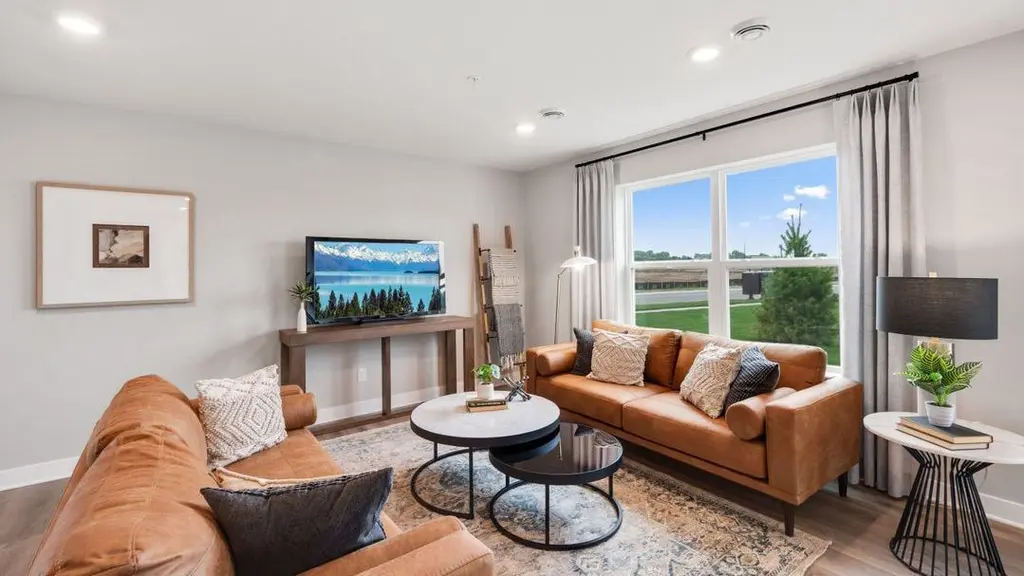
Experience townhome life in the Finley, a two-level, three-bedroom new townhome plan offered at Big Woods in Rogers, Minnesota. The townhomes have a charming and modern exterior in multiple color packages to keep the curb appeal a positive experience in the community. This home features stunning pond views. Irrigation is included to help keep your grass green all summer long. This plan opens with a roomy foyer, and transitions to the open-concept main level which integrates the kitchen and living room. The Finley's kitchen features quartz countertops, and stainless-steel appliances. The outdoors is easily accessible on the kitchen-adjacent concrete patio. Three bedrooms are on the upper lev
Key facts
- Pond views
- Quartz double vanity
- Smart home products
Tags
Property features AI
Finance
- Other: Listing status: Active; Last updated: 2026-06-11
- Financial info: List price $319,990
Exterior
- Parking: 2 garage spaces (2 parking spaces total)
- Home design: Single-family residence (spec-built)
- Exterior features: Located at 12718 Ashbury Dr, Rogers MN 55374; Living area approximately 1665
Interior
- Bedrooms: 3 bedrooms
- Bathrooms: 2 full bathrooms, 1 half bathroom (2.5 total)
- Interior features: Spec home (FINLEY plan)
Neighborhood map
What this means for you Summary
Snapshot
- This is a 3-bed/2.5-bath single-family listed at $320k. Condition is rated good.
Deal economics
- At list price, monthly cash flow is $-161 ($-2k/yr) — negative.
- To cash-flow at today's rent, offer at most $297k (7.3% below list).
- To meet the 1% rule (rent ≥ 1% of price), the offer needs to be $259k (18.9% below list).
- Recommended offer: $259k (18.9% below list) — sets the bar for 1% rule.
- Cap rate 5.7% vs local median 3.6% in Rogers — top-decile yield for the area; either an underpriced asset or a hidden risk that comps aren't pricing in. Stress-test before assuming the spread holds.
Location & tenants
- Location reads 70/100 on livability (#326 in MN) — a middle-class / working-renter tenant base. Strengths: schools A+, employment A+, housing A+; Watch: amenities F, commute F, cost of living F.
- Independent School District 728 (suburban): math 56% / reading 60% proficiency, ranked #37 of 301 in MN (top 12%) — acceptable for families but not a draw, mixed tenant base, ~2y average lease; only 14% free/reduced lunch — higher-income household profile.
- Market conditions: 394 active listings in the ZIP; 2 comparable units currently listed for rent nearby; high-income renter base; 4,651 units permitted in Hennepin County in 2024 (2,443 in 5+ unit buildings).
Forward outlook
- Local home prices are declining (-3.0%/yr); year-one equity from $2k of loan paydown is wiped out by about $10k of value loss. Plan a longer hold.
- Hennepin County population projected at +30% by 2050 — long-run rental-demand tailwind backs the buy-and-hold thesis.
Negotiation context
- Only 7 days on market — expect competitive offers; lowballing is unlikely to land.
Questions for the listing agent
- What do current leases actually rent for vs. the listed asking? Can we see a recent rent roll and the last 12 months of T-12 income?
- Is there a deadline driving the sale (1031 exchange, divorce, estate, relocation)? That informs how much negotiation room exists.
- Schools are A-rated — typically a magnet for longer-tenancy family renters. What's the average tenant stay here, and is there a school-zone premium baked into asking?
- The area grade is low — what's the realistic commute time and amenity access for the typical tenant pool here? Any planned neighborhood developments (good or bad) we should know about?
- What's the average days-on-market for RENTAL listings here right now (not sales)? A rising rental-DOM trend means longer vacancies and softer asking-rent achievability than the comps imply.
- What's the recent tenant-quality profile in this submarket — average credit score on applications, eviction rate, late-payment / NSF rate, and stable-employment percentage? A property-management company in the area should have these aggregated.
- How much new for-sale + rental construction is in the pipeline within 1–3 miles? Heavy new supply typically softens prices + rents 12–24 months out; constrained supply supports both.
Investment metrics
- 1% rule
- 0.81% ✗
- Cap rate
- 5.69%
- Cash-on-cash
- -2.16%
- DSCR
- 0.90
- GRM
- 10.3
CMA / ARV
No comps found within radius.
Projected returns pro-forma
-3.0% appreciation · 3.0% rent growth · sell at horizon
- IRR
- -19.9%
- Equity multiple
- 0.31×
- Total profit
- $-62,089
- Equity at exit
- $47,712
- IRR
- -12.7%
- Equity multiple
- 0.25×
- Total profit
- $-67,139
- Equity at exit
- $27,667
Cash invested: $89,597 (down + closing). Projections, not guarantees.
Landlord ↔ Tenant lean methodology
- Overall (STATE)
- 46 Balanced
- State Minnesota
- 46 Balanced · D+2
- County
- — inherits STATE
- City
- — inherits STATE
ZIP-level market 55374
- Home prices YoY
- -33.9%
- Active inventory
- 394
- Price-to-rent
- 10.3×
Monthly cashflow live
- Estimated rent
- $2,595 medium interval (Pro) →
- Mortgage (P&I)
- −$1,678
- Tax est. 1.5%
- −$400 /mo · $4,800/yr
- Insurance
- −$133
- HOA
- −$0
- Vacancy / Maint / Mgmt
- −$545
- Net cashflow
- $-161
Break-even live
UW: 25.0% down · 7.5% · 30yr · 1.5% tax · 5.0% vac · 8.0% maint · 8.0% mgmt
Financing live
Cash to close
- Down payment
- $79,998
- Closing costs
- $9,600
- Reserves months
- —
- Total cash needed
- —
Loan-product check · same deal, 3 products live
Conventional
25% down · 7.5% · 30yr
- Down + closing
- —
- Monthly P&I
- —
- Monthly cashflow
- —
- DSCR
- —
- Eligible?
- —
Personal DTI + credit; lowest rate.
DSCR
20% down · 8.5% · 30yr
- Down + closing
- —
- Monthly P&I
- —
- Monthly cashflow
- —
- DSCR
- —
- Eligible?
- —
No personal income docs; deal must DSCR.
Hard money
10% down · 12.0% · 12mo
- Down + closing
- —
- Monthly P&I
- —
- Monthly cashflow
- —
- DSCR
- —
- Eligible?
- —
Short-term bridge; refi at stabilization.
Rent comps 2 comps
| Address | Beds | Baths | Sqft | Rent | $/sqft | DOM | Units | Dist |
|---|---|---|---|---|---|---|---|---|
| 12724 Ashbury Dr Rogers, MN | 4.0 | 3.0 | 1820 | $2,775 | $1.52 | 4d | 1 | 0.04mi |
| 13625 Busch Ln Unit 1 Rogers, MN | 3.0 | 3.0 | 1667 | $2,640 | $1.58 | 43d | 1 | 1.25mi |
Listing history 7 events
-
2026-06-18days on market $319,990 Active 7 DOM
-
2026-06-17days on market $319,990 Active 6 DOM
-
2026-06-16days on market $319,990 Active 5 DOM
-
2026-06-15days on market $319,990 Active 4 DOM
-
2026-06-13days on market $319,990 Active 2 DOM
-
2026-06-13remarks 699-char remark
-
2026-06-13$319,990 Active 1 DOM
ⓘ Source: listings_history table (triggers on properties + properties_extension) + one-shot
backfill from property_details.listing_events for pre-trigger history.
Nearby sold comps map
Loading sold comps map…
Walkable amenities ~0.75 mi
Loading nearby amenities…
Taxation est. · year 1
- Rental income
- $31,140
- − Mortgage interest
- −$17,924
- − Property taxes
- −$4,800
- − Insurance
- −$1,600
- − Repairs & maintenance
- −$2,491
- − Management
- −$2,491
- − Depreciation
- −$9,309
- Taxable loss
- −$7,476
- Est. tax savings @ 24.0%
- +$1,794
- After-tax cash flow
- $-142/yr
For passive investors: Depreciation is non-cash, so a rental often shows a tax loss while cash-flowing — sheltering income. Rental losses are passive: they offset passive income freely, and up to $25,000/yr can offset ordinary (W-2) income if you actively participate and your MAGI is under $100k (phasing out to $0 by $150k); unused losses carry forward. On sale, claimed depreciation is recaptured at up to 25%, and gains may owe capital-gains tax (a 1031 exchange can defer both). Figures are a year-1 estimate at your 24.0% rate — not tax advice; consult a CPA.
Condition & rehab AI · 14 photos
This home is in good condition with a good condition score of 80. It has a good kitchen, bathrooms, and exterior. The home is move-in ready with minor cosmetic updates needed.
Value-add opportunities
- Both Paint exterior — Enhances curb appeal and value
- Both Replace carpet with hardwood — Improves aesthetics and is durable
- Both Install smart home devices — Enhances convenience and marketability
Renovation cost estimate screening
Value-add ROI direction
- Both Paint exterior — Enhances curb appeal and value ↑
- Both Replace carpet with hardwood — Improves aesthetics and is durable ↑
- Both Install smart home devices — Enhances convenience and marketability ↑
ⓘ Cost ranges are severity-bucket heuristics (US national rule-of-thumb). Get contractor quotes + a written scope before underwriting a rehab budget.
Schools (NCES district)
- District
- Independent School District 728
- NCES district ID
- 2711370
- Math proficiency
- 56% ▼ -15.00%
- Reading proficiency
- 60% ▼ -10.00%
- Median HH income
- $82,336
- Composite
- 52.5/100
- National rank
- #1567
- State rank
- #37 of 301 in MN
Livability — Rogers
- Score
- 70/100
- State rank
- #326
- US rank
- #7371
Category grades
Schools grade is shown separately in the Schools card above.
Census & demographics
- Census place
- Rogers, MN
- County
- Hennepin County · 1,150,272 people
- City population
- 16,661
- Metro
- Minneapolis-St. Paul-Bloomington, MN-WI
- Population (ZIP)
- 16,661
- Household income
- $144,714
- Rent vs Own
- Severe rent burden
- 32.0
Population outlook (Hennepin County) Hauer SSP2
- Today (2025)
- 1,405,227 people
- By 2030
- 1,492,650 · +6.2%
- By 2040
- 1,660,157 · +18.1%
- By 2050
- 1,823,498 · +29.8%
- By 2075
- 2,221,283 · +58.1%
- By 2100
- 2,509,976 · +78.6%
Race, ethnicity, and origin ACS 2023
- Neighborhood character
- Predominantly White (86%)
- Race & ethnicity
- White 86% Black 5% Two or more races 4% Hispanic / Latino 3% Asian 2%
- Common ancestry
- Portuguese 15% Lithuanian 5% Romanian 4%
- Foreign-born
- 4% · South Korea, China
- Languages at home
- 95% English-only · Spanish 1% Other Asian/Pacific 1% Other Indo-European 1%
Political lean MEDSL · Hennepin
- 2024 margin
- Solid D (+42.6) · D 70.2% · R 27.5% · Other 2.3%
- 2008→2024 swing
- +14.0pp toward D · 2008: 28.6pp · 2024: 42.6pp
- All cycles
- 2024: D+42.6 2020: D+43.2 2016: D+35.3 2012: D+27.1 2008: D+28.6
Not yet ingested
- Civics
- —
Market trends
- HPI YoY
- ▼ -118.53%
- Current HPI
- 230.7463
- Rent YoY
- —
- Metro
- Minneapolis-St. Paul-Bloomington, MN-WI
- State GDP YoY
- ▲ 2.41%
- F500 in state
- 34
Industry mix (Fortune 500 HQ in MN)
| Industry | F500 HQs | Revenue |
|---|---|---|
| Healthcare | 2 | $407B |
|
||
| Retail | 2 | $150B |
|
||
| Consumer Goods | 2 | $32B |
|
||
| Industrial Machinery | 2 | $6B |
|
||
| Agriculture | 1 | $40B |
|
||
| Healthcare / Medical Devices | 1 | $32B |
|
||
Cash-flow waterfall
monthlySold comps — $/sqft
last 12 mo · ≤1 miLoading sold comps…