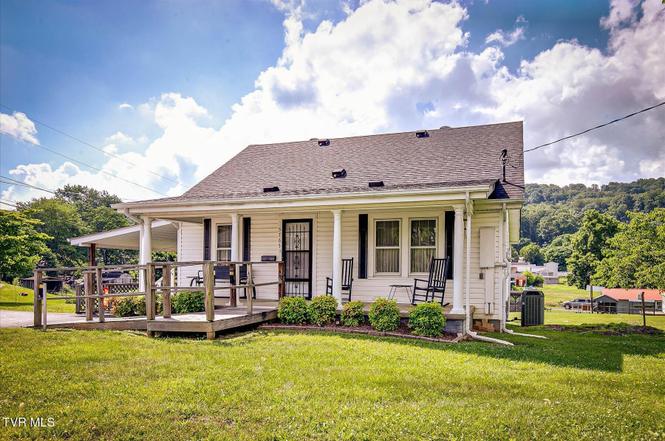
5765 Orebank Rd · Orebank, TN
Flood risk 1/10 · Minimal
- FEMA flood zone
- X (unshaded)
- Chance of flooding over 30 yrs
- 0.0%
- Est. flood insurance / yr
- $473 – $860
Fire risk 5/10 · Moderate
- Est. fire insurance / yr
- $949 – $1,763
Heat risk 4/10 · Minor
- Hot days now (above 98°F)
- 7 days/yr
- Hot days in 30 yrs
- 22 days/yr
Wind risk 2/10 · Minimal
- Chance of severe wind over 30 yrs
- —
Air-quality risk 2/10 · Minimal
- Unhealthy air days now
- 0 days/yr
- Unhealthy air days in 30 yrs
- 1 days/yr
Risk factors via First Street. Map © Google.
Why this score? — see what drove the C+ grade
The composite is a weighted blend of 9 inputs, each scored 0–100. Each bar is that input's sub-score; the figure is the points it added to the 100-point composite (weight × sub-score).
- Cash flow +25.2/30.0
- ARV discount +15.0/15.0
- DSCR +8.3/10.0
- 1% rule +5.3/10.0
- Rent growth +3.4/5.0
- Livability +2.5/5.0
- Condition / age +2.5/5.0
- Schools +1.8/10.0
- Appreciation +0.0/10.0
$189,900
🖨 Deal sheet 📄 Offer letter ✓ Due diligence
Listing remarks
Charming 3-bedroom, 1-bath two-story cottage offering timeless appeal and plenty of potential. This well-maintained home features low-maintenance vinyl siding and a comfortable interior with a combination of carpet, hardwood, and vinyl flooring. Hardwood floors are also present beneath the carpet, providing an opportunity to restore their original beauty. The spacious living and dining room combination creates an inviting area for everyday living and entertaining, while the eat-in kitchen offers ample space for family meals. A separate laundry room adds convenience and functionality. Outdoor amenities include a covered front porch, a 10' x 18' rear deck perfect for relaxing or entertaining,
Key facts
- Covered front porch
- Carport
- Vinyl siding
Tags
Property features AI
Finance
- Other: Zoning: R 3A; Lot roughly 0.69 acres (approx. 154 x 214 irregular)
- HOA & community: Landscaping (association amenity)
Exterior
- Parking: Attached garage; Carport (1 space); Driveway with asphalt surface
- Security: Smoke detector(s)
- Utilities: Public water; Septic tank sewer; Electricity connected; Cable available and connected; Phone connected
- Home design: Single family residence; House with two levels
- Construction: Vinyl siding; Block foundation; Shingle roof; Built as a house
- Exterior features: Covered patio/deck and front porch; Deck; Storm doors; Outbuilding; Level to sloped topography
Interior
- Kitchen: Microwave; Range; Refrigerator
- Flooring: Carpet; Hardwood; Laminate
- Bathrooms: One full bathroom
- Heating & cooling: Heat pump for heating; Heat pump for cooling
- Interior features: Eat-in kitchen; Window treatments; Fireplace in the living room; Basement with concrete construction, partial finish, exterior entry and walk-out access; Seven total rooms
- Laundry & utility: Washer hookup; Electric dryer hookup; Washer and dryer included
Neighborhood map
What this means for you Summary
Snapshot
- This is a 3-bed/1.0-bath single-family listed at $190k.
Deal economics
- At list price, monthly cash flow is $424 ($5k/yr) — positive.
- The deal already cash-flows at list — no discount required.
- Meets the 1% rule at list price ($2k rent vs $190k).
Location & tenants
- Location reads: area grade C — affects rentability + tenant quality, not the cash-flow math above.
- Sullivan County (suburban): math 17% / reading 24% proficiency, ranked #109 of 139 in TN (top 78%) — low school quality limits family demand, transient renter base, plan for 1-2y turnover.
- Zoned schools: Indian Springs Elementary (math 22% / reading 32%, grade F, #496 of 952 statewide, top 55%, 377 students, 0% FRL); Sullivan Central Middle School (590 students, 0% FRL); West Ridge High School (1,683 students, 0% FRL) — zoned schools average 0% FRL vs 45% district-wide (45 pts lower); this property's tenant base skews higher-income than the district average.
- Market conditions: Rents rising (+3.7%/yr); 267 active listings in the ZIP; 3 comparable units currently listed for rent nearby; rentals leasing fast (median 14d on market — plan ~1-2 weeks tenant-placement turnaround); 453 units permitted in Sullivan County in 2024 (6 in 5+ unit buildings).
- This rent runs 37% of the median local income ($64k/yr) — at the standard rent-burdened threshold; future hikes will face affordability resistance.
Forward outlook
- Local home prices are declining (-3.0%/yr); year-one equity from $1k of loan paydown is wiped out by about $6k of value loss. Plan a longer hold.
- Sullivan County population projected to shrink 5% by 2050 — rents likely to lag national; underwrite the cash flow, not the appreciation.
Negotiation context
- Only 4 days on market — expect competitive offers; lowballing is unlikely to land.
Risks & watch-outs
- Watch-outs: built in 1938 — expect roof / HVAC / electrical / plumbing capex.
- Climate carrying-cost: moderate wildfire risk — expect insurance premiums to compound above CPI over the hold.
Questions for the listing agent
- Built in 1938 — when were the roof, HVAC, electrical panel, plumbing, and water heater last replaced?
- Is there a deadline driving the sale (1031 exchange, divorce, estate, relocation)? That informs how much negotiation room exists.
- What's the average days-on-market for RENTAL listings here right now (not sales)? A rising rental-DOM trend means longer vacancies and softer asking-rent achievability than the comps imply.
- What's the recent tenant-quality profile in this submarket — average credit score on applications, eviction rate, late-payment / NSF rate, and stable-employment percentage? A property-management company in the area should have these aggregated.
- How much new for-sale + rental construction is in the pipeline within 1–3 miles? Heavy new supply typically softens prices + rents 12–24 months out; constrained supply supports both.
Investment metrics
- 1% rule
- 1.03% ✓
- Cap rate
- 8.97%
- Cash-on-cash
- 9.57%
- DSCR
- 1.43
- GRM
- 8.1
CMA / ARV
- ARV (on-the-fly)
- $233,632
- Comps found
- 7
Show comp detail 7 sales within ~0.75 mi
| Address | Dist | Beds/Ba | Sqft | Sold | Price | $/sf | Match |
|---|---|---|---|---|---|---|---|
| 316 Archcrest St | 0.11mi | 3/1.0 | 1,369 (-13%) | 12mo | $196,350 | $143 | 64 |
| 5630 Orebank Rd | 0.42mi | 3/2.5 | 1,632 (+4%) | 9mo | $276,000 | $169 | 60 |
| 5634 Orebank Rd | 0.41mi | 3/2.0 | 1,404 (-10%) | 2mo | $230,000 | $164 | 58 |
| 321 Rockwood St | 0.45mi | 3/2.0 | 1,440 (-8%) | 6mo | $215,000 | $149 | 57 |
| 4709 Edens View Rd | 0.73mi | 3/2.0 | 1,788 (+14%) | 2mo | $235,000 | $131 | 37 |
| 352 Stage Rd | 0.67mi | 3/2.0 | 1,332 (-15%) | 5mo | $195,000 | $146 | 35 |
| 5438 Orebank Rd | 0.60mi | 3/2.0 | 1,344 (-14%) | 12mo | $285,000 | $212 | 34 |
Match score weights: distance 35% · size 25% · config 20% · recency 20%. Top-matched comps best support the ARV.
Projected returns pro-forma
-3.0% appreciation · 3.73% rent growth · sell at horizon
- IRR
- -1.2%
- Equity multiple
- 0.95×
- Total profit
- $-2,412
- Equity at exit
- $28,315
- IRR
- 9.1%
- Equity multiple
- 1.72×
- Total profit
- $38,342
- Equity at exit
- $16,419
Cash invested: $53,172 (down + closing). Projections, not guarantees.
Landlord ↔ Tenant lean methodology
- Overall (STATE)
- 87 Strongly Landlord-Friendly
- State Tennessee
- 87 Strongly Landlord-Friendly · R+13
- County
- — inherits STATE
- City
- — inherits STATE
ZIP-level market 37664
- Home prices YoY
- -24.5%
- Rents YoY
- 3.7%
- Active inventory
- 267
- Price-to-rent
- 8.1×
Monthly cashflow live
- Estimated rent
- $1,957 medium interval (Pro) →
- Mortgage (P&I)
- −$996
- Tax from tax record
- −$47 /mo · $566/yr
- Insurance
- −$79
- HOA
- −$0
- Vacancy / Maint / Mgmt
- −$411
- Net cashflow
- $424
Break-even live
UW: 25.0% down · 7.5% · 30yr · 1.5% tax · 5.0% vac · 8.0% maint · 8.0% mgmt
Financing live
Cash to close
- Down payment
- $47,475
- Closing costs
- $5,697
- Reserves months
- —
- Total cash needed
- —
Loan-product check · same deal, 3 products live
Conventional
25% down · 7.5% · 30yr
- Down + closing
- —
- Monthly P&I
- —
- Monthly cashflow
- —
- DSCR
- —
- Eligible?
- —
Personal DTI + credit; lowest rate.
DSCR
20% down · 8.5% · 30yr
- Down + closing
- —
- Monthly P&I
- —
- Monthly cashflow
- —
- DSCR
- —
- Eligible?
- —
No personal income docs; deal must DSCR.
Hard money
10% down · 12.0% · 12mo
- Down + closing
- —
- Monthly P&I
- —
- Monthly cashflow
- —
- DSCR
- —
- Eligible?
- —
Short-term bridge; refi at stabilization.
Rent comps 3 comps
| Address | Beds | Baths | Sqft | Rent | $/sqft | DOM | Units | Dist |
|---|---|---|---|---|---|---|---|---|
| 1080 Packing House Rd Unit 12 1 Kingsport, TN | 2.0 | 2.5 | 1300 | $1,400 | $1.08 | 13d | 1 | 0.62mi |
| 5013 Emerald Dr Kingsport, TN | 3.0 | 2.0 | 1400 | $3,000 | $2.14 | 13d | 1 | 0.94mi |
| 893 New Beason Well Rd Kingsport, TN | 3.0 | 2.0 | 1139 | $1,188 | $1.04 | 13d | 3 | 1.45mi |
Listing history 5 events
-
2026-06-19days on market $189,900 Active 4 DOM
-
2026-06-18days on market $189,900 Active 3 DOM
-
2026-06-17days on market $189,900 Active 2 DOM
-
2026-06-15remarks 699-char remark
-
2026-06-15$189,900 Active 1 DOM
ⓘ Source: listings_history table (triggers on properties + properties_extension) + one-shot
backfill from property_details.listing_events for pre-trigger history.
Tax reassessment forecast TN · Resets to sale price
- Current annual tax
- $566 · $47/mo
- Projected year-2 tax
- $1,348 · $112/mo
- Expected delta
- +$782/yr (+$65/mo · 138.2%)
ⓘ Screening estimate from a state-policy table — verify with the county assessor before closing.
Climate risk First Street
- Flood 1/10 Low FEMA zone X (unshaded) · 0% chance over 30 yrs
- Wildfire 5/10 Major
- Heat 4/10 Moderate 7 d/yr ≥98°F today · 22 d/yr by 30 yrs out
- Wind 2/10 Low
- Air quality 2/10 Low 0 unhealthy d/yr today · 1 by 30 yrs out
Nearby sold comps map
Loading sold comps map…
Walkable amenities ~0.75 mi
Loading nearby amenities…
Taxation est. · year 1
- Rental income
- $23,485
- − Mortgage interest
- −$10,637
- − Property taxes
- −$566
- − Insurance
- −$950
- − Repairs & maintenance
- −$1,879
- − Management
- −$1,879
- − Depreciation
- −$5,524
- Taxable income
- $2,050
- Est. tax owed @ 24.0%
- −$492
- After-tax cash flow
- $4,595/yr
For passive investors: Depreciation is non-cash, so a rental often shows a tax loss while cash-flowing — sheltering income. Rental losses are passive: they offset passive income freely, and up to $25,000/yr can offset ordinary (W-2) income if you actively participate and your MAGI is under $100k (phasing out to $0 by $150k); unused losses carry forward. On sale, claimed depreciation is recaptured at up to 25%, and gains may owe capital-gains tax (a 1031 exchange can defer both). Figures are a year-1 estimate at your 24.0% rate — not tax advice; consult a CPA.
Schools (NCES district)
- District
- Sullivan County
- NCES district ID
- 4703990
- Math proficiency
- 17% ▼ -15.00%
- Reading proficiency
- 24% ▼ -10.00%
- Median HH income
- $43,263
- Composite
- 17.66/100
- National rank
- #9030
- State rank
- #109 of 139 in TN
Livability — Orebank
No livability data for this city. (Only ~50 U.S. cities are tracked.)
Census & demographics
- Census place
- Orebank, TN
- County
- Sullivan County · 121,987 people
- Metro
- Kingsport-Bristol, TN-VA
- Population (ZIP)
- 28,267
- Household income
- $63,653
- Rent vs Own
- Severe rent burden
- 739.0
Population outlook (Sullivan County) Hauer SSP2
- Today (2025)
- 157,030 people
- By 2030
- 156,415 · -0.4%
- By 2040
- 153,778 · -2.1%
- By 2050
- 149,018 · -5.1%
- By 2075
- 138,068 · -12.1%
- By 2100
- 119,927 · -23.6%
Race, ethnicity, and origin ACS 2023
- Neighborhood character
- Predominantly White (94%)
- Race & ethnicity
- White 94% Two or more races 3% Hispanic / Latino 2% Black 1%
- Common ancestry
- Serbian 4% Slovak 3% Italian 1%
- Foreign-born
- 2% · Canada, China
- Languages at home
- 98% English-only · Spanish 1% Chinese 1%
Political lean MEDSL · Sullivan
- 2024 margin
- Solid R (+55.0) · D 22.0% · R 77.0% · Other 1.0%
- 2008→2024 swing
- -13.6pp toward R · 2008: -41.3pp · 2024: -55.0pp
- All cycles
- 2024: R+55.0 2020: R+51.9 2016: R+56.2 2012: R+47.2 2008: R+41.3
Not yet ingested
- Civics
- —
Market trends
- HPI YoY
- ▼ -85.12%
- Current HPI
- 261.7474
- Rent YoY
- ▲ 3.73%
- Metro
- Kingsport-Bristol, TN-VA
- State GDP YoY
- ▲ 2.78%
- F500 in state
- 22
Industry mix (Fortune 500 HQ in TN)
| Industry | F500 HQs | Revenue |
|---|---|---|
| Healthcare | 3 | $91B |
|
||
| Retail | 3 | $72B |
|
||
| Transportation / Logistics | 1 | $88B |
|
||
| Paper / Packaging | 1 | $19B |
|
||
| Insurance | 1 | $13B |
|
||
| Energy | 1 | $12B |
|
||
Price history
1 event — show timeline
- 2026-06-13 Listed $189,900 TVRMLS
Property tax history
+3.6%/yrLatest (2025): $566 · +1.4% YoY. Source: county tax records.
Cash-flow waterfall
monthlySold comps — $/sqft
last 12 mo · ≤1 miLoading sold comps…