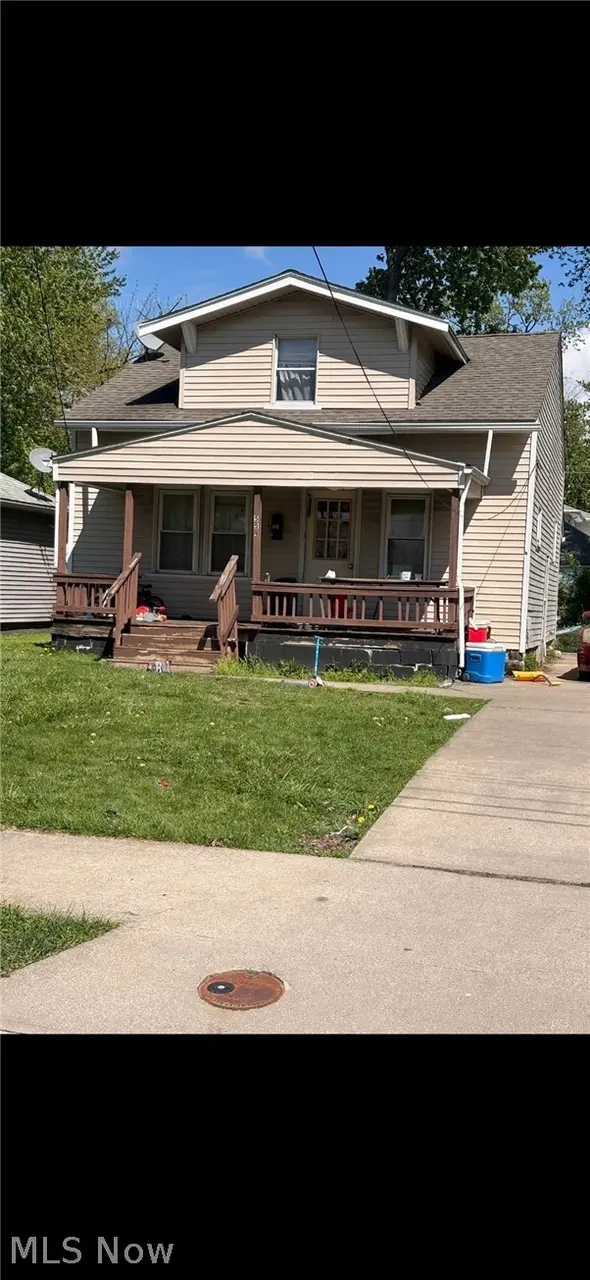
554 Fairlawn Ave · Painesville, OH
Flood risk 6/10 · Moderate
- FEMA flood zone
- X (unshaded)
- Chance of flooding over 30 yrs
- 0.71%
- Est. flood insurance / yr
- $473 – $860
Fire risk 1/10 · Minimal
- Est. fire insurance / yr
- $713 – $1,323
Heat risk 3/10 · Minor
- Hot days now (above 96°F)
- 7 days/yr
- Hot days in 30 yrs
- 18 days/yr
Wind risk 1/10 · Minimal
- Chance of severe wind over 30 yrs
- —
Air-quality risk 4/10 · Minor
- Unhealthy air days now
- 4 days/yr
- Unhealthy air days in 30 yrs
- 5 days/yr
Risk factors via First Street. Map © Google.
Why this score? — see what drove the C grade
The composite is a weighted blend of 9 inputs, each scored 0–100. Each bar is that input's sub-score; the figure is the points it added to the 100-point composite (weight × sub-score).
- Cash flow +21.8/30.0
- ARV discount +9.0/15.0
- DSCR +7.0/10.0
- 1% rule +5.6/10.0
- Livability +3.6/5.0
- Rent growth +3.4/5.0
- Schools +2.6/10.0
- Condition / age +2.5/5.0
- Appreciation +0.0/10.0
$115,000
🖨 Deal sheet 📄 Offer letter ✓ Due diligence
Key facts
- 4,639 sq ft lot
- Parking
- Built 1930
Property features AI
Finance
- Financial info: Annual tax amount listed ($1,647 for 2025)
Exterior
- Parking: Driveway
- Utilities: Public water; Public sewer
- Home design: Single-family property; 936 above-grade finished area (per listing source)
- Construction: Vinyl siding; Asphalt/fiberglass roof
- Exterior features: Patio; Porch
Interior
- Bedrooms: 2 main-level bedrooms
- Bathrooms: 1 full bathroom; 1 half bathroom; 1 main-level bathroom
- Heating & cooling: Baseboard heating
- Interior features: Full, unfinished basement; Total of 5 rooms
Neighborhood map
What this means for you Summary
Snapshot
- This is a 3-bed/1.5-bath single-family listed at $115k.
Deal economics
- At list price, monthly cash flow is $179 ($2k/yr) — positive.
- The deal already cash-flows at list — no discount required.
- Meets the 1% rule at list price ($1k rent vs $115k).
- Cap rate 8.2% vs local median 2.9% in Painesville — top-decile yield for the area; either an underpriced asset or a hidden risk that comps aren't pricing in. Stress-test before assuming the spread holds.
Location & tenants
- Location reads 72/100 on livability (#360 in OH) — a middle-class / working-renter tenant base. Strengths: cost of living A+, housing A+, health & safety A+; Watch: employment D+, amenities F, commute F.
- Painesville City Local (suburban): math 28% / reading 35% proficiency, ranked #577 of 656 in OH (top 88%) — families likely to look elsewhere, expect single-tenant / working-renter base with shorter leases; 76% free/reduced lunch — lower-income household profile, screen leases tightly.
- Market conditions: Rents rising (+3.7%/yr); 267 active listings in the ZIP; 5 comparable units currently listed for rent nearby; rentals lingering (median 44d on market — plan ~5-8 weeks vacancy on turnover, expect pricing pressure); 60% of comp listings sitting > 30 days — soft ceiling on asking rent; solid renter incomes; 448 units permitted in Lake County in 2024 (0 in 5+ unit buildings).
- This rent is only 17% of the median local income ($85k/yr) — well below the 30% rent-burden line; pricing power to push rent on renewal without tenant pushback.
Forward outlook
- Local home prices are declining (-3.0%/yr); year-one equity from $795 of loan paydown is wiped out by about $3k of value loss. Plan a longer hold.
- Lake County population projected to shrink 8% by 2050 — rents likely to lag national; underwrite the cash flow, not the appreciation.
Negotiation context
- Only 1 days on market — expect competitive offers; lowballing is unlikely to land.
- Current owner paid $63k; list at $115k implies a 83% gain — meaningful room to come down on a strong offer.
Risks & watch-outs
- Watch-outs: built in 1930 — expect roof / HVAC / electrical / plumbing capex.
- Climate carrying-cost: major flood risk — expect insurance premiums to compound above CPI over the hold.
Questions for the listing agent
- Built in 1930 — when were the roof, HVAC, electrical panel, plumbing, and water heater last replaced?
- Is there a deadline driving the sale (1031 exchange, divorce, estate, relocation)? That informs how much negotiation room exists.
- What's the average days-on-market for RENTAL listings here right now (not sales)? A rising rental-DOM trend means longer vacancies and softer asking-rent achievability than the comps imply.
- What's the recent tenant-quality profile in this submarket — average credit score on applications, eviction rate, late-payment / NSF rate, and stable-employment percentage? A property-management company in the area should have these aggregated.
- How much new for-sale + rental construction is in the pipeline within 1–3 miles? Heavy new supply typically softens prices + rents 12–24 months out; constrained supply supports both.
Investment metrics
- 1% rule
- 1.06% ✓
- Cap rate
- 8.16%
- Cash-on-cash
- 6.68%
- DSCR
- 1.30
- GRM
- 7.8
CMA / ARV
- ARV (on-the-fly)
- $118,872
- Comps found
- 8
Show comp detail 8 sales within ~0.75 mi
| Address | Dist | Beds/Ba | Sqft | Sold | Price | $/sf | Match |
|---|---|---|---|---|---|---|---|
| 783 North Ave | 0.30mi | 3/2.0 | 948 (+1%) | 10mo | $195,000 | $206 | 73 |
| 191 Mathews St | 0.57mi | 3/1.0 | 956 (+2%) | 2mo | $55,000 | $58 | 67 |
| 832 North Ave | 0.37mi | 3/1.0 | 864 (-8%) | 7mo | $110,100 | $127 | 62 |
| 863 North | 0.42mi | 3/1.0 | 842 (-10%) | 1mo | $116,095 | $138 | 61 |
| 845 Hine Ave | 0.42mi | 3/1.0 | 1,014 (+8%) | 14mo | $85,000 | $84 | 53 |
| 199 Mathews St | 0.56mi | 2/1.0 (-1) | 850 (-9%) | 1mo | $50,000 | $59 | 51 |
| 811 Hine Ave | 0.36mi | 2/1.0 (-1) | 1,064 (+14%) | 15mo | $144,000 | $135 | 41 |
| 586 Williams St | 0.68mi | 3/1.0 | 1,064 (+14%) | 23mo | $133,500 | $125 | 24 |
Match score weights: distance 35% · size 25% · config 20% · recency 20%. Top-matched comps best support the ARV.
Projected returns pro-forma
-3.0% appreciation · 3.68% rent growth · sell at horizon
- IRR
- -5.3%
- Equity multiple
- 0.80×
- Total profit
- $-6,356
- Equity at exit
- $17,147
- IRR
- 5.2%
- Equity multiple
- 1.40×
- Total profit
- $12,739
- Equity at exit
- $9,943
Cash invested: $32,200 (down + closing). Projections, not guarantees.
Landlord ↔ Tenant lean methodology
- Overall (STATE)
- 73 Landlord-Friendly
- State Ohio
- 73 Landlord-Friendly · R+6
- County
- — inherits STATE
- City
- — inherits STATE
ZIP-level market 44077
- Rents YoY
- 3.7%
- Active inventory
- 267
- Price-to-rent
- 7.8×
Monthly cashflow live
- Estimated rent
- $1,225 high interval (Pro) →
- Mortgage (P&I)
- −$603
- Tax from tax record
- −$137 /mo · $1,647/yr
- Insurance
- −$48
- HOA
- −$0
- Vacancy / Maint / Mgmt
- −$257
- Net cashflow
- $179
Break-even live
UW: 25.0% down · 7.5% · 30yr · 1.5% tax · 5.0% vac · 8.0% maint · 8.0% mgmt
Financing live
Cash to close
- Down payment
- $28,750
- Closing costs
- $3,450
- Reserves months
- —
- Total cash needed
- —
Loan-product check · same deal, 3 products live
Conventional
25% down · 7.5% · 30yr
- Down + closing
- —
- Monthly P&I
- —
- Monthly cashflow
- —
- DSCR
- —
- Eligible?
- —
Personal DTI + credit; lowest rate.
DSCR
20% down · 8.5% · 30yr
- Down + closing
- —
- Monthly P&I
- —
- Monthly cashflow
- —
- DSCR
- —
- Eligible?
- —
No personal income docs; deal must DSCR.
Hard money
10% down · 12.0% · 12mo
- Down + closing
- —
- Monthly P&I
- —
- Monthly cashflow
- —
- DSCR
- —
- Eligible?
- —
Short-term bridge; refi at stabilization.
Rent comps 5 comps
| Address | Beds | Baths | Sqft | Rent | $/sqft | DOM | Units | Dist |
|---|---|---|---|---|---|---|---|---|
| 244 E Prospect St Painesville, OH | 2.0 | 1.0 | 1000 | $1,195 | $1.20 | 2d | 1 | 0.55mi |
| 1059 Richmond Rd Painesville, OH | 1.0–2.0 | 1.0 | 625 | $1,200 | $1.92 | 2d | 1 | 0.85mi |
| 45 W High St Apt 211 Painesville, OH | 2.0 | 1.0 | 665 | $855 | $1.29 | 44d | 1 | 0.94mi |
| 551 W Jackson St Unit RFV A201 Painesville, OH | 2.0 | 1.0 | 860 | $1,045 | $1.22 | 44d | 1 | 0.94mi |
| 48 Pearl St Painesville, OH | 2.0 | 1.0 | 950 | $1,250 | $1.32 | 44d | 1 | 1.15mi |
Listing history 4 events
-
2026-05-02status Pending
-
2026-04-30$115,000 Active
-
2004-05-07soldstatus $63,000
-
1989-07-25soldstatus $12,000
ⓘ Source: listings_history table (triggers on properties + properties_extension) + one-shot
backfill from property_details.listing_events for pre-trigger history.
Tax reassessment forecast OH · Partial reset (capped growth)
- Current annual tax
- $1,647 · $137/mo
- Projected year-2 tax
- $1,721 · $143/mo
- Expected delta
- +$73/yr (+$6/mo · 4.5%)
ⓘ Screening estimate from a state-policy table — verify with the county assessor before closing.
Climate risk First Street
- Flood 6/10 Major FEMA zone X (unshaded) · 71% chance over 30 yrs
- Wildfire 1/10 Low
- Heat 3/10 Moderate 7 d/yr ≥96°F today · 18 d/yr by 30 yrs out
- Wind 1/10 Low
- Air quality 4/10 Moderate 4 unhealthy d/yr today · 5 by 30 yrs out
Nearby sold comps map
Loading sold comps map…
Walkable amenities ~0.75 mi
Loading nearby amenities…
Taxation est. · year 1
- Rental income
- $14,697
- − Mortgage interest
- −$6,442
- − Property taxes
- −$1,647
- − Insurance
- −$575
- − Repairs & maintenance
- −$1,176
- − Management
- −$1,176
- − Depreciation
- −$3,345
- Taxable income
- $336
- Est. tax owed @ 24.0%
- −$81
- After-tax cash flow
- $2,071/yr
For passive investors: Depreciation is non-cash, so a rental often shows a tax loss while cash-flowing — sheltering income. Rental losses are passive: they offset passive income freely, and up to $25,000/yr can offset ordinary (W-2) income if you actively participate and your MAGI is under $100k (phasing out to $0 by $150k); unused losses carry forward. On sale, claimed depreciation is recaptured at up to 25%, and gains may owe capital-gains tax (a 1031 exchange can defer both). Figures are a year-1 estimate at your 24.0% rate — not tax advice; consult a CPA.
Schools (NCES district)
- District
- Painesville City Local
- NCES district ID
- 3910015
- Math proficiency
- 28% ▼ -8.00%
- Reading proficiency
- 35% ▼ -6.00%
- Median HH income
- $35,381
- Composite
- 26.03/100
- National rank
- #7309
- State rank
- #577 of 656 in OH
Livability — Painesville
- Score
- 72/100
- State rank
- #360
- US rank
- #5785
Category grades
Schools grade is shown separately in the Schools card above.
Census & demographics
- Census place
- Painesville, OH
- County
- Lake County · 204,927 people
- City population
- 57,325
- Metro
- Cleveland-Elyria, OH
- Population (ZIP)
- 57,325
- Household income
- $85,056
- Rent vs Own
- Severe rent burden
- 1333.0
Population outlook (Lake County) Hauer SSP2
- Today (2025)
- 230,022 people
- By 2030
- 228,151 · -0.8%
- By 2040
- 221,018 · -3.9%
- By 2050
- 212,754 · -7.5%
- By 2075
- 200,309 · -12.9%
- By 2100
- 183,315 · -20.3%
Race, ethnicity, and origin ACS 2023
- Neighborhood character
- Predominantly White (78%)
- Race & ethnicity
- White 78% Hispanic / Latino 12% Two or more races 7% Black 5% Asian 1%
- Hispanic origin (detail)
- Mexican 7% Puerto Rican 3%
- Common ancestry
- Romanian 6% Lithuanian 2% Slovak 2%
- Foreign-born
- 6% · Canada, China
- Languages at home
- 88% English-only · Spanish 9% Russian/Polish/Slavic 1% Other Indo-European 1%
Political lean MEDSL · Lake
- 2024 margin
- R (+14.3) · D 42.4% · R 56.7%
- 2008→2024 swing
- -15.2pp toward R · 2008: 0.8pp · 2024: -14.3pp
- All cycles
- 2024: R+14.3 2020: R+13.6 2016: R+15.6 2012: R+1.7 2008: D+0.8
Not yet ingested
- Civics
- —
Market trends
- HPI YoY
- ▼ -183.05%
- Current HPI
- 181.2976
- Rent YoY
- ▲ 3.68%
- Metro
- Cleveland-Elyria, OH
- State GDP YoY
- ▲ 1.98%
- F500 in state
- 48
Industry mix (Fortune 500 HQ in OH)
| Industry | F500 HQs | Revenue |
|---|---|---|
| Insurance | 3 | $145B |
|
||
| Industrial Machinery | 3 | $49B |
|
||
| Financial Services | 3 | $24B |
|
||
| Consumer Goods | 2 | $93B |
|
||
| Aerospace / Defense | 2 | $47B |
|
||
| Utilities | 2 | $33B |
|
||
Price history
+858.3% since first listed4 events — show timeline
- 2026-05-02 Pending — MLSNOW
- 2026-04-30 Listed $115,000 MLSNOW
- 2004-05-07 Sold (Public Records) $63,000 Public Records
- 1989-07-25 Sold (Public Records) $12,000 Public Records
Property tax history
+1.9%/yrLatest (2025): $1,647 · +0.5% YoY. Source: county tax records.
Cash-flow waterfall
monthlySold comps — $/sqft
last 12 mo · ≤1 miLoading sold comps…