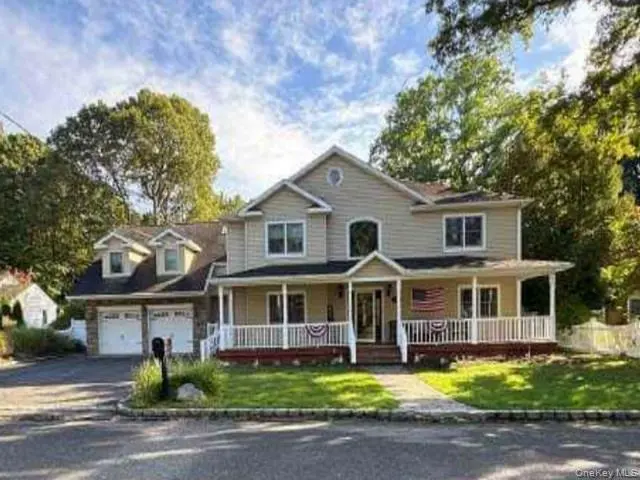
96 Bellecrest Ave · East Northport, NY
Flood risk 6/10 · Moderate
- FEMA flood zone
- X (unshaded)
- Chance of flooding over 30 yrs
- 0.74%
- Est. flood insurance / yr
- $473 – $860
Fire risk 1/10 · Minimal
- Est. fire insurance / yr
- $691 – $1,283
Heat risk 5/10 · Moderate
- Hot days now (above 98°F)
- 7 days/yr
- Hot days in 30 yrs
- 15 days/yr
Wind risk 8/10 · Major
- Chance of severe wind over 30 yrs
- 80.0%
Air-quality risk 4/10 · Minor
- Unhealthy air days now
- 4 days/yr
- Unhealthy air days in 30 yrs
- 5 days/yr
Risk factors via First Street. Map © Google.
Why this score? — see what drove the D- grade
The composite is a weighted blend of 9 inputs, each scored 0–100. Each bar is that input's sub-score; the figure is the points it added to the 100-point composite (weight × sub-score).
- ARV discount +12.9/15.0
- Cash flow +7.0/30.0
- Schools +6.4/10.0
- Livability +3.9/5.0
- 1% rule +2.7/10.0
- Rent growth +2.5/5.0
- Condition / age +2.5/5.0
- DSCR +1.2/10.0
- Appreciation +0.0/10.0
$930,000
🖨 Deal sheet 📄 Offer letter ✓ Due diligence
Listing remarks MLS
Looking for a great opportunity? Look no more! This property has tons of potential and is average in living space size for the neighborhood. It is located close to main roads with easy access to local amenities, such as shopping, banking, schools, and various eateries. Per our APPRAISAL describe the property as a SFR (COLONIAL) built in 2003. It has a GLA of approx. 3339 and has 5 bedrooms and 3baths, NO basement and Built-In 2 Garage. The property is on 21780 sq ft lot *** Seller cannot guarantee access at any given time. Offers may be made sight unseen.
Key facts
- Close to main roads
- 0.5 acre lot
- 2 garage spots
Tags
Neighborhood map
What this means for you Summary
Snapshot
- This is a 5-bed/3.0-bath single-family listed at $930k.
Deal economics
- At list price, monthly cash flow is $-1k ($-16k/yr) — negative.
- To cash-flow at today's rent, offer at most $687k (26.1% below list).
- To meet the 1% rule (rent ≥ 1% of price), the offer needs to be $720k (22.6% below list).
- Recommended offer: $687k (26.1% below list) — sets the bar for cash-flow.
- Cap rate 4.5% vs local median 3.2% in East Northport — top-decile yield for the area; either an underpriced asset or a hidden risk that comps aren't pricing in. Stress-test before assuming the spread holds.
Location & tenants
- Location reads 77/100 on livability (#208 in NY, #3,199 nationally) — a middle-class / working-renter tenant base. Strengths: commute A+, employment A+, housing A+; Watch: amenities F, cost of living F.
- Northport-East Northport Union Free School District (suburban): math 74% / reading 65% proficiency, ranked #101 of 590 in NY (top 17%) — acceptable for families but not a draw, mixed tenant base, ~2y average lease; only 7% free/reduced lunch — higher-income household profile.
- Market conditions: 122 active listings in the ZIP; 1 comparable units currently listed for rent nearby; 1,366 units permitted in Suffolk County in 2024 (216 in 5+ unit buildings).
Forward outlook
- Local home prices are declining (-3.0%/yr); year-one equity from $6k of loan paydown is wiped out by about $28k of value loss. Plan a longer hold.
- Suffolk County population projected to shrink 5% by 2050 — rents likely to lag national; underwrite the cash flow, not the appreciation.
Negotiation context
- It's been on market 268 days — a 12% lower offer ($818k) is reasonable based on typical stale-listing flexibility.
- 4 sale attempts since 3y ago; this cycle's ask has dropped $183k (16%) from the opening price — seller is motivated, your offer sets the floor, not the list.
- Current owner paid $325k; list at $930k implies a 186% gain — meaningful room to come down on a strong offer.
Risks & watch-outs
- Climate carrying-cost: major flood risk; severe wind risk, 80% chance of damaging wind over 30y; extreme-heat days projected 7→15/yr by 2055 (HVAC capex compounding) — expect insurance premiums to compound above CPI over the hold.
Questions for the listing agent
- What do current leases actually rent for vs. the listed asking? Can we see a recent rent roll and the last 12 months of T-12 income?
- It's been on market 268 days. Have you received any prior offers? Is the seller open to a 26% concession, seller financing, or rate buy-down credit?
- Why hasn't it sold? Are there any deal-killer items the seller is aware of (foundation, flood, title, zoning, code violations)?
- Is there a deadline driving the sale (1031 exchange, divorce, estate, relocation)? That informs how much negotiation room exists.
- Schools are A-rated — typically a magnet for longer-tenancy family renters. What's the average tenant stay here, and is there a school-zone premium baked into asking?
- The area grade is low — what's the realistic commute time and amenity access for the typical tenant pool here? Any planned neighborhood developments (good or bad) we should know about?
- What's the average days-on-market for RENTAL listings here right now (not sales)? A rising rental-DOM trend means longer vacancies and softer asking-rent achievability than the comps imply.
- What's the recent tenant-quality profile in this submarket — average credit score on applications, eviction rate, late-payment / NSF rate, and stable-employment percentage? A property-management company in the area should have these aggregated.
- How much new for-sale + rental construction is in the pipeline within 1–3 miles? Heavy new supply typically softens prices + rents 12–24 months out; constrained supply supports both.
Investment metrics
- 1% rule
- 0.77% ✗
- Cap rate
- 4.52%
- Cash-on-cash
- -6.33%
- DSCR
- 0.72
- GRM
- 10.8
CMA / ARV
- ARV (median comp)
- $1,056,645
- List price
- $930,000
- Delta
- -11.99%
- Verdict
- UNDERPRICED
- Comps
- 18 within 1.0 mi
Show comp detail 2 sales within ~0.75 mi
| Address | Dist | Beds/Ba | Sqft | Sold | Price | $/sf | Match |
|---|---|---|---|---|---|---|---|
| 101A Norton Dr | 0.16mi | 5/3.0 | 3,273 (-2%) | 12mo | $920,000 | $281 | 79 |
| 1293 Pulaski Rd | 0.61mi | 4/2.5 (-1) | 3,000 (-10%) | 3mo | $820,000 | $273 | 45 |
Match score weights: distance 35% · size 25% · config 20% · recency 20%. Top-matched comps best support the ARV.
Projected returns pro-forma
-3.0% appreciation · 3.0% rent growth · sell at horizon
- IRR
- -27.1%
- Equity multiple
- 0.09×
- Total profit
- $-237,651
- Equity at exit
- $138,666
- IRR
- -24.7%
- Equity multiple
- -0.22×
- Total profit
- $-317,524
- Equity at exit
- $80,409
Cash invested: $260,400 (down + closing). Projections, not guarantees.
Landlord ↔ Tenant lean methodology
- Overall (STATE)
- 15 Strongly Tenant-Friendly
- State New York
- 15 Strongly Tenant-Friendly · D+10
- County
- — inherits STATE
- City
- — inherits STATE
ZIP-level market 11731
- Active inventory
- 122
- Price-to-rent
- 10.8×
Monthly cashflow live
- Estimated rent
- $7,200 medium interval (Pro) →
- Mortgage (P&I)
- −$4,877
- Tax from tax record
- −$1,797 /mo · $21,558/yr
- Insurance
- −$388
- HOA
- −$0
- Vacancy / Maint / Mgmt
- −$1,512
- Net cashflow
- $-1,373
Break-even live
UW: 25.0% down · 7.5% · 30yr · 1.5% tax · 5.0% vac · 8.0% maint · 8.0% mgmt
Financing live
Cash to close
- Down payment
- $232,500
- Closing costs
- $27,900
- Reserves months
- —
- Total cash needed
- —
Loan-product check · same deal, 3 products live
Conventional
25% down · 7.5% · 30yr
- Down + closing
- —
- Monthly P&I
- —
- Monthly cashflow
- —
- DSCR
- —
- Eligible?
- —
Personal DTI + credit; lowest rate.
DSCR
20% down · 8.5% · 30yr
- Down + closing
- —
- Monthly P&I
- —
- Monthly cashflow
- —
- DSCR
- —
- Eligible?
- —
No personal income docs; deal must DSCR.
Hard money
10% down · 12.0% · 12mo
- Down + closing
- —
- Monthly P&I
- —
- Monthly cashflow
- —
- DSCR
- —
- Eligible?
- —
Short-term bridge; refi at stabilization.
Rent comps 1 comps
| Address | Beds | Baths | Sqft | Rent | $/sqft | DOM | Units | Dist |
|---|---|---|---|---|---|---|---|---|
| 24 Wilafra Pl Northport, NY | 5.0 | 2.5 | 3600 | $7,200 | $2.00 | 43d | 1 | 1.11mi |
Listing history 29 events
-
2026-06-18days on market $930,000 Active 268 DOM
-
2026-06-17days on market $930,000 Active 267 DOM
-
2026-06-16days on market $930,000 Active 266 DOM
-
2026-06-15days on market $930,000 Active 265 DOM
-
2026-06-13days on market $930,000 Active 263 DOM
-
2026-06-12days on market $930,000 Active 262 DOM
-
2026-06-09days on market $930,000 Active 259 DOM
-
2026-06-08days on market $930,000 Active 258 DOM
-
2026-06-07days on market $930,000 Active 257 DOM
-
2026-06-05days on market $930,000 Active 255 DOM
-
2026-06-04days on market $930,000 Active 253 DOM
-
2026-06-02days on market $930,000 Active 252 DOM
-
2026-06-01days on market $930,000 Active 251 DOM
-
2026-05-31days on market $930,000 Active 250 DOM
-
2026-04-20price $930,000 561-char remark
Show marketing remark (561 chars)
Looking for a great opportunity? Look no more! This property has tons of potential and is average in living space size for the neighborhood. It is located close to main roads with easy access to local amenities, such as shopping, banking, schools, and various eateries. Per our APPRAISAL describe the property as a SFR (COLONIAL) built in 2003. It has a GLA of approx. 3339 and has 5 bedrooms and 3baths, NO basement and Built-In 2 Garage. The property is on 21780 sq ft lot *** Seller cannot guarantee access at any given time. Offers may be made sight unseen.
-
2026-03-18price $960,000 561-char remark
Show marketing remark (561 chars)
Looking for a great opportunity? Look no more! This property has tons of potential and is average in living space size for the neighborhood. It is located close to main roads with easy access to local amenities, such as shopping, banking, schools, and various eateries. Per our APPRAISAL describe the property as a SFR (COLONIAL) built in 2003. It has a GLA of approx. 3339 and has 5 bedrooms and 3baths, NO basement and Built-In 2 Garage. The property is on 21780 sq ft lot *** Seller cannot guarantee access at any given time. Offers may be made sight unseen.
-
2025-12-01price $1,004,600 561-char remark
Show marketing remark (561 chars)
Looking for a great opportunity? Look no more! This property has tons of potential and is average in living space size for the neighborhood. It is located close to main roads with easy access to local amenities, such as shopping, banking, schools, and various eateries. Per our APPRAISAL describe the property as a SFR (COLONIAL) built in 2003. It has a GLA of approx. 3339 and has 5 bedrooms and 3baths, NO basement and Built-In 2 Garage. The property is on 21780 sq ft lot *** Seller cannot guarantee access at any given time. Offers may be made sight unseen.
-
2025-10-27price $1,057,400 561-char remark
Show marketing remark (561 chars)
Looking for a great opportunity? Look no more! This property has tons of potential and is average in living space size for the neighborhood. It is located close to main roads with easy access to local amenities, such as shopping, banking, schools, and various eateries. Per our APPRAISAL describe the property as a SFR (COLONIAL) built in 2003. It has a GLA of approx. 3339 and has 5 bedrooms and 3baths, NO basement and Built-In 2 Garage. The property is on 21780 sq ft lot *** Seller cannot guarantee access at any given time. Offers may be made sight unseen.
-
2025-09-23$1,113,000 Active 561-char remark
Show marketing remark (561 chars)
Looking for a great opportunity? Look no more! This property has tons of potential and is average in living space size for the neighborhood. It is located close to main roads with easy access to local amenities, such as shopping, banking, schools, and various eateries. Per our APPRAISAL describe the property as a SFR (COLONIAL) built in 2003. It has a GLA of approx. 3339 and has 5 bedrooms and 3baths, NO basement and Built-In 2 Garage. The property is on 21780 sq ft lot *** Seller cannot guarantee access at any given time. Offers may be made sight unseen.
-
2024-02-29status Active
-
2023-12-18historical
-
2023-12-07price $1,199,999
-
2023-08-09price $1,350,000
-
2023-06-12$1,500,000 Active
-
2023-06-06historical
-
2023-06-06$1,199,999 Active
-
2002-12-11soldstatus $325,000
-
1998-02-05soldstatus $195,000
-
1988-08-02soldstatus $165,000
ⓘ Source: listings_history table (triggers on properties + properties_extension) + one-shot
backfill from property_details.listing_events for pre-trigger history.
Tax reassessment forecast NY · Partial reset (capped growth)
- Current annual tax
- $21,558 · $1,797/mo
- Projected year-2 tax
- $21,558 · $1,797/mo
- Expected delta
- $0/yr ($0/mo · 0.0%)
ⓘ Screening estimate from a state-policy table — verify with the county assessor before closing.
Climate risk First Street
- Flood 6/10 Major FEMA zone X (unshaded) · 74% chance over 30 yrs
- Wildfire 1/10 Low
- Heat 5/10 Major 7 d/yr ≥98°F today · 15 d/yr by 30 yrs out
- Wind 8/10 Severe 80% chance of damaging wind over 30 yrs
- Air quality 4/10 Moderate 4 unhealthy d/yr today · 5 by 30 yrs out
Nearby sold comps map
Loading sold comps map…
Walkable amenities ~0.75 mi
Loading nearby amenities…
Taxation est. · year 1
- Rental income
- $86,400
- − Mortgage interest
- −$52,094
- − Property taxes
- −$21,558
- − Insurance
- −$4,650
- − Repairs & maintenance
- −$6,912
- − Management
- −$6,912
- − Depreciation
- −$27,055
- Taxable loss
- −$32,781
- Est. tax savings @ 24.0%
- +$7,867
- After-tax cash flow
- $-8,609/yr
For passive investors: Depreciation is non-cash, so a rental often shows a tax loss while cash-flowing — sheltering income. Rental losses are passive: they offset passive income freely, and up to $25,000/yr can offset ordinary (W-2) income if you actively participate and your MAGI is under $100k (phasing out to $0 by $150k); unused losses carry forward. On sale, claimed depreciation is recaptured at up to 25%, and gains may owe capital-gains tax (a 1031 exchange can defer both). Figures are a year-1 estimate at your 24.0% rate — not tax advice; consult a CPA.
Schools (NCES district)
- District
- Northport-East Northport Union Free School District
- NCES district ID
- 3621270
- Math proficiency
- 74% ▼ -7.00%
- Reading proficiency
- 65% ▼ -5.00%
- Median HH income
- $104,656
- Composite
- 64.22/100
- National rank
- #563
- State rank
- #101 of 590 in NY
Livability — East Northport
- Score
- 77/100
- State rank
- #208
- US rank
- #3199
Category grades
Schools grade is shown separately in the Schools card above.
Census & demographics
- Census place
- East Northport, NY
- Population (ZIP)
- 29,891
Population outlook (Suffolk County) Hauer SSP2
- Today (2025)
- 1,505,262 people
- By 2030
- 1,498,318 · -0.5%
- By 2040
- 1,471,101 · -2.3%
- By 2050
- 1,424,848 · -5.3%
- By 2075
- 1,337,157 · -11.2%
- By 2100
- 1,217,720 · -19.1%
Race, ethnicity, and origin ACS 2023
- Neighborhood character
- Predominantly White (82%)
- Race & ethnicity
- White 82% Hispanic / Latino 8% Two or more races 8% Asian 4% Black 2%
- Hispanic origin (detail)
- Puerto Rican 2%
- Common ancestry
- Romanian 5% Scotch-Irish 3% Lithuanian 2%
- Foreign-born
- 9% · Canada, South Korea, China
- Languages at home
- 89% English-only · Spanish 5% Other Indo-European 2% German/W. Germanic 1%
Political lean MEDSL · Suffolk
- 2024 margin
- Lean R (+10.0) · D 45.0% · R 55.0%
- 2008→2024 swing
- -16.0pp toward R · 2008: 6.0pp · 2024: -10.0pp
- All cycles
- 2024: R+10.0 2020: R+0.0 2016: R+8.2 2012: D+2.9 2008: D+6.0
Not yet ingested
- Civics
- —
Market trends
- HPI YoY
- ▼ -580.05%
- Current HPI
- 308.0634
- Rent YoY
- —
- Metro
- —
- State GDP YoY
- ▲ 2.60%
- F500 in state
- 92
Industry mix (Fortune 500 HQ in NY)
| Industry | F500 HQs | Revenue |
|---|---|---|
| Financial Services | 10 | $950B |
|
||
| Consumer Goods | 9 | $162B |
|
||
| Insurance | 4 | $225B |
|
||
| Telecommunications | 2 | $144B |
|
||
| Pharmaceuticals | 2 | $112B |
|
||
| Media / Entertainment | 2 | $69B |
|
||
Price history
+463.6% since first listed15 events — show timeline
- 2026-04-20 Price Changed $930,000 OneKey® MLS as Distributed by MLS Grid
- 2026-03-18 Price Changed $960,000 OneKey® MLS as Distributed by MLS Grid
- 2025-12-01 Price Changed $1,004,600 OneKey® MLS as Distributed by MLS Grid
- 2025-10-27 Price Changed $1,057,400 OneKey® MLS as Distributed by MLS Grid
- 2025-09-23 Listed $1,113,000 OneKey® MLS as Distributed by MLS Grid
- 2024-02-29 Relisted — OneKey® MLS as Distributed by MLS Grid
- 2023-12-18 Listing Removed — OneKey® MLS as Distributed by MLS Grid
- 2023-12-07 Price Changed $1,199,999 OneKey® MLS as Distributed by MLS Grid
- 2023-08-09 Price Changed $1,350,000 OneKey® MLS as Distributed by MLS Grid
- 2023-06-12 Listed $1,500,000 OneKey® MLS as Distributed by MLS Grid
- 2023-06-06 Coming Soon — OneKey® MLS as Distributed by MLS Grid
- 2023-06-06 Listed $1,199,999 OneKey® MLS as Distributed by MLS Grid
- 2002-12-11 Sold (Public Records) $325,000 Public Records
- 1998-02-05 Sold (Public Records) $195,000 Public Records
- 1988-08-02 Sold (Public Records) $165,000 Public Records
Property tax history
+11.3%/yrLatest (2025): $21,558 · +0.0% YoY. Source: county tax records.
Cash-flow waterfall
monthlySold comps — $/sqft
last 12 mo · ≤1 miLoading sold comps…