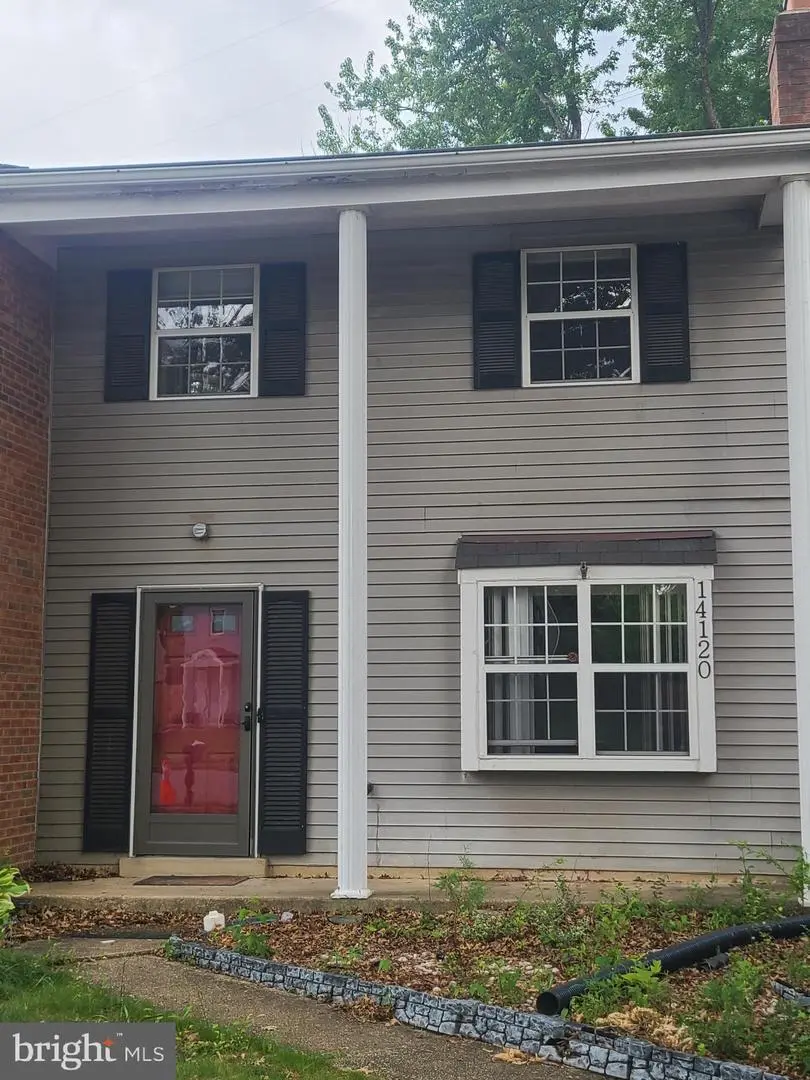
14120 Morrison Ct · Dale City, VA
Flood risk 1/10 · Minimal
- FEMA flood zone
- X (unshaded)
- Chance of flooding over 30 yrs
- 0.0%
- Est. flood insurance / yr
- $507 – $1,088
Fire risk 1/10 · Minimal
- Est. fire insurance / yr
- $666 – $1,236
Heat risk 7/10 · Major
- Hot days now (above 103°F)
- 7 days/yr
- Hot days in 30 yrs
- 16 days/yr
Wind risk 4/10 · Minor
- Chance of severe wind over 30 yrs
- 17.0%
Air-quality risk 2/10 · Minimal
- Unhealthy air days now
- 2 days/yr
- Unhealthy air days in 30 yrs
- 2 days/yr
Risk factors via First Street. Map © Google.
Why this score? — see what drove the D grade
The composite is a weighted blend of 9 inputs, each scored 0–100. Each bar is that input's sub-score; the figure is the points it added to the 100-point composite (weight × sub-score).
- ARV discount +11.3/15.0
- Cash flow +9.0/30.0
- Schools +5.8/10.0
- Livability +4.0/5.0
- Rent growth +3.0/5.0
- DSCR +2.5/10.0
- Condition / age +2.5/5.0
- 1% rule +2.4/10.0
- Appreciation +0.0/10.0
$320,000
🖨 Deal sheet 📄 Offer letter ✓ Due diligence
Listing remarks
* * * HIGHEST AND BEST OFFERS DUE BY NOON SATURDAY 6/13 * * * Back on the Market – Price Reduced! Investor Special – Sold “As-Is” This property offers a fantastic opportunity for buyers looking to renovate, customize, or add value. While the home requires some TLC and updates, it has strong potential for the right buyer. Please note, the seller will make no repairs. Don’t miss out on this chance to create your dream investment!
Key facts
- Built 1984
- Listed 13 days
Property features AI
Exterior
- Parking: Driveway
- Utilities: Public water; Public sewer; Electric service
- Home design: Semi-detached home; Single-entry level layout
- Construction: Vinyl siding exterior; Slab foundation; Built year per assessor
- Exterior features: Driveway parking; No tidal water on the property
Interior
- Bedrooms: Three bedrooms on the first upper level
- Bathrooms: One full bathroom (upper level); One half bathroom on the main level
- Heating & cooling: Heat pump heating (electric); Central air conditioning (electric); Electric hot water
- Interior features: Has one fireplace
Neighborhood map
What this means for you Summary
Snapshot
- This is a 3-bed/1.5-bath townhouse listed at $320k.
Deal economics
- At list price, monthly cash flow is $-249 ($-3k/yr) — negative.
- To cash-flow at today's rent, offer at most $276k (13.7% below list).
- To meet the 1% rule (rent ≥ 1% of price), the offer needs to be $237k (25.8% below list).
- Recommended offer: $237k (25.8% below list) — sets the bar for 1% rule.
- Cap rate 5.4% vs local median 3.3% in Dale City — top-decile yield for the area; either an underpriced asset or a hidden risk that comps aren't pricing in. Stress-test before assuming the spread holds.
Location & tenants
- Location reads 81/100 on livability (#55 in VA, #1,493 nationally) — a professional / high-income tenant draw. Strengths: employment A+, housing A+, health & safety A+; Watch: amenities D, cost of living D-.
- Prince William County Public School District (suburban): math 54% / reading 72% proficiency, ranked #30 of 131 in VA (top 23%) — acceptable for families but not a draw, mixed tenant base, ~2y average lease.
- Market conditions: Rents rising (+2.0%/yr); 297 active listings in the ZIP; 11 comparable units currently listed for rent nearby; rentals at typical pace (median 21d on market — plan ~3-4 weeks tenant-placement turnaround); high-income renter base; 1,418 units permitted in Prince William County in 2024 (625 in 5+ unit buildings).
Forward outlook
- Local home prices are declining (-3.0%/yr); year-one equity from $2k of loan paydown is wiped out by about $10k of value loss. Plan a longer hold.
- Prince William County population projected at +37% by 2050 — long-run rental-demand tailwind backs the buy-and-hold thesis.
Negotiation context
- Only 13 days on market — expect competitive offers; lowballing is unlikely to land.
- 4 sale attempts since 23y ago; this cycle's ask has dropped $25k (7%) from the opening price — seller is motivated, your offer sets the floor, not the list.
- Current owner paid $147k; list at $320k implies a 118% gain — meaningful room to come down on a strong offer.
Risks & watch-outs
- Climate carrying-cost: extreme-heat days projected 7→16/yr by 2055 (HVAC capex compounding) — expect insurance premiums to compound above CPI over the hold.
Questions for the listing agent
- What do current leases actually rent for vs. the listed asking? Can we see a recent rent roll and the last 12 months of T-12 income?
- Is there a deadline driving the sale (1031 exchange, divorce, estate, relocation)? That informs how much negotiation room exists.
- Schools are B-rated — typically a magnet for longer-tenancy family renters. What's the average tenant stay here, and is there a school-zone premium baked into asking?
- The area grade is low — what's the realistic commute time and amenity access for the typical tenant pool here? Any planned neighborhood developments (good or bad) we should know about?
- What's the average days-on-market for RENTAL listings here right now (not sales)? A rising rental-DOM trend means longer vacancies and softer asking-rent achievability than the comps imply.
- What's the recent tenant-quality profile in this submarket — average credit score on applications, eviction rate, late-payment / NSF rate, and stable-employment percentage? A property-management company in the area should have these aggregated.
- How much new for-sale + rental construction is in the pipeline within 1–3 miles? Heavy new supply typically softens prices + rents 12–24 months out; constrained supply supports both.
Investment metrics
- 1% rule
- 0.74% ✗
- Cap rate
- 5.36%
- Cash-on-cash
- -3.33%
- DSCR
- 0.85
- GRM
- 11.2
CMA / ARV
- ARV (median comp)
- $349,435
- List price
- $320,000
- Delta
- -8.42%
- Verdict
- FAIR
- Comps
- 20 within 1.0 mi
Show comp detail 5 sales within ~0.75 mi
| Address | Dist | Beds/Ba | Sqft | Sold | Price | $/sf | Match |
|---|---|---|---|---|---|---|---|
| 14106 Morrison Ct | 0.05mi | 3/2.5 | 1,386 (+0%) | 9mo | $400,000 | $289 | 86 |
| 14125 Morrison Ct | 0.04mi | 3/2.5 | 1,368 (-1%) | 17mo | $415,000 | $303 | 79 |
| 5274 Miles Ct | 0.13mi | 3/2.5 | 1,368 (-1%) | 21mo | $425,000 | $311 | 71 |
| 14212 Savannah Dr | 0.65mi | 3/2.5 | 1,380 (0%) | 1mo | $436,000 | $316 | 64 |
| 4730 Still Pl | 0.71mi | 3/1.5 | 1,216 (-12%) | 11mo | $415,000 | $341 | 38 |
Match score weights: distance 35% · size 25% · config 20% · recency 20%. Top-matched comps best support the ARV.
Projected returns pro-forma
-3.0% appreciation · 2.01% rent growth · sell at horizon
- IRR
- -23.0%
- Equity multiple
- 0.22×
- Total profit
- $-70,073
- Equity at exit
- $47,713
- IRR
- -20.1%
- Equity multiple
- -0.01×
- Total profit
- $-90,931
- Equity at exit
- $27,668
Cash invested: $89,600 (down + closing). Projections, not guarantees.
Landlord ↔ Tenant lean methodology
- Overall (STATE)
- 55 Moderately Landlord-Leaning
- State Virginia
- 55 Moderately Landlord-Leaning · D+2
- County
- — inherits STATE
- City
- — inherits STATE
ZIP-level market 22193
- Rents YoY
- 2.0%
- Active inventory
- 297
- Price-to-rent
- 11.2×
Monthly cashflow live
- Estimated rent
- $2,374 high interval (Pro) →
- Mortgage (P&I)
- −$1,678
- Tax from tax record
- −$313 /mo · $3,755/yr
- Insurance
- −$133
- HOA
- −$0
- Vacancy / Maint / Mgmt
- −$499
- Net cashflow
- $-249
Break-even live
UW: 25.0% down · 7.5% · 30yr · 1.5% tax · 5.0% vac · 8.0% maint · 8.0% mgmt
Financing live
Cash to close
- Down payment
- $80,000
- Closing costs
- $9,600
- Reserves months
- —
- Total cash needed
- —
Loan-product check · same deal, 3 products live
Conventional
25% down · 7.5% · 30yr
- Down + closing
- —
- Monthly P&I
- —
- Monthly cashflow
- —
- DSCR
- —
- Eligible?
- —
Personal DTI + credit; lowest rate.
DSCR
20% down · 8.5% · 30yr
- Down + closing
- —
- Monthly P&I
- —
- Monthly cashflow
- —
- DSCR
- —
- Eligible?
- —
No personal income docs; deal must DSCR.
Hard money
10% down · 12.0% · 12mo
- Down + closing
- —
- Monthly P&I
- —
- Monthly cashflow
- —
- DSCR
- —
- Eligible?
- —
Short-term bridge; refi at stabilization.
Rent comps 11 comps
| Address | Beds | Baths | Sqft | Rent | $/sqft | DOM | Units | Dist |
|---|---|---|---|---|---|---|---|---|
| 13860 Langstone Dr Woodbridge, VA | 3.0 | 2.5 | 1466 | $2,100 | $1.43 | 44d | 1 | 0.44mi |
| 4735 Still Pl Woodbridge, VA | 3.0 | 1.5 | 1120 | $2,450 | $2.19 | 5d | 1 | 0.77mi |
| 4703 Still Pl Woodbridge, VA | 3.0 | 1.5 | 1132 | $2,200 | $1.94 | 24d | 1 | 0.82mi |
| 4686 Hercules Ln Woodbridge, VA | 3.0 | 1.5 | 1132 | $2,092 | $1.85 | 24d | 1 | 0.85mi |
| 4686 Hercules Ln Woodbridge, VA | 3.0 | 1.5 | 1132 | $2,092 | $1.85 | 19d | 1 | 0.85mi |
| 4681 Whitely Ct Woodbridge, VA | 3.0 | 1.5 | 1120 | $2,495 | $2.23 | 24d | 1 | 0.86mi |
| 4617 Whitaker Pl Woodbridge, VA | 3.0 | 1.5 | 1292 | $2,100 | $1.63 | 20d | 1 | 0.94mi |
| 5678 Sutter Ln Woodbridge, VA | 3.0 | 2.5 | 1408 | $2,500 | $1.78 | 17d | 1 | 1.02mi |
| 4806 Dane Ridge Cir Woodbridge, VA | 3.0 | 2.5 | 1614 | $3,200 | $1.98 | 44d | 1 | 1.10mi |
| 14397 Westminister Ln Dale City, VA | 1.0–2.0 | 1.0–2.0 | 859 | $2,278 | $2.65 | 1d | 13 | 1.22mi |
| 14321 Wrangler Ln Dale City, VA | 2.0 | 1.0–2.0 | 740 | $1,956 | $2.64 | 1d | 66 | 1.33mi |
Listing history 12 events
-
2026-06-15statusdays on market $320,000 Pending 13 DOM
-
2026-06-13remarks 439-char remark
-
2026-06-13pricestatusdays on market $320,000 Active 12 DOM
-
2026-05-18$345,000 Active 409-char remark
-
2026-05-17price $345,000 409-char remark
-
2026-05-08historical $355,000 409-char remark
-
2003-05-10soldstatus $147,000
-
2003-05-05soldstatus $147,000
-
2003-03-19historical
-
2003-01-21$144,900
-
1987-09-01soldstatus $74,782
-
1985-08-01soldstatus $68,750
ⓘ Source: listings_history table (triggers on properties + properties_extension) + one-shot
backfill from property_details.listing_events for pre-trigger history.
Tax reassessment forecast VA · Resets to sale price
- Current annual tax
- $3,755 · $313/mo
- Projected year-2 tax
- $3,755 · $313/mo
- Expected delta
- $0/yr ($0/mo · 0.0%)
ⓘ Screening estimate from a state-policy table — verify with the county assessor before closing.
Climate risk First Street
- Flood 1/10 Low FEMA zone X (unshaded) · 0% chance over 30 yrs
- Wildfire 1/10 Low
- Heat 7/10 Severe 7 d/yr ≥103°F today · 16 d/yr by 30 yrs out
- Wind 4/10 Moderate 17% chance of damaging wind over 30 yrs
- Air quality 2/10 Low 2 unhealthy d/yr today · 2 by 30 yrs out
Nearby sold comps map
Loading sold comps map…
Walkable amenities ~0.75 mi
Loading nearby amenities…
Taxation est. · year 1
- Rental income
- $28,487
- − Mortgage interest
- −$17,925
- − Property taxes
- −$3,755
- − Insurance
- −$1,600
- − Repairs & maintenance
- −$2,279
- − Management
- −$2,279
- − Depreciation
- −$9,309
- Taxable loss
- −$8,660
- Est. tax savings @ 24.0%
- +$2,079
- After-tax cash flow
- $-910/yr
For passive investors: Depreciation is non-cash, so a rental often shows a tax loss while cash-flowing — sheltering income. Rental losses are passive: they offset passive income freely, and up to $25,000/yr can offset ordinary (W-2) income if you actively participate and your MAGI is under $100k (phasing out to $0 by $150k); unused losses carry forward. On sale, claimed depreciation is recaptured at up to 25%, and gains may owe capital-gains tax (a 1031 exchange can defer both). Figures are a year-1 estimate at your 24.0% rate — not tax advice; consult a CPA.
Schools (NCES district)
- District
- Prince William County Public School District
- NCES district ID
- 5103130
- Math proficiency
- 54% ▼ -28.00%
- Reading proficiency
- 72% ▼ -7.00%
- Median HH income
- $96,347
- Composite
- 57.92/100
- National rank
- #1041
- State rank
- #30 of 131 in VA
Livability — Dale City
- Score
- 81/100
- State rank
- #55
- US rank
- #1493
Category grades
Schools grade is shown separately in the Schools card above.
Census & demographics
- Census place
- Dale City, VA
- County
- Prince William County · 452,627 people
- City population
- 83,798
- Metro
- Washington-Arlington-Alexandria, DC-VA-MD-WV
- Population (ZIP)
- 81,588
- Household income
- $117,337
- Rent vs Own
- Severe rent burden
- 1063.0
Population outlook (Prince William County) Hauer SSP2
- Today (2025)
- 539,759 people
- By 2030
- 582,629 · +7.9%
- By 2040
- 665,916 · +23.4%
- By 2050
- 740,796 · +37.2%
- By 2075
- 900,980 · +66.9%
- By 2100
- 985,833 · +82.6%
Race, ethnicity, and origin ACS 2023
- Neighborhood character
- Highly diverse neighborhood (Simpson 0.76)
- Race & ethnicity
- Hispanic / Latino 34% White 25% Black 23% Two or more races 16% Asian 12% Native American 1%
- Hispanic origin (detail)
- Mexican 5% Puerto Rican 2%
- Common ancestry
- Lithuanian 1% Romanian 1% Italian 1%
- Foreign-born
- 31% · Canada, South Korea, Vietnam
- Languages at home
- 55% English-only · Spanish 28% Other Indo-European 6% Tagalog/Filipino 1%
Political lean MEDSL · Prince William
- 2024 margin
- D (+18.0) · D 57.6% · R 39.6% · Other 2.8%
- 2008→2024 swing
- +2.1pp toward D · 2008: 15.9pp · 2024: 18.0pp
- All cycles
- 2024: D+18.0 2020: D+27.0 2016: D+20.0 2012: D+16.0 2008: D+15.9
Not yet ingested
- Civics
- —
Market trends
- HPI YoY
- ▼ -367.48%
- Current HPI
- 316.2958
- Rent YoY
- ▲ 2.01%
- Metro
- Washington-Arlington-Alexandria, DC-VA-MD-WV
- State GDP YoY
- ▲ 2.40%
- F500 in state
- 50
Industry mix (Fortune 500 HQ in VA)
| Industry | F500 HQs | Revenue |
|---|---|---|
| Aerospace / Defense | 4 | $236B |
|
||
| Technology / Defense | 3 | $32B |
|
||
| Financial Services | 2 | $176B |
|
||
| Utilities | 2 | $27B |
|
||
| Insurance | 2 | $25B |
|
||
| Technology | 2 | $15B |
|
||
Price history
+365.5% since first listed17 events — show timeline
- 2026-06-14 Pending — BRIGHT MLS
- 2026-06-14 Listing Removed — BRIGHT MLS
- 2026-06-11 Price Changed $320,000 BRIGHT MLS
- 2026-06-11 Relisted — BRIGHT MLS
- 2026-06-03 Relisted — BRIGHT MLS
- 2026-05-29 Listing Removed — BRIGHT MLS
- 2026-05-26 Contingent — BRIGHT MLS
- 2026-05-22 Price Changed $330,000 BRIGHT MLS
- 2026-05-18 Listed $345,000 BRIGHT MLS
- 2026-05-17 Price Changed $345,000 BRIGHT MLS
- 2026-05-08 Coming Soon $355,000 BRIGHT MLS
- 2003-05-10 Sold (MLS) $147,000 MRIS
- 2003-05-05 Sold (Public Records) $147,000 Public Records
- 2003-03-19 Delisted — MRIS
- 2003-01-21 Listed $144,900 MRIS
- 1987-09-01 Sold (Public Records) $74,782 Public Records
- 1985-08-01 Sold (Public Records) $68,750 Public Records
Property tax history
+3.1%/yrLatest (2025): $3,755 · +6.9% YoY. Source: county tax records.
Cash-flow waterfall
monthlySold comps — $/sqft
last 12 mo · ≤1 miLoading sold comps…