3235 E Valley Rd · Keuka Park, NY
Flood risk 10/10 · Severe
- FEMA flood zone
- X
- Chance of flooding over 30 yrs
- 0.99%
- Est. flood insurance / yr
- $507 – $1,088
Fire risk 3/10 · Minor
- Est. fire insurance / yr
- $691 – $1,283
Heat risk 2/10 · Minimal
- Hot days now (above 94°F)
- 7 days/yr
- Hot days in 30 yrs
- 16 days/yr
Wind risk 1/10 · Minimal
- Chance of severe wind over 30 yrs
- —
Air-quality risk 1/10 · Minimal
- Unhealthy air days now
- 0 days/yr
- Unhealthy air days in 30 yrs
- 0 days/yr
Risk factors via First Street. Map © Google.
Why this score? — see what drove the D+ grade
The composite is a weighted blend of 9 inputs, each scored 0–100. Each bar is that input's sub-score; the figure is the points it added to the 100-point composite (weight × sub-score).
- Appreciation +10.0/10.0
- Cash flow +9.0/30.0
- ARV discount +7.5/15.0
- Schools +5.0/10.0
- Livability +3.3/5.0
- 1% rule +2.8/10.0
- DSCR +2.5/10.0
- Rent growth +2.5/5.0
- Condition / age +2.5/5.0
$129,900
🖨 Deal sheet (PDF) 📄 Offer letter ✓ Due diligence
Listing remarks
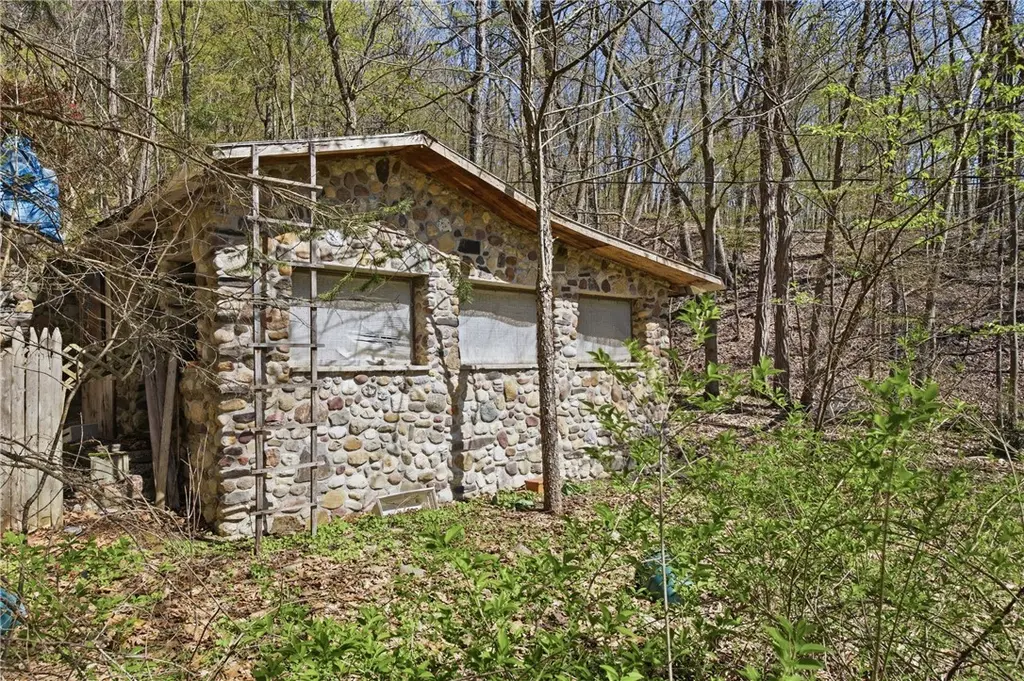
LOCATION. .LOCATION. .LOCATION! This beautiful 2+ acre parcel with a 1980's seasonal stone cottage complete with wood burning fireplace nestled along side a babbling brook is straight out of a fairy tale! Just needs your sweat equity to really take it to the next level of "WOW"! Minutes to KEUKA LAKE and the shores/camping of Keuka State Park and public boat launch! In the epicenter of all things Finger Lakes Living including but not limited to Wineries & Vineyards, Breweries, Distilleries, Branchport/Penn Yan/Hammondsport village restaurants, shopping and live entertainment, hunting and fishing! Would make a very popular short term rental property! The possibilities a
Key facts
- Babbling brook
- Public boat launch
- 2 acre parcel
Tags
Property features AI
Exterior
- Parking: Detached garage; Circular driveway; 1 garage space
- Utilities: Public water; Septic tank; Electricity available and connected; Cable available; High-speed internet available
- Home design: Single-story; Residential single-family use; Has view; Resale fixer property
- Construction: Frame and stone construction; Block foundation; Metal roof; Existing (year built details indicate existing)
- Exterior features: Dirt driveway; Partially wooded lot; Level topography; Stream/creek on property (Sugar Creek); Beach, river and water access; Outbuilding(s), shed(s), and mobile home present; Garage(s) and other outbuildings
Interior
- Kitchen: Galley kitchen; Solid surface counters; Water heater listed under appliances
- Bedrooms: 1 main-level bedroom
- Bathrooms: 1 full bathroom (main level)
- Heating & cooling: Wood heating (see remarks); Heating present
- Interior features: Separate/formal living room; Galley kitchen; Solid surface counters; Fireplace (1)
- Laundry & utility: Water heater
Neighborhood map
What this means for you Summary
Snapshot
- This is a 1-bed/1.0-bath single-family listed at $130k.
Deal economics
- At list price, monthly cash flow is $-170 ($-2k/yr) — negative.
- To cash-flow at today's rent, offer at most $100k (23.1% below list).
- To meet the 1% rule (rent ≥ 1% of price), the offer needs to be $101k (22.0% below list).
- Recommended offer: $100k (23.1% below list) — sets the bar for cash-flow.
- Cap rate 5.3% vs local median 1.1% in Keuka Park — top-decile yield for the area; either an underpriced asset or a hidden risk that comps aren't pricing in. Stress-test before assuming the spread holds.
Location & tenants
- Location reads 66/100 on livability (#656 in NY) — a middle-class / working-renter tenant base. Strengths: employment A+, crime A, cost of living B+; Watch: health & safety D, amenities F, commute F.
- Penn Yan Central School District (town): math 57% / reading 62% proficiency, ranked #251 of 590 in NY (top 42%) — acceptable for families but not a draw, mixed tenant base, ~2y average lease.
- Zoned schools: Penn Yan Elementary School (math 56% / reading 55%, grade C, #902 of 2,108 statewide, top 43%, 519 students, 54% FRL); Penn Yan Middle School (math 45% / reading 61%, grade C+, #233 of 729 statewide, top 32%, 328 students, 56% FRL); Penn Yan Academy (math 98% / reading 92%, grade A+, #93 of 1,100 statewide, top 10%, 385 students, 48% FRL).
- Market conditions: 15 active listings in the ZIP; 107 units permitted in Yates County in 2024 (8 in 5+ unit buildings).
Forward outlook
- In year one you build about $14k of equity ($898 loan paydown + $13k appreciation (10.0% local appreciation)).
- Yates County population projected at -20% by 2050 — secular population decline; favor cash flow + early exit over multi-decade hold.
- By year 3, paydown + projected appreciation supports a ~$35k cash-out refi (75% LTV) — recoverable capital for the next deal without selling this one.
Negotiation context
- Only 3 days on market — expect competitive offers; lowballing is unlikely to land.
- Current owner paid $35k; list at $130k implies a 271% gain — meaningful room to come down on a strong offer.
Risks & watch-outs
- Watch-outs: flood insurance adds $66/mo.
- Climate carrying-cost: severe flood risk — expect insurance premiums to compound above CPI over the hold.
Questions for the listing agent
- What do current leases actually rent for vs. the listed asking? Can we see a recent rent roll and the last 12 months of T-12 income?
- What's the actual annual flood-insurance premium (NFIP or private), and is the property in a SFHA with mandatory coverage?
- Is there a deadline driving the sale (1031 exchange, divorce, estate, relocation)? That informs how much negotiation room exists.
- The area grade is low — what's the realistic commute time and amenity access for the typical tenant pool here? Any planned neighborhood developments (good or bad) we should know about?
- What's the average days-on-market for RENTAL listings here right now (not sales)? A rising rental-DOM trend means longer vacancies and softer asking-rent achievability than the comps imply.
- What's the recent tenant-quality profile in this submarket — average credit score on applications, eviction rate, late-payment / NSF rate, and stable-employment percentage? A property-management company in the area should have these aggregated.
- How much new for-sale + rental construction is in the pipeline within 1–3 miles? Heavy new supply typically softens prices + rents 12–24 months out; constrained supply supports both.
Investment metrics
- 1% rule
- 0.78% ✗
- Cap rate
- 5.34%
- Cash-on-cash
- -3.41%
- DSCR
- 0.85
- GRM
- 10.7
CMA / ARV
- ARV (median comp)
- $81,020
- List price
- $129,900
- Delta
- 60.33%
- Verdict
- OVERPRICED
- Comps
- 2 within 2.0 mi
Projected returns pro-forma
10.0% appreciation · 3.0% rent growth · sell at horizon
- IRR
- 20.3%
- Equity multiple
- 2.65×
- Total profit
- $59,998
- Equity at exit
- $117,024
- IRR
- 18.6%
- Equity multiple
- 6.09×
- Total profit
- $185,303
- Equity at exit
- $252,367
Cash invested: $36,372 (down + closing). Projections, not guarantees.
Landlord ↔ Tenant lean methodology
- Overall (STATE)
- 15 Strongly Tenant-Friendly
- State New York
- 15 Strongly Tenant-Friendly · D+10
- County
- — inherits STATE
- City
- — inherits STATE
ZIP-level market 14418
- Home prices YoY
- 4.7%
- Active inventory
- 15
- Price-to-rent
- 10.7×
Monthly cashflow live
- Estimated rent
- $1,014 medium interval (Pro) →
- Mortgage (P&I)
- −$681
- Tax from tax record
- −$169 /mo · $2,023/yr
- Insurance
- −$54
- Flood insurance flood zone
- −$66 /mo · $798/yr
- HOA
- −$0
- Vacancy / Maint / Mgmt
- −$213
- Net cashflow
- $-170
Break-even live
Sensitivity live
| Price | -10% $-96 | -5% $-133 | +0% $-170 | +5% $-206 | +10% $-243 |
|---|---|---|---|---|---|
| Rent | -10% $-250 | -5% $-210 | +0% $-170 | +5% $-130 | +10% $-90 |
| Rate | -1.0pp $-104 | -0.5pp $-137 | base $-170 | +0.5pp $-203 | +1.0pp $-238 |
UW: 25.0% down · 7.5% · 30yr · 1.5% tax · 5.0% vac · 8.0% maint · 8.0% mgmt
Financing live
Cash to close
- Down payment
- $32,475
- Closing costs
- $3,897
- Reserves months
- —
- Total cash needed
- —
Loan-product check · same deal, 3 products live
Conventional
25% down · 7.5% · 30yr
- Down + closing
- —
- Monthly P&I
- —
- Monthly cashflow
- —
- DSCR
- —
- Eligible?
- —
Personal DTI + credit; lowest rate.
DSCR
20% down · 8.5% · 30yr
- Down + closing
- —
- Monthly P&I
- —
- Monthly cashflow
- —
- DSCR
- —
- Eligible?
- —
No personal income docs; deal must DSCR.
Hard money
10% down · 12.0% · 12mo
- Down + closing
- —
- Monthly P&I
- —
- Monthly cashflow
- —
- DSCR
- —
- Eligible?
- —
Short-term bridge; refi at stabilization.
Listing history 3 events
-
2026-05-04status Pending 1002-char remark
-
2026-05-01$129,900 Active 1002-char remark
-
1999-11-24soldstatus $35,000
ⓘ Source: listings_history table (triggers on properties + properties_extension) + one-shot
backfill from property_details.listing_events for pre-trigger history.
Tax reassessment forecast NY · Partial reset (capped growth)
- Current annual tax
- $2,023 · $169/mo
- Projected year-2 tax
- $2,109 · $176/mo
- Expected delta
- +$86/yr (+$7/mo · 4.3%)
ⓘ Screening estimate from a state-policy table — verify with the county assessor before closing.
Climate risk First Street
- Flood 10/10 Extreme FEMA zone X · 99% chance over 30 yrs
- Wildfire 3/10 Moderate
- Heat 2/10 Low 7 d/yr ≥94°F today · 16 d/yr by 30 yrs out
- Wind 1/10 Low
- Air quality 1/10 Low 0 unhealthy d/yr today · 0 by 30 yrs out
Nearby sold comps map
Loading sold comps map…
Walkable amenities ~0.75 mi
Loading nearby amenities…
Taxation est. · year 1
- Rental income
- $12,162
- − Mortgage interest
- −$7,276
- − Property taxes
- −$2,023
- − Insurance
- −$1,447
- − Repairs & maintenance
- −$973
- − Management
- −$973
- − Depreciation
- −$3,779
- Taxable loss
- −$4,309
- Est. tax savings @ 24.0%
- +$1,034
- After-tax cash flow
- $-1,002/yr
For passive investors: Depreciation is non-cash, so a rental often shows a tax loss while cash-flowing — sheltering income. Rental losses are passive: they offset passive income freely, and up to $25,000/yr can offset ordinary (W-2) income if you actively participate and your MAGI is under $100k (phasing out to $0 by $150k); unused losses carry forward. On sale, claimed depreciation is recaptured at up to 25%, and gains may owe capital-gains tax (a 1031 exchange can defer both). Figures are a year-1 estimate at your 24.0% rate — not tax advice; consult a CPA.
Schools (NCES district)
- District
- Penn Yan Central School District
- NCES district ID
- 3622740
- Math proficiency
- 57% ▲ 1.00%
- Reading proficiency
- 62% ▲ 16.00%
- Median HH income
- $48,067
- Composite
- 50.46/100
- National rank
- #1860
- State rank
- #251 of 590 in NY
Livability — Keuka Park
- Score
- 66/100
- State rank
- #656
- US rank
- #12202
Category grades
Schools grade is shown separately in the Schools card above.
Census & demographics
- Population (ZIP)
- 1,147
Population outlook (Yates County) Hauer SSP2
- Today (2025)
- 23,773 people
- By 2030
- 22,867 · -3.8%
- By 2040
- 20,750 · -12.7%
- By 2050
- 18,917 · -20.4%
- By 2075
- 15,090 · -36.5%
- By 2100
- 11,428 · -51.9%
Race, ethnicity, and origin ACS 2023
- Neighborhood character
- Predominantly White (87%)
- Race & ethnicity
- White 87% Asian 12%
- Common ancestry
- Italian 7% Lithuanian 4% Romanian 3%
- Foreign-born
- 9% · China
- Languages at home
- 80% English-only · German/W. Germanic 10% Chinese 10%
Political lean MEDSL · Yates
- 2024 margin
- R (+16.2) · D 41.9% · R 58.1%
- 2008→2024 swing
- -12.5pp toward R · 2008: -3.7pp · 2024: -16.2pp
- All cycles
- 2024: R+16.2 2020: R+18.6 2016: R+21.9 2012: R+3.0 2008: R+3.7
Not yet ingested
- Civics
- —
Market trends
- HPI YoY
- ▲ 16.91%
- Current HPI
- 373.9993
- Rent YoY
- —
- Metro
- —
- State GDP YoY
- ▲ 2.60%
- F500 in state
- 92
Industry mix (Fortune 500 HQ in NY)
| Industry | F500 HQs | Revenue |
|---|---|---|
| Financial Services | 10 | $950B |
|
||
| Consumer Goods | 9 | $162B |
|
||
| Insurance | 4 | $225B |
|
||
| Telecommunications | 2 | $144B |
|
||
| Pharmaceuticals | 2 | $112B |
|
||
| Media / Entertainment | 2 | $69B |
|
||
Price history
+271.1% since first listed3 events — show timeline
- 2026-05-04 Pending — UNYREIS
- 2026-05-01 Listed $129,900 UNYREIS
- 1999-11-24 Sold (Public Records) $35,000 Public Records
Property tax history
-3.4%/yrLatest (2025): $2,023 · +6.6% YoY. Source: county tax records.
Cash-flow waterfall
monthlySold comps — $/sqft
last 12 mo · ≤1 miLoading sold comps…