1309 Athena Dr · Portland, TX
Flood risk No data
- FEMA flood zone
- —
- Chance of flooding over 30 yrs
- —
- Est. flood insurance / yr
- —
Fire risk No data
- Est. fire insurance / yr
- —
Heat risk No data
- Hot days now (above threshold)
- —
- Hot days in 30 yrs
- —
Wind risk No data
- Chance of severe wind over 30 yrs
- —
Air-quality risk No data
- Unhealthy air days now
- —
- Unhealthy air days in 30 yrs
- —
Risk factors via First Street. Map © Google.
Why this score? — see what drove the D grade
The composite is a weighted blend of 9 inputs, each scored 0–100. Each bar is that input's sub-score; the figure is the points it added to the 100-point composite (weight × sub-score).
- ARV discount +12.0/15.0
- Cash flow +11.5/30.0
- Livability +4.0/5.0
- Condition / age +4.0/5.0
- Schools +3.7/10.0
- DSCR +3.4/10.0
- 1% rule +3.3/10.0
- Rent growth +2.0/5.0
- Appreciation +0.0/10.0
$245,499
🖨 Deal sheet 📄 Offer letter ✓ Due diligence
Listing remarks
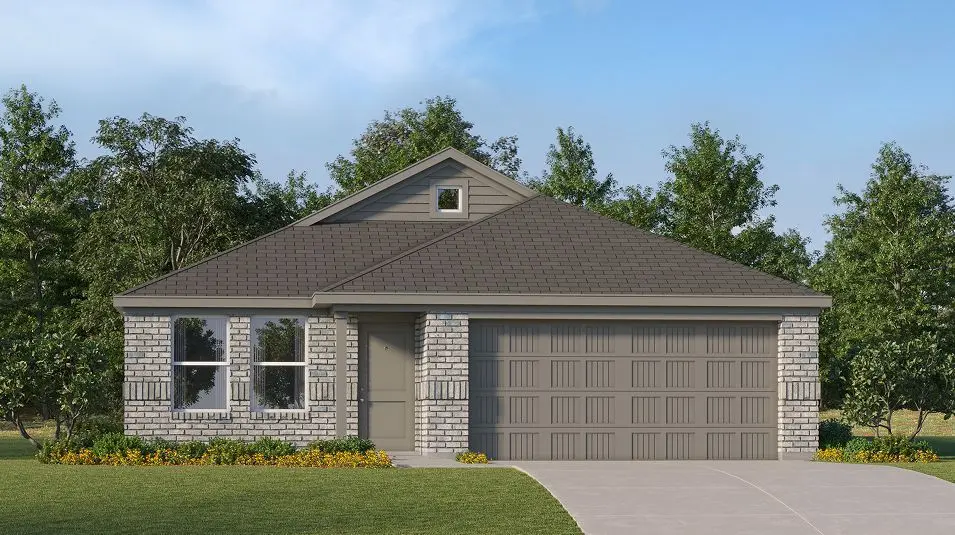
This single-level home showcases a spacious open floorplan shared between the kitchen, dining area and family room for easy entertaining. An owner's suite enjoys a private location in a rear corner of the home, complemented by an en-suite bathroom and walk-in closet. There are two secondary bedrooms at the front of the home, which are comfortable spaces for household members and overnight guests.
Key facts
- Walk-in closet
- Open floorplan
- Secondary bedrooms
Tags
Property features AI
Finance
- Other: Address: 1309 Athena Dr, Portland TX 78374; Plan name: Newlin
- Financial info: List price $262,999; Inventory type: Spec
- HOA & community: HOA details not specified
Exterior
- Parking: 2 total parking spaces; 2-car garage
- Security: Security features not specified
- Utilities: Utilities details not specified
- Home design: Spec new-construction home (Plan name: Newlin); Active listing
- Construction: Construction year not specified; Construction materials and foundation not specified; Roof details not specified
- Exterior features: Living area approximately 1484
Interior
- Kitchen: Included appliances not specified
- Bedrooms: 3 bedrooms
- Flooring: Flooring details not specified
- Bathrooms: 2 full bathrooms
- Heating & cooling: HVAC details not specified
- Interior features: Open living area
- Laundry & utility: Laundry location not specified
Neighborhood map
What this means for you Summary
Snapshot
- This is a 3-bed/2.0-bath single-family listed at $245k. Condition is rated good.
Deal economics
- At list price, monthly cash flow is $-80 ($-961/yr) — negative.
- To cash-flow at today's rent, offer at most $234k (4.7% below list).
- To meet the 1% rule (rent ≥ 1% of price), the offer needs to be $205k (16.7% below list).
- Recommended offer: $205k (16.7% below list) — sets the bar for 1% rule.
- Cap rate 5.9% vs local median 4.2% in Portland — top-decile yield for the area; either an underpriced asset or a hidden risk that comps aren't pricing in. Stress-test before assuming the spread holds.
Location & tenants
- Location reads 80/100 on livability (#36 in TX, #1,740 nationally) — a professional / high-income tenant draw. Strengths: employment A+, cost of living A+, housing A+; Watch: amenities F, commute F.
- Gregory-Portland ISD (suburban): math 41% / reading 42% proficiency, ranked #314 of 826 in TX (top 38%) — families likely to look elsewhere, expect single-tenant / working-renter base with shorter leases.
- Market conditions: Rents soft (-1.8%/yr); 302 active listings in the ZIP; 17 comparable units currently listed for rent nearby; rentals at typical pace (median 22d on market — plan ~3-4 weeks tenant-placement turnaround); solid renter incomes; 344 units permitted in San Patricio County in 2024 (0 in 5+ unit buildings).
Forward outlook
- Local home prices are declining (-3.0%/yr); year-one equity from $2k of loan paydown is wiped out by about $7k of value loss. Plan a longer hold.
- San Patricio County population projected at +27% by 2050 — long-run rental-demand tailwind backs the buy-and-hold thesis.
Negotiation context
- It's been on market 18 days — a 2% lower offer ($242k) is reasonable based on typical stale-listing flexibility.
Questions for the listing agent
- What do current leases actually rent for vs. the listed asking? Can we see a recent rent roll and the last 12 months of T-12 income?
- Is there a deadline driving the sale (1031 exchange, divorce, estate, relocation)? That informs how much negotiation room exists.
- The area grade is low — what's the realistic commute time and amenity access for the typical tenant pool here? Any planned neighborhood developments (good or bad) we should know about?
- What's the average days-on-market for RENTAL listings here right now (not sales)? A rising rental-DOM trend means longer vacancies and softer asking-rent achievability than the comps imply.
- What's the recent tenant-quality profile in this submarket — average credit score on applications, eviction rate, late-payment / NSF rate, and stable-employment percentage? A property-management company in the area should have these aggregated.
- How much new for-sale + rental construction is in the pipeline within 1–3 miles? Heavy new supply typically softens prices + rents 12–24 months out; constrained supply supports both.
Investment metrics
- 1% rule
- 0.83% ✗
- Cap rate
- 5.90%
- Cash-on-cash
- -1.40%
- DSCR
- 0.94
- GRM
- 10.0
CMA / ARV
- ARV (on-the-fly)
- $273,056
- Comps found
- 12
Show comp detail 12 sales within ~0.75 mi
| Address | Dist | Beds/Ba | Sqft | Sold | Price | $/sf | Match |
|---|---|---|---|---|---|---|---|
| 1111 Poseidon Dr | 0.07mi | 3/2.0 | 1,474 (-1%) | 1mo | $236,999 | $161 | 95 |
| 1139 Athena Dr | 0.17mi | 3/2.0 | 1,474 (-1%) | 10mo | $274,999 | $187 | 82 |
| 1309 Hera Dr | 0.22mi | 3/2.0 | 1,474 (-1%) | 8mo | $279,999 | $190 | 82 |
| 2246 Medusa Dr | 0.10mi | 3/2.0 | 1,415 (-5%) | 10mo | $309,685 | $219 | 80 |
| 2131 Artemis Dr | 0.08mi | 3/2.0 | 1,634 (+10%) | 1mo | $271,999 | $166 | 78 |
| 2137 Artemis Dr | 0.05mi | 3/2.0 | 1,634 (+10%) | 4mo | $300,999 | $184 | 78 |
| 2103 Fury | 0.23mi | 3/2.0 | 1,595 (+8%) | 2mo | $319,990 | $201 | 76 |
| 1118 Demeter Dr | 0.13mi | 4/2.0 (+1) | 1,668 (+12%) | 3mo | $262,000 | $157 | 66 |
| 2253 Medusa Dr | 0.13mi | 4/2.0 (+1) | 1,665 (+12%) | 9mo | $323,590 | $194 | 61 |
| 1137 Athena Dr | 0.18mi | 4/2.0 (+1) | 1,667 (+12%) | 9mo | $240,999 | $145 | 59 |
| 1303 Hera Dr | 0.22mi | 4/2.0 (+1) | 1,667 (+12%) | 7mo | $266,999 | $160 | 58 |
| 1307 Hera Dr | 0.22mi | 4/2.0 (+1) | 1,667 (+12%) | 8mo | $248,999 | $149 | 58 |
Match score weights: distance 35% · size 25% · config 20% · recency 20%. Top-matched comps best support the ARV.
Projected returns pro-forma
-3.0% appreciation · 0.0% rent growth · sell at horizon
- IRR
- -22.0%
- Equity multiple
- 0.26×
- Total profit
- $-50,847
- Equity at exit
- $36,605
- IRR
- -25.7%
- Equity multiple
- -0.07×
- Total profit
- $-73,893
- Equity at exit
- $21,226
Cash invested: $68,740 (down + closing). Projections, not guarantees.
Landlord ↔ Tenant lean methodology
- Overall (STATE)
- 87 Strongly Landlord-Friendly
- State Texas
- 87 Strongly Landlord-Friendly · R+5
- County
- — inherits STATE
- City
- — inherits STATE
ZIP-level market 78374
- Rents YoY
- -1.8%
- Active inventory
- 302
- Price-to-rent
- 10.0×
Monthly cashflow live
- Estimated rent
- $2,046 high interval (Pro) →
- Mortgage (P&I)
- −$1,287
- Tax est. 1.5%
- −$307 /mo · $3,682/yr
- Insurance
- −$102
- HOA
- −$0
- Vacancy / Maint / Mgmt
- −$430
- Net cashflow
- $-80
Break-even live
UW: 25.0% down · 7.5% · 30yr · 1.5% tax · 5.0% vac · 8.0% maint · 8.0% mgmt
Financing live
Cash to close
- Down payment
- $61,375
- Closing costs
- $7,365
- Reserves months
- —
- Total cash needed
- —
Loan-product check · same deal, 3 products live
Conventional
25% down · 7.5% · 30yr
- Down + closing
- —
- Monthly P&I
- —
- Monthly cashflow
- —
- DSCR
- —
- Eligible?
- —
Personal DTI + credit; lowest rate.
DSCR
20% down · 8.5% · 30yr
- Down + closing
- —
- Monthly P&I
- —
- Monthly cashflow
- —
- DSCR
- —
- Eligible?
- —
No personal income docs; deal must DSCR.
Hard money
10% down · 12.0% · 12mo
- Down + closing
- —
- Monthly P&I
- —
- Monthly cashflow
- —
- DSCR
- —
- Eligible?
- —
Short-term bridge; refi at stabilization.
Rent comps 17 comps
| Address | Beds | Baths | Sqft | Rent | $/sqft | DOM | Units | Dist |
|---|---|---|---|---|---|---|---|---|
| 1203 Athena Dr Portland, TX | 3.0 | 2.0 | 1535 | $2,400 | $1.56 | 14d | 1 | 0.10mi |
| 2012 Cottonwood Dr Portland, TX | 4.0 | 2.0 | 1619 | $2,350 | $1.45 | 21d | 1 | 0.57mi |
| 2112 Westwood Dr Portland, TX | 4.0 | 3.5 | 1863 | $2,350 | $1.26 | 14d | 1 | 0.60mi |
| 6736 Buddy Ganem Dr Portland, TX | 3.0 | 2.0 | 1216 | $1,595 | $1.31 | 21d | 1 | 0.80mi |
| 1801 Atascosa Dr Portland, TX | 3.0 | 2.0 | 1594 | $1,600 | $1.00 | 14d | 1 | 0.89mi |
| 1601 Moore Ave Portland, TX | 2.0–3.0 | 2.0–2.5 | 1295 | $1,899 | $1.47 | 14d | 18 | 0.91mi |
| 201 Walker Ave Portland, TX | 2.0 | 1.5 | 1195 | $1,350 | $1.13 | 14d | 1 | 1.04mi |
| 1719 Austin St Portland, TX | 3.0 | 1.5 | 1127 | $1,550 | $1.38 | 44d | 1 | 1.13mi |
| 1506 Briar St Portland, TX | 3.0 | 2.0 | 1803 | $2,300 | $1.28 | 44d | 1 | 1.16mi |
| 1461 Moore Ave Portland, TX | 2.0 | 2.5 | 1313 | $1,750 | $1.33 | 14d | 1 | 1.26mi |
| 1404 Moore Ave Portland, TX | 1.0–2.0 | 1.0 | 768 | $1,400 | $1.82 | 14d | 10 | 1.26mi |
| 1400 Moore Ave Portland, TX | 1.0–2.0 | 1.0–2.0 | 768 | $1,160 | $1.51 | 44d | 1 | 1.27mi |
| 102 N Commonsway Dr Unit C Portland, TX | 2.0 | 1.0 | 1008 | $1,000 | $0.99 | 44d | 1 | 1.31mi |
| 2201 Timberline Dr Unit Na Portland, TX | 4.0 | 2.0 | 1484 | $2,200 | $1.48 | 14d | 1 | 1.35mi |
| 101 S Commonsway Dr Portland, TX | 2.0 | 1.0 | 950 | $1,050 | $1.11 | 44d | 1 | 1.37mi |
| 101 S Commonsway Dr Unit 103C Portland, TX | 2.0 | 1.5 | 950 | $1,050 | $1.11 | 44d | 1 | 1.37mi |
| 1028 Starlite Dr Portland, TX | 3.0 | 1.5 | 984 | $1,450 | $1.47 | 21d | 1 | 1.41mi |
Listing history 16 events
-
2026-06-18days on market $245,499 Active 18 DOM
-
2026-06-17days on market $245,499 Active 17 DOM
-
2026-06-16days on market $245,499 Active 16 DOM
-
2026-06-15price $245,499 Active 15 DOM
-
2026-06-15days on market $244,749 Active 15 DOM
-
2026-06-14days on market $244,749 Active 13 DOM
-
2026-06-13pricedays on market $244,749 Active 12 DOM
-
2026-06-10days on market $243,999 Active 10 DOM
-
2026-06-09days on market $243,999 Active 9 DOM
-
2026-06-08pricedays on market $243,999 Active 8 DOM
-
2026-06-07days on market $243,499 Active 7 DOM
-
2026-06-03days on market $243,499 Active 3 DOM
-
2026-06-03price $243,499 Active 2 DOM
-
2026-06-02pricedays on market $242,999 Active 2 DOM
-
2026-05-31remarks 399-char remark
-
2026-05-31$262,999 Active 1 DOM
ⓘ Source: listings_history table (triggers on properties + properties_extension) + one-shot
backfill from property_details.listing_events for pre-trigger history.
Nearby sold comps map
Loading sold comps map…
Walkable amenities ~0.75 mi
Loading nearby amenities…
Taxation est. · year 1
- Rental income
- $24,555
- − Mortgage interest
- −$13,752
- − Property taxes
- −$3,682
- − Insurance
- −$1,227
- − Repairs & maintenance
- −$1,964
- − Management
- −$1,964
- − Depreciation
- −$7,142
- Taxable loss
- −$5,178
- Est. tax savings @ 24.0%
- +$1,243
- After-tax cash flow
- $282/yr
For passive investors: Depreciation is non-cash, so a rental often shows a tax loss while cash-flowing — sheltering income. Rental losses are passive: they offset passive income freely, and up to $25,000/yr can offset ordinary (W-2) income if you actively participate and your MAGI is under $100k (phasing out to $0 by $150k); unused losses carry forward. On sale, claimed depreciation is recaptured at up to 25%, and gains may owe capital-gains tax (a 1031 exchange can defer both). Figures are a year-1 estimate at your 24.0% rate — not tax advice; consult a CPA.
Condition & rehab AI · 12 photos
This single-level home features a spacious open floorplan with modern finishes and a good condition. It is move-in ready with minor cosmetic updates needed for optimal resale and rental value.
Value-add opportunities
- Resale Paint exterior trim — Enhances curb appeal
- Rental Clean gutters — Keeps home in good condition
Renovation cost estimate screening
Value-add ROI direction
- Resale Paint exterior trim — Enhances curb appeal ↑
- Rental Clean gutters — Keeps home in good condition ↑
ⓘ Cost ranges are severity-bucket heuristics (US national rule-of-thumb). Get contractor quotes + a written scope before underwriting a rehab budget.
Schools (NCES district)
- District
- Gregory-Portland ISD
- NCES district ID
- 4821780
- Math proficiency
- 41% ▼ -15.00%
- Reading proficiency
- 42% ▼ -9.00%
- Median HH income
- $59,135
- Composite
- 36.62/100
- National rank
- #4622
- State rank
- #314 of 826 in TX
Livability — Portland
- Score
- 80/100
- State rank
- #36
- US rank
- #1740
Category grades
Schools grade is shown separately in the Schools card above.
Census & demographics
- Census place
- Portland, TX
- County
- San Patricio County · 31,224 people
- City population
- 20,408
- Metro
- Corpus Christi, TX
- Population (ZIP)
- 20,408
- Household income
- $83,504
- Rent vs Own
- Severe rent burden
- 523.0
Population outlook (San Patricio County) Hauer SSP2
- Today (2025)
- 75,538 people
- By 2030
- 79,575 · +5.3%
- By 2040
- 87,670 · +16.1%
- By 2050
- 96,107 · +27.2%
- By 2075
- 117,984 · +56.2%
- By 2100
- 130,010 · +72.1%
Race, ethnicity, and origin ACS 2023
- Neighborhood character
- Diverse neighborhood (Simpson 0.57)
- Race & ethnicity
- White 51% Hispanic / Latino 41% Two or more races 19% Asian 2% Black 2%
- Hispanic origin (detail)
- Mexican 35% Cuban 2%
- Common ancestry
- Lithuanian 2% Slovak 2% Estonian 1%
- Foreign-born
- 7% · Canada
- Languages at home
- 79% English-only · Spanish 18% Other Indo-European 2% Tagalog/Filipino 0%
Political lean MEDSL · San Patricio
- 2024 margin
- Solid R (+36.4) · D 31.4% · R 67.8%
- 2008→2024 swing
- -19.8pp toward R · 2008: -16.6pp · 2024: -36.4pp
- All cycles
- 2024: R+36.4 2020: R+29.1 2016: R+24.1 2012: R+20.6 2008: R+16.6
Not yet ingested
- Civics
- —
Market trends
- HPI YoY
- ▼ -227.28%
- Current HPI
- 166.5529
- Rent YoY
- ▼ -1.84%
- Metro
- Corpus Christi, TX
- State GDP YoY
- ▲ 3.95%
- F500 in state
- 110
Industry mix (Fortune 500 HQ in TX)
| Industry | F500 HQs | Revenue |
|---|---|---|
| Energy | 16 | $1,198B |
|
||
| Technology | 5 | $198B |
|
||
| Engineering / Construction | 4 | $72B |
|
||
| Energy Services | 3 | $60B |
|
||
| Utilities | 3 | $41B |
|
||
| Healthcare | 2 | $330B |
|
||
Cash-flow waterfall
monthlySold comps — $/sqft
last 12 mo · ≤1 miLoading sold comps…