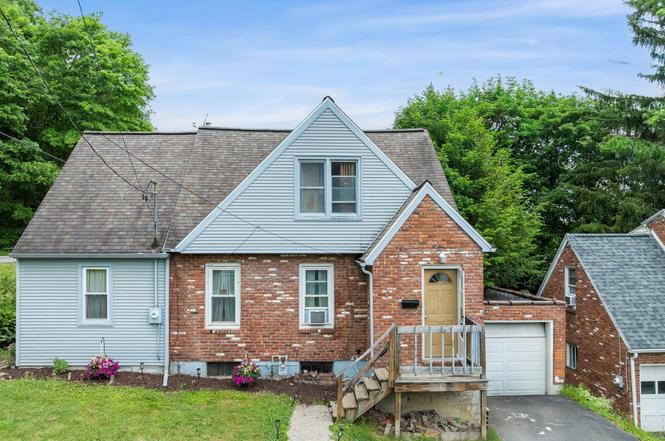
344 Doris Ave · Endicott, NY
Flood risk 1/10 · Minimal
- FEMA flood zone
- X
- Chance of flooding over 30 yrs
- 0.0%
- Est. flood insurance / yr
- $473 – $860
Fire risk 2/10 · Minimal
- Est. fire insurance / yr
- $691 – $1,283
Heat risk 3/10 · Minor
- Hot days now (above 93°F)
- 7 days/yr
- Hot days in 30 yrs
- 15 days/yr
Wind risk 2/10 · Minimal
- Chance of severe wind over 30 yrs
- 2.0%
Air-quality risk 2/10 · Minimal
- Unhealthy air days now
- 0 days/yr
- Unhealthy air days in 30 yrs
- 1 days/yr
Risk factors via First Street. Map © Google.
Why this score? — see what drove the D- grade
The composite is a weighted blend of 9 inputs, each scored 0–100. Each bar is that input's sub-score; the figure is the points it added to the 100-point composite (weight × sub-score).
- ARV discount +15.0/15.0
- Cash flow +5.8/30.0
- Schools +5.7/10.0
- 1% rule +3.6/10.0
- Livability +3.5/5.0
- Rent growth +2.5/5.0
- Condition / age +2.5/5.0
- DSCR +0.2/10.0
- Appreciation +0.0/10.0
$180,000
🖨 Deal sheet (PDF) 📄 Offer letter ✓ Due diligence
Listing remarks MLS
HUGE POTENTIAL, NEW roof, windows, siding, hwh!!!2 fireplaces (din, bsmnt). Large family room & master addition in 1973. 3 sheds on property (2electric). SOLD 'AS IS' Home is being sold for nursing home bill, NO money for repairs!
Key facts
- Gas fireplaces
- Flat backyard
- Corner lot
Tags
Property features AI
Exterior
- Parking: Attached garage (1 car)
- Utilities: Public water; Public sewer
- Home design: Single-family residence (Residential); Above-grade finished area approximately 1,710
- Construction: Brick and vinyl siding exterior
- Exterior features: Porch; Level lot
Interior
- Kitchen: Microwave; Refrigerator
- Flooring: Carpet; Hardwood; Tile
- Bathrooms: One full bathroom
- Heating & cooling: Baseboard heating; Ceiling fan(s) for cooling
- Interior features: Dryer, Washer, Microwave, Refrigerator, Gas water heater; Two fireplaces (masonry, gas) serving basement and dining room; 10 total rooms; Basement
- Laundry & utility: Washer and Dryer; Gas water heater
Neighborhood map
What this means for you Summary
Snapshot
- This is a 4-bed/1.5-bath single-family listed at $180k.
Deal economics
- At list price, monthly cash flow is $-357 ($-4k/yr) — negative.
- To cash-flow at today's rent, offer at most $135k (25.0% below list).
- To meet the 1% rule (rent ≥ 1% of price), the offer needs to be $155k (13.9% below list).
- Recommended offer: $135k (25.0% below list) — sets the bar for cash-flow.
- Cap rate 3.9% vs local median 5.5% in Endicott — below-typical yield; the buyer is paying a premium for something (appreciation thesis, condition, location) that the cap rate doesn't capture.
Location & tenants
- Location reads 70/100 on livability (#438 in NY) — a middle-class / working-renter tenant base. Strengths: cost of living A+, health & safety A+, housing A; Watch: amenities D, crime F, commute F.
- Vestal Central School District (suburban): math 63% / reading 68% proficiency, ranked #168 of 590 in NY (top 28%) — acceptable for families but not a draw, mixed tenant base, ~2y average lease; only 17% free/reduced lunch — higher-income household profile.
- Zoned schools: Clayton Avenue Elementary School (math 52% / reading 62%, grade C+, #842 of 2,108 statewide, top 43%, 248 students, 49% FRL) — zoned schools average 49% FRL vs 17% district-wide (31 pts higher); higher-poverty schools than district average — tighter screening recommended.
- Market conditions: 90 active listings in the ZIP; 1 comparable units currently listed for rent nearby; 340 units permitted in Broome County in 2024 (269 in 5+ unit buildings).
Forward outlook
- Local home prices are declining (-3.0%/yr); year-one equity from $1k of loan paydown is wiped out by about $5k of value loss. Plan a longer hold.
- Broome County population projected at -13% by 2050 — secular population decline; favor cash flow + early exit over multi-decade hold.
Negotiation context
- Only 2 days on market — expect competitive offers; lowballing is unlikely to land.
- 2 sale attempts since 13y ago with the ask held roughly flat each time — persistent listings suggest the price (not the market) is what's stuck; bring a comps-based counter.
- Current owner paid $89k; list at $180k implies a 103% gain — meaningful room to come down on a strong offer.
Risks & watch-outs
- Watch-outs: property tax is 3.7% of price; built in 1943 — expect roof / HVAC / electrical / plumbing capex.
Questions for the listing agent
- What do current leases actually rent for vs. the listed asking? Can we see a recent rent roll and the last 12 months of T-12 income?
- Built in 1943 — when were the roof, HVAC, electrical panel, plumbing, and water heater last replaced?
- Property tax is high relative to price — has the assessment been appealed recently, and will the sale trigger a re-assessment?
- Is there a deadline driving the sale (1031 exchange, divorce, estate, relocation)? That informs how much negotiation room exists.
- Schools are D-rated, which usually means shorter tenancies and higher turnover. Who's the typical renter profile here, and what's been the actual vacancy rate?
- Crime grade is F in this area — have there been break-ins, vandalism, or insurance claims at this property in the last 3 years? What carrier currently insures it and at what premium?
- The area grade is low — what's the realistic commute time and amenity access for the typical tenant pool here? Any planned neighborhood developments (good or bad) we should know about?
- What's the average days-on-market for RENTAL listings here right now (not sales)? A rising rental-DOM trend means longer vacancies and softer asking-rent achievability than the comps imply.
- What's the recent tenant-quality profile in this submarket — average credit score on applications, eviction rate, late-payment / NSF rate, and stable-employment percentage? A property-management company in the area should have these aggregated.
- How much new for-sale + rental construction is in the pipeline within 1–3 miles? Heavy new supply typically softens prices + rents 12–24 months out; constrained supply supports both.
Investment metrics
- 1% rule
- 0.86% ✗
- Cap rate
- 3.92%
- Cash-on-cash
- -8.49%
- DSCR
- 0.62
- GRM
- 9.7
CMA / ARV
- ARV (on-the-fly)
- $230,850
- Comps found
- 12
Show comp detail 12 sales within ~0.75 mi
| Address | Dist | Beds/Ba | Sqft | Sold | Price | $/sf | Match |
|---|---|---|---|---|---|---|---|
| 328 Leroy Ave | 0.06mi | 3/2.0 (-1) | 1,631 (-5%) | 4mo | $220,000 | $135 | 79 |
| 820 Verna Dr | 0.13mi | 4/1.5 | 1,535 (-10%) | 0mo | $234,900 | $153 | 76 |
| 528 Torrance Ave | 0.28mi | 4/1.5 | 1,596 (-7%) | 7mo | $231,000 | $145 | 70 |
| 339 Torrance Ave | 0.27mi | 3/2.0 (-1) | 1,696 (-1%) | 12mo | $225,000 | $133 | 69 |
| 321 Torrance Ave | 0.26mi | 3/1.0 (-1) | 1,824 (+7%) | 5mo | $179,900 | $99 | 66 |
| 1301 Front St | 0.33mi | 3/2.0 (-1) | 1,730 (+1%) | 14mo | $245,000 | $142 | 64 |
| 324 Frey Ave | 0.53mi | 4/2.0 | 1,794 (+5%) | 2mo | $350,000 | $195 | 63 |
| 1409 Arch Dr | 0.41mi | 3/2.0 (-1) | 1,661 (-3%) | 11mo | $261,000 | $157 | 60 |
| 1428 Arch Dr | 0.45mi | 3/1.0 (-1) | 1,840 (+8%) | 11mo | $200,000 | $109 | 50 |
| 408 Butternut Dr | 0.61mi | 3/1.0 (-1) | 1,699 (-1%) | 20mo | $180,000 | $106 | 47 |
| 404 Elmhaven Dr | 0.59mi | 3/2.0 (-1) | 1,884 (+10%) | 7mo | $175,000 | $93 | 43 |
| 312 Virginia Ave | 0.61mi | 4/2.0 | 1,466 (-14%) | 16mo | $170,000 | $116 | 32 |
Match score weights: distance 35% · size 25% · config 20% · recency 20%. Top-matched comps best support the ARV.
Projected returns pro-forma
-3.0% appreciation · 3.0% rent growth · sell at horizon
- IRR
- -31.1%
- Equity multiple
- -0.02×
- Total profit
- $-51,653
- Equity at exit
- $26,839
- IRR
- -33.2%
- Equity multiple
- -0.45×
- Total profit
- $-73,292
- Equity at exit
- $15,563
Cash invested: $50,400 (down + closing). Projections, not guarantees.
Landlord ↔ Tenant lean methodology
- Overall (STATE)
- 15 Strongly Tenant-Friendly
- State New York
- 15 Strongly Tenant-Friendly · D+10
- County
- — inherits STATE
- City
- — inherits STATE
ZIP-level market 13850
- Home prices YoY
- -33.5%
- Active inventory
- 90
- Price-to-rent
- 9.7×
Monthly cashflow live
- Estimated rent
- $1,550 medium interval (Pro) →
- Mortgage (P&I)
- −$944
- Tax from tax record
- −$562 /mo · $6,747/yr
- Insurance
- −$75
- HOA
- −$0
- Vacancy / Maint / Mgmt
- −$326
- Net cashflow
- $-357
Break-even live
Sensitivity live
| Price | -10% $-255 | -5% $-306 | +0% $-357 | +5% $-408 | +10% $-459 |
|---|---|---|---|---|---|
| Rent | -10% $-479 | -5% $-418 | +0% $-357 | +5% $-295 | +10% $-234 |
| Rate | -1.0pp $-266 | -0.5pp $-311 | base $-357 | +0.5pp $-403 | +1.0pp $-451 |
UW: 25.0% down · 7.5% · 30yr · 1.5% tax · 5.0% vac · 8.0% maint · 8.0% mgmt
Financing live
Cash to close
- Down payment
- $45,000
- Closing costs
- $5,400
- Reserves months
- —
- Total cash needed
- —
Loan-product check · same deal, 3 products live
Conventional
25% down · 7.5% · 30yr
- Down + closing
- —
- Monthly P&I
- —
- Monthly cashflow
- —
- DSCR
- —
- Eligible?
- —
Personal DTI + credit; lowest rate.
DSCR
20% down · 8.5% · 30yr
- Down + closing
- —
- Monthly P&I
- —
- Monthly cashflow
- —
- DSCR
- —
- Eligible?
- —
No personal income docs; deal must DSCR.
Hard money
10% down · 12.0% · 12mo
- Down + closing
- —
- Monthly P&I
- —
- Monthly cashflow
- —
- DSCR
- —
- Eligible?
- —
Short-term bridge; refi at stabilization.
Rent comps 1 comps
| Address | Beds | Baths | Sqft | Rent | $/sqft | DOM | Units | Dist |
|---|---|---|---|---|---|---|---|---|
| 1156 Glenwood Rd Vestal, NY | 3.0 | 1.5 | 1200 | $1,550 | $1.29 | 45d | 1 | 1.44mi |
Listing history 3 events
-
2026-06-19days on market $180,000 Active 2 DOM
-
2026-06-18remarks 646-char remark
-
2026-06-18$180,000 Active 1 DOM
ⓘ Source: listings_history table (triggers on properties + properties_extension) + one-shot
backfill from property_details.listing_events for pre-trigger history.
Tax reassessment forecast NY · Partial reset (capped growth)
- Current annual tax
- $6,747 · $562/mo
- Projected year-2 tax
- $6,747 · $562/mo
- Expected delta
- $0/yr ($0/mo · 0.0%)
ⓘ Screening estimate from a state-policy table — verify with the county assessor before closing.
Climate risk First Street
- Flood 1/10 Low FEMA zone X · 0% chance over 30 yrs
- Wildfire 2/10 Low
- Heat 3/10 Moderate 7 d/yr ≥93°F today · 15 d/yr by 30 yrs out
- Wind 2/10 Low 2% chance of damaging wind over 30 yrs
- Air quality 2/10 Low 0 unhealthy d/yr today · 1 by 30 yrs out
Nearby sold comps map
Loading sold comps map…
Walkable amenities ~0.75 mi
Loading nearby amenities…
Taxation est. · year 1
- Rental income
- $18,600
- − Mortgage interest
- −$10,083
- − Property taxes
- −$6,747
- − Insurance
- −$900
- − Repairs & maintenance
- −$1,488
- − Management
- −$1,488
- − Depreciation
- −$5,236
- Taxable loss
- −$7,342
- Est. tax savings @ 24.0%
- +$1,762
- After-tax cash flow
- $-2,518/yr
For passive investors: Depreciation is non-cash, so a rental often shows a tax loss while cash-flowing — sheltering income. Rental losses are passive: they offset passive income freely, and up to $25,000/yr can offset ordinary (W-2) income if you actively participate and your MAGI is under $100k (phasing out to $0 by $150k); unused losses carry forward. On sale, claimed depreciation is recaptured at up to 25%, and gains may owe capital-gains tax (a 1031 exchange can defer both). Figures are a year-1 estimate at your 24.0% rate — not tax advice; consult a CPA.
Schools (NCES district)
- District
- Vestal Central School District
- NCES district ID
- 3629610
- Math proficiency
- 63% ▼ -7.00%
- Reading proficiency
- 68% ▲ 4.00%
- Median HH income
- $64,143
- Composite
- 56.97/100
- National rank
- #1111
- State rank
- #168 of 590 in NY
Livability — Endicott
- Score
- 70/100
- State rank
- #438
- US rank
- #7657
Category grades
Schools grade is shown separately in the Schools card above.
Census & demographics
- City population
- 42,896
- Population (ZIP)
- 23,675
Population outlook (Broome County) Hauer SSP2
- Today (2025)
- 187,989 people
- By 2030
- 183,066 · -2.6%
- By 2040
- 172,228 · -8.4%
- By 2050
- 163,161 · -13.2%
- By 2075
- 153,641 · -18.3%
- By 2100
- 140,851 · -25.1%
Race, ethnicity, and origin ACS 2023
- Neighborhood character
- Predominantly White (78%)
- Race & ethnicity
- White 78% Asian 12% Hispanic / Latino 5% Two or more races 5% Black 2%
- Hispanic origin (detail)
- Puerto Rican 2%
- Common ancestry
- Romanian 6% Scotch-Irish 2% Italian 2%
- Foreign-born
- 14% · China, Canada, South Korea
- Languages at home
- 84% English-only · Chinese 6% Other Indo-European 5% Other Asian/Pacific 2%
Political lean MEDSL · Broome
- 2024 margin
- Toss-up / Even · D 50.2% · R 49.8%
- 2008→2024 swing
- -7.6pp toward R · 2008: 8.0pp · 2024: 0.4pp
- All cycles
- 2024: D+0.4 2020: D+3.5 2016: R+3.7 2012: D+4.6 2008: D+8.0
Not yet ingested
- Civics
- —
Market trends
- HPI YoY
- ▼ -142.14%
- Current HPI
- 282.4645
- Rent YoY
- —
- Metro
- —
- State GDP YoY
- ▲ 2.60%
- F500 in state
- 92
Industry mix (Fortune 500 HQ in NY)
| Industry | F500 HQs | Revenue |
|---|---|---|
| Financial Services | 10 | $950B |
|
||
| Consumer Goods | 9 | $162B |
|
||
| Insurance | 4 | $225B |
|
||
| Telecommunications | 2 | $144B |
|
||
| Pharmaceuticals | 2 | $112B |
|
||
| Media / Entertainment | 2 | $69B |
|
||
Price history
+140.0% since first listed4 events — show timeline
- 2026-06-17 Listed $180,000 GBAOR
- 2025-12-03 Sold (Public Records) $88,744 Public Records
- 2014-03-07 Sold (MLS) $50,000 GBAOR
- 2013-12-07 Listed $75,000 GBAOR
Property tax history
+6.8%/yrLatest (2025): $6,747 · +71.9% YoY. Source: county tax records.
Cash-flow waterfall
monthlySold comps — $/sqft
last 12 mo · ≤1 miLoading sold comps…