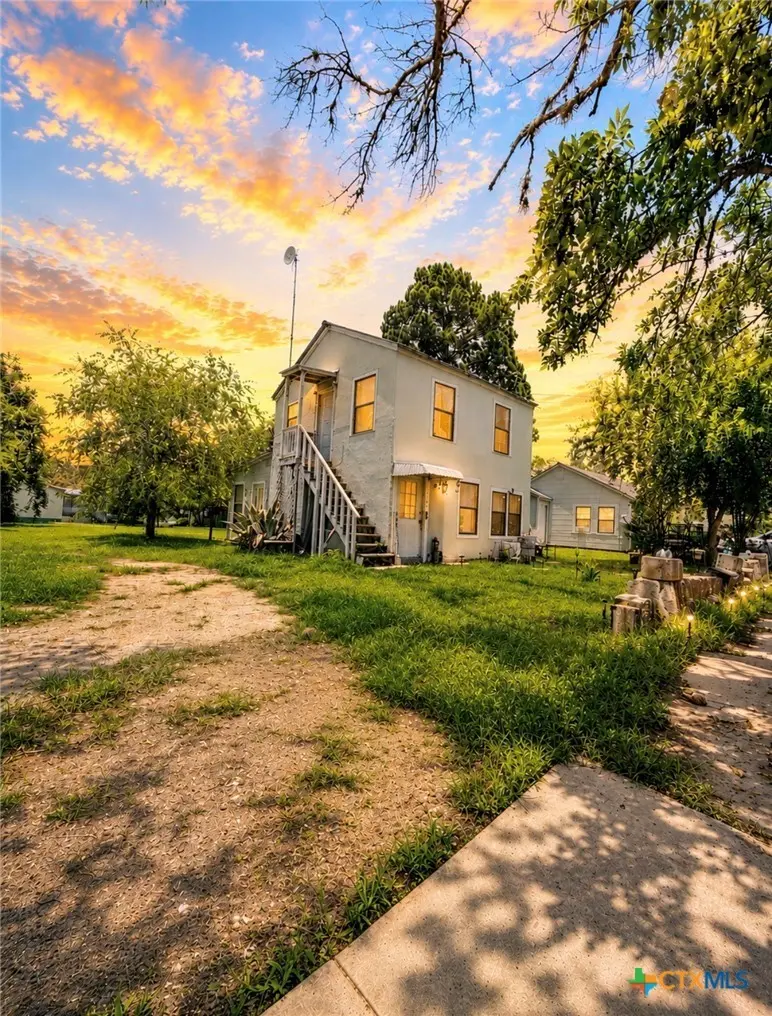
409 N Avenue D · Waelder, TX
Flood risk 1/10 · Minimal
- FEMA flood zone
- X (unshaded)
- Chance of flooding over 30 yrs
- 0.0%
- Est. flood insurance / yr
- $507 – $1,088
Fire risk 4/10 · Minor
- Est. fire insurance / yr
- $1,222 – $2,270
Heat risk 8/10 · Major
- Hot days now (above 109°F)
- 7 days/yr
- Hot days in 30 yrs
- 20 days/yr
Wind risk 8/10 · Major
- Chance of severe wind over 30 yrs
- 97.0%
Air-quality risk 1/10 · Minimal
- Unhealthy air days now
- 0 days/yr
- Unhealthy air days in 30 yrs
- 0 days/yr
Risk factors via First Street. Map © Google.
Why this score? — see what drove the B- grade
The composite is a weighted blend of 9 inputs, each scored 0–100. Each bar is that input's sub-score; the figure is the points it added to the 100-point composite (weight × sub-score).
- Cash flow +28.8/30.0
- DSCR +10.0/10.0
- 1% rule +8.0/10.0
- ARV discount +7.5/15.0
- Appreciation +4.1/10.0
- Livability +3.2/5.0
- Rent growth +2.5/5.0
- Condition / age +2.5/5.0
- Schools +2.2/10.0
$105,000
🖨 Deal sheet 📄 Offer letter ✓ Due diligence
Listing remarks MLS
This charming multi-family home, built in 1950, offers two distinct living spaces, perfect for generating rental income or multi-generational living. The lower-level unit features 2 bedrooms and 1 bath, providing a comfortable and inviting space with plenty of natural light. Upstairs, you’ll find a separate efficiency apartment with its own private entrance. It is ideal for additional rental income, or a home office setup. The yard offers endless possibilities, from a BBQ area to a split backyard or space for a tiny home—plus, the neighboring home is also available! This is a rare opportunity to own two adjacent properties, maximizing your investment potential. This multi-family home is a must-have investment with incredible income-generating opportunities, offering endless potential whether you're a seasoned investor or looking for a home that pays for itself. Schedule your showing today and seize this unbeatable opportunity!
Key facts
- Recent updates
- Income producing
- Flooring
Tags
Property features AI
Exterior
- Utilities: Public water; Electricity available; Public trash collection
- Home design: 2 stories; Resale property
- Construction: Stucco construction; Metal roof; Slab foundation; Year built per assessor
- Exterior features: City lot; Less than quarter acre; City street frontage; No significant exterior features listed
Interior
- Kitchen: Electric water heater
- Flooring: Laminate
- Bathrooms: 2 full bathrooms
- Heating & cooling: Window unit heating; Wall/window unit cooling
- Interior features: Ceiling fan(s); Open floorplan; Living/Dining room; Kitchen/Family room combo; Kitchen/Dining combo
- Laundry & utility: Washer hookup in kitchen; Electric dryer hookup in kitchen
Neighborhood map
What this means for you Summary
Snapshot
- This is a 2-bed/2.0-bath single-family listed at $105k.
Deal economics
- At list price, monthly cash flow is $354 ($4k/yr) — positive.
- The deal already cash-flows at list — no discount required.
- Meets the 1% rule at list price ($1k rent vs $105k).
Location & tenants
- Location reads 65/100 on livability (#705 in TX) — a middle-class / working-renter tenant base. Strengths: crime A+, cost of living A+, housing A+; Watch: schools F, amenities F, commute F.
- Waelder ISD (rural): math 20% / reading 25% proficiency, ranked #1,095 of 1,141 in TX (top 96%) — low school quality limits family demand, transient renter base, plan for 1-2y turnover; 78% free/reduced lunch — lower-income household profile, screen leases tightly.
- Market conditions: 59 active listings in the ZIP; 11 units permitted in Gonzales County in 2024 (0 in 5+ unit buildings).
Forward outlook
- Local home prices are declining (-1.7%/yr); year-one equity from $726 of loan paydown is wiped out by about $2k of value loss. Plan a longer hold.
- Gonzales County population projected at +17% by 2050 — long-run rental-demand tailwind backs the buy-and-hold thesis.
- At projected returns (-1.7% appreciation + 3.0% rent growth), your $29k cash investment doubles in ~7 years — after that, you're playing with house money.
Negotiation context
- Only 7 days on market — expect competitive offers; lowballing is unlikely to land.
- 3 sale attempts with the ask held roughly flat each time — persistent listings suggest the price (not the market) is what's stuck; bring a comps-based counter.
- Current owner paid $54k; list at $105k implies a 94% gain — meaningful room to come down on a strong offer.
Risks & watch-outs
- Watch-outs: built in 1950 — expect roof / HVAC / electrical / plumbing capex.
- Climate carrying-cost: severe wind risk, 97% chance of damaging wind over 30y; extreme-heat days projected 7→20/yr by 2055 (HVAC capex compounding) — expect insurance premiums to compound above CPI over the hold.
Questions for the listing agent
- Built in 1950 — when were the roof, HVAC, electrical panel, plumbing, and water heater last replaced?
- Is there a deadline driving the sale (1031 exchange, divorce, estate, relocation)? That informs how much negotiation room exists.
- Schools are F-rated, which usually means shorter tenancies and higher turnover. Who's the typical renter profile here, and what's been the actual vacancy rate?
- What's the average days-on-market for RENTAL listings here right now (not sales)? A rising rental-DOM trend means longer vacancies and softer asking-rent achievability than the comps imply.
- What's the recent tenant-quality profile in this submarket — average credit score on applications, eviction rate, late-payment / NSF rate, and stable-employment percentage? A property-management company in the area should have these aggregated.
- How much new for-sale + rental construction is in the pipeline within 1–3 miles? Heavy new supply typically softens prices + rents 12–24 months out; constrained supply supports both.
Investment metrics
- 1% rule
- 1.30% ✓
- Cap rate
- 10.34%
- Cash-on-cash
- 14.46%
- DSCR
- 1.64
- GRM
- 6.4
CMA / ARV
No comps found within radius.
Projected returns pro-forma
-1.74% appreciation · 3.0% rent growth · sell at horizon
- IRR
- 8.9%
- Equity multiple
- 1.38×
- Total profit
- $11,233
- Equity at exit
- $21,679
- IRR
- 16.2%
- Equity multiple
- 2.50×
- Total profit
- $44,041
- Equity at exit
- $19,768
Cash invested: $29,400 (down + closing). Projections, not guarantees.
Landlord ↔ Tenant lean methodology
- Overall (STATE)
- 87 Strongly Landlord-Friendly
- State Texas
- 87 Strongly Landlord-Friendly · R+5
- County
- — inherits STATE
- City
- — inherits STATE
ZIP-level market 78959
- Home prices YoY
- -1.5%
- Active inventory
- 59
- Price-to-rent
- 6.4×
Monthly cashflow live
- Estimated rent
- $1,367 medium interval (Pro) →
- Mortgage (P&I)
- −$551
- Tax est. 1.5%
- −$131 /mo · $1,575/yr
- Insurance
- −$44
- HOA
- −$0
- Vacancy / Maint / Mgmt
- −$287
- Net cashflow
- $354
Break-even live
UW: 25.0% down · 7.5% · 30yr · 1.5% tax · 5.0% vac · 8.0% maint · 8.0% mgmt
Financing live
Cash to close
- Down payment
- $26,250
- Closing costs
- $3,150
- Reserves months
- —
- Total cash needed
- —
Loan-product check · same deal, 3 products live
Conventional
25% down · 7.5% · 30yr
- Down + closing
- —
- Monthly P&I
- —
- Monthly cashflow
- —
- DSCR
- —
- Eligible?
- —
Personal DTI + credit; lowest rate.
DSCR
20% down · 8.5% · 30yr
- Down + closing
- —
- Monthly P&I
- —
- Monthly cashflow
- —
- DSCR
- —
- Eligible?
- —
No personal income docs; deal must DSCR.
Hard money
10% down · 12.0% · 12mo
- Down + closing
- —
- Monthly P&I
- —
- Monthly cashflow
- —
- DSCR
- —
- Eligible?
- —
Short-term bridge; refi at stabilization.
Listing history 8 events
-
2026-06-18days on market $105,000 Active 7 DOM
-
2026-06-17days on market $105,000 Active 6 DOM
-
2026-06-16days on market $105,000 Active 5 DOM
-
2026-06-15days on market $105,000 Active 4 DOM
-
2026-06-15days on market $105,000 Active 3 DOM
-
2026-06-13days on market $105,000 Active 2 DOM
-
2026-06-12remarks 240-char remark
-
2026-06-12$105,000 Active 1 DOM
ⓘ Source: listings_history table (triggers on properties + properties_extension) + one-shot
backfill from property_details.listing_events for pre-trigger history.
Climate risk First Street
- Flood 1/10 Low FEMA zone X (unshaded) · 0% chance over 30 yrs
- Wildfire 4/10 Moderate
- Heat 8/10 Severe 7 d/yr ≥109°F today · 20 d/yr by 30 yrs out
- Wind 8/10 Severe 97% chance of damaging wind over 30 yrs
- Air quality 1/10 Low 0 unhealthy d/yr today · 0 by 30 yrs out
Nearby sold comps map
Loading sold comps map…
Walkable amenities ~0.75 mi
Loading nearby amenities…
Taxation est. · year 1
- Rental income
- $16,404
- − Mortgage interest
- −$5,882
- − Property taxes
- −$1,575
- − Insurance
- −$525
- − Repairs & maintenance
- −$1,312
- − Management
- −$1,312
- − Depreciation
- −$3,055
- Taxable income
- $2,743
- Est. tax owed @ 24.0%
- −$658
- After-tax cash flow
- $3,593/yr
For passive investors: Depreciation is non-cash, so a rental often shows a tax loss while cash-flowing — sheltering income. Rental losses are passive: they offset passive income freely, and up to $25,000/yr can offset ordinary (W-2) income if you actively participate and your MAGI is under $100k (phasing out to $0 by $150k); unused losses carry forward. On sale, claimed depreciation is recaptured at up to 25%, and gains may owe capital-gains tax (a 1031 exchange can defer both). Figures are a year-1 estimate at your 24.0% rate — not tax advice; consult a CPA.
Schools (NCES district)
- District
- Waelder ISD
- NCES district ID
- 4844310
- Math proficiency
- 20% ▬ 0.00%
- Reading proficiency
- 25% ▬ 0.00%
- Median HH income
- $40,836
- Composite
- 22.24/100
- National rank
- #13507
- State rank
- #1095 of 1141 in TX
Livability — Waelder
- Score
- 65/100
- State rank
- #705
- US rank
- #13156
Category grades
Schools grade is shown separately in the Schools card above.
Census & demographics
- Census place
- Waelder, TX
- City population
- 1,401
- Population (ZIP)
- 1,401
Population outlook (Gonzales County) Hauer SSP2
- Today (2025)
- 22,246 people
- By 2030
- 23,060 · +3.7%
- By 2040
- 24,661 · +10.9%
- By 2050
- 26,046 · +17.1%
- By 2075
- 29,289 · +31.7%
- By 2100
- 30,112 · +35.4%
Race, ethnicity, and origin ACS 2023
- Neighborhood character
- Diverse neighborhood (Simpson 0.61)
- Race & ethnicity
- Hispanic / Latino 49% White 36% Two or more races 33% Black 10%
- Hispanic origin (detail)
- Mexican 49%
- Common ancestry
- Lithuanian 5% Iranian 3% Serbian 1%
- Foreign-born
- 16% · Canada, China
- Languages at home
- 62% English-only · Spanish 35% German/W. Germanic 1% Chinese 1%
Political lean MEDSL · Gonzales
- 2024 margin
- Solid R (+54.8) · D 22.3% · R 77.1%
- 2008→2024 swing
- -24.5pp toward R · 2008: -30.4pp · 2024: -54.8pp
- All cycles
- 2024: R+54.8 2020: R+48.1 2016: R+47.8 2012: R+40.4 2008: R+30.4
Not yet ingested
- Civics
- —
Market trends
- HPI YoY
- ▼ -1.74%
- Current HPI
- 114.4894
- Rent YoY
- —
- Metro
- —
- State GDP YoY
- ▲ 3.95%
- F500 in state
- 110
Industry mix (Fortune 500 HQ in TX)
| Industry | F500 HQs | Revenue |
|---|---|---|
| Energy | 16 | $1,198B |
|
||
| Technology | 5 | $198B |
|
||
| Engineering / Construction | 4 | $72B |
|
||
| Energy Services | 3 | $60B |
|
||
| Utilities | 3 | $41B |
|
||
| Healthcare | 2 | $330B |
|
||
Price history
+23.5% since first listed15 events — show timeline
- 2026-06-11 Listed $105,000 CTXMLS
- 2025-11-05 Sold (MLS) $54,000 CTXMLS
- 2025-11-05 Sold (MLS) — HARMLS
- 2025-10-14 Pending — CTXMLS
- 2025-10-14 Pending — HARMLS
- 2025-07-30 Price Changed $54,000 HARMLS
- 2025-07-30 Price Changed $54,000 CTXMLS
- 2025-07-08 Price Changed $59,000 HARMLS
- 2025-07-08 Price Changed $59,000 CTXMLS
- 2025-06-05 Price Changed $65,000 HARMLS
- 2025-06-05 Price Changed $65,000 CTXMLS
- 2025-04-23 Price Changed $75,000 HARMLS
- 2025-04-22 Price Changed $75,000 CTXMLS
- 2025-02-26 Listed $85,000 HARMLS
- 2025-02-21 Listed $85,000 CTXMLS
Cash-flow waterfall
monthlySold comps — $/sqft
last 12 mo · ≤1 miLoading sold comps…