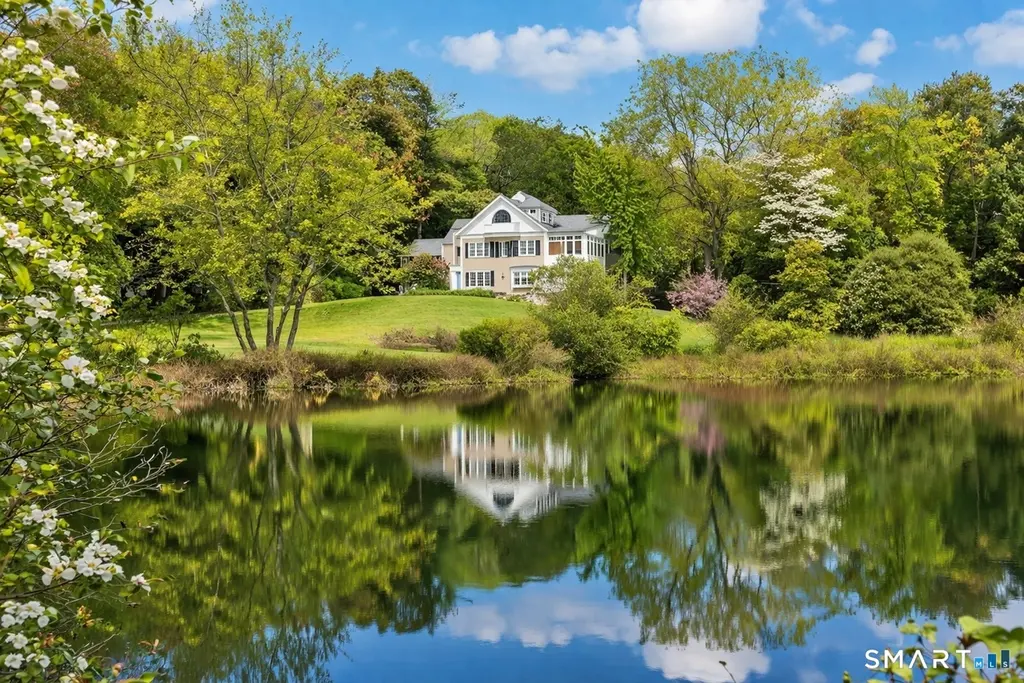
32 Steep Hill Rd · Weston, CT
Flood risk 1/10 · Minimal
- FEMA flood zone
- X (unshaded)
- Chance of flooding over 30 yrs
- 0.0%
- Est. flood insurance / yr
- $473 – $860
Fire risk 2/10 · Minimal
- Est. fire insurance / yr
- $829 – $1,539
Heat risk 5/10 · Moderate
- Hot days now (above 99°F)
- 7 days/yr
- Hot days in 30 yrs
- 15 days/yr
Wind risk 6/10 · Moderate
- Chance of severe wind over 30 yrs
- 27.0%
Air-quality risk 4/10 · Minor
- Unhealthy air days now
- 3 days/yr
- Unhealthy air days in 30 yrs
- 5 days/yr
Risk factors via First Street. Map © Google.
Why this score? — see what drove the B- grade
The composite is a weighted blend of 9 inputs, each scored 0–100. Each bar is that input's sub-score; the figure is the points it added to the 100-point composite (weight × sub-score).
- Cash flow +27.5/30.0
- DSCR +9.6/10.0
- ARV discount +9.1/15.0
- Schools +7.5/10.0
- 1% rule +7.0/10.0
- Rent growth +2.5/5.0
- Livability +2.5/5.0
- Condition / age +2.5/5.0
- Appreciation +0.0/10.0
$2,595,000
🖨 Deal sheet 📄 Offer letter ✓ Due diligence
Listing remarks MLS
This restored, 6,100 sf-expanded 18th century antique commands a view of its 1.24 ac, brook-fed lake; expansive lawn; raised beds; and 450 ft. bleached stone driveway. Your vision--Big Tented Celebrations,Fabulous Local Tomatoes--is correct. The former NYC chef's professional kitchen, wet bar, and 2 eat-in dining areas are open to the 5 rooms that circle around this heartbeat, making large gatherings feel and taste delicious. The antique's original entrance to a home office + fireplace (cozy, authentic) complete the floor. The 2nd floor offers 4 secondary beds/baths, a superior primary suite, and has a 600-sf bonus room with its own entrance and full kitchen. Generous third-level space fronted by a viewing balcony becomes the game/exercise/screening room you choose. Windows are featured everywhere, in particular note the sunroom array and the sitting room's 28ft of windowed walls. The separate 1,100 sf, 1-2 BR COTTAGE has had just 4 long-term tenants in the owners' 28 years. The COTTAGE rental income and tax/financial advantages make your net purchase price and occupancy exceedingly comfortable. The owner has prepared for final approvals a survey,building plans, and rendering package of a pool and surrounding deck connected to the home's 500sf front terrace. The buyer wishing the design can move forward with confidence in the sellers' careful efforts. A 2025, 95% efficient,state-of-the art, Navien natural gas boiler and HW installation has proven to be a gas bill slayer.
Key facts
- 3.92 acre lot
- 2 garage spots
- Built 1750
Neighborhood map
What this means for you Summary
Snapshot
- This is a 6-bed/6.5-bath other listed at $2.60M.
Deal economics
- At list price, monthly cash flow is $8k ($92k/yr) — positive.
- The deal already cash-flows at list — no discount required.
- Meets the 1% rule at list price ($31k rent vs $2.60M).
- Recommended offer: $2.44M (6.0% below list) — sets the bar for market timing.
- Cap rate 9.8% vs local median 3.1% in Weston — top-decile yield for the area; either an underpriced asset or a hidden risk that comps aren't pricing in. Stress-test before assuming the spread holds.
Location & tenants
- Location reads: area grade B — affects rentability + tenant quality, not the cash-flow math above.
- Weston School District (suburban): math 68% / reading 77% proficiency, ranked #4 of 153 in CT (top 3%) — strong family-tenant draw, lease renewals of 3-5y typical; only 1% free/reduced lunch — higher-income household profile.
- Market conditions: 73 active listings in the ZIP; 2 comparable units currently listed for rent nearby; 1,151 units permitted in Western Connecticut Planning Region in 2024 (714 in 5+ unit buildings).
Forward outlook
- Local home prices are declining (-3.0%/yr); year-one equity from $18k of loan paydown is wiped out by about $78k of value loss. Plan a longer hold.
- At projected returns (-3.0% appreciation + 3.0% rent growth), your $727k cash investment doubles in ~9 years — after that, you're playing with house money.
Negotiation context
- It's been on market 72 days — a 6% lower offer ($2.44M) is reasonable based on typical stale-listing flexibility.
- 12 sale attempts since 31y ago with the ask held roughly flat each time — persistent listings suggest the price (not the market) is what's stuck; bring a comps-based counter.
- Current owner paid $372k; list at $2.60M implies a 598% gain — meaningful room to come down on a strong offer.
Risks & watch-outs
- Watch-outs: built in 1750 — expect roof / HVAC / electrical / plumbing capex.
- Climate carrying-cost: major wind risk, 27% chance of damaging wind over 30y; extreme-heat days projected 7→15/yr by 2055 (HVAC capex compounding) — expect insurance premiums to compound above CPI over the hold.
Questions for the listing agent
- It's been on market 72 days. Have you received any prior offers? Is the seller open to a 6% concession, seller financing, or rate buy-down credit?
- Built in 1750 — when were the roof, HVAC, electrical panel, plumbing, and water heater last replaced?
- Why hasn't it sold? Are there any deal-killer items the seller is aware of (foundation, flood, title, zoning, code violations)?
- Is there a deadline driving the sale (1031 exchange, divorce, estate, relocation)? That informs how much negotiation room exists.
- What's the average days-on-market for RENTAL listings here right now (not sales)? A rising rental-DOM trend means longer vacancies and softer asking-rent achievability than the comps imply.
- What's the recent tenant-quality profile in this submarket — average credit score on applications, eviction rate, late-payment / NSF rate, and stable-employment percentage? A property-management company in the area should have these aggregated.
- How much new for-sale + rental construction is in the pipeline within 1–3 miles? Heavy new supply typically softens prices + rents 12–24 months out; constrained supply supports both.
Investment metrics
- 1% rule
- 1.20% ✓
- Cap rate
- 9.82%
- Cash-on-cash
- 12.61%
- DSCR
- 1.56
- GRM
- 7.0
CMA / ARV
- ARV (median comp)
- $2,688,422
- List price
- $2,595,000
- Delta
- -3.47%
- Verdict
- FAIR
- Comps
- 20 within 1.0 mi
Projected returns pro-forma
-3.0% appreciation · 3.0% rent growth · sell at horizon
- IRR
- 2.3%
- Equity multiple
- 1.09×
- Total profit
- $65,506
- Equity at exit
- $386,923
- IRR
- 11.9%
- Equity multiple
- 1.94×
- Total profit
- $682,460
- Equity at exit
- $224,368
Cash invested: $726,600 (down + closing). Projections, not guarantees.
Landlord ↔ Tenant lean methodology
- Overall (STATE)
- 27 Tenant-Leaning
- State Connecticut
- 27 Tenant-Leaning · D+7
- County
- — inherits STATE
- City
- — inherits STATE
ZIP-level market 06883
- Active inventory
- 73
- Price-to-rent
- 7.0×
Monthly cashflow live
- Estimated rent
- $31,103 medium interval (Pro) →
- Mortgage (P&I)
- −$13,608
- Tax from tax record
- −$2,249 /mo · $26,988/yr
- Insurance
- −$1,081
- HOA
- −$0
- Vacancy / Maint / Mgmt
- −$6,532
- Net cashflow
- $7,633
Break-even live
UW: 25.0% down · 7.5% · 30yr · 1.5% tax · 5.0% vac · 8.0% maint · 8.0% mgmt
Financing live
Cash to close
- Down payment
- $648,750
- Closing costs
- $77,850
- Reserves months
- —
- Total cash needed
- —
Loan-product check · same deal, 3 products live
Conventional
25% down · 7.5% · 30yr
- Down + closing
- —
- Monthly P&I
- —
- Monthly cashflow
- —
- DSCR
- —
- Eligible?
- —
Personal DTI + credit; lowest rate.
DSCR
20% down · 8.5% · 30yr
- Down + closing
- —
- Monthly P&I
- —
- Monthly cashflow
- —
- DSCR
- —
- Eligible?
- —
No personal income docs; deal must DSCR.
Hard money
10% down · 12.0% · 12mo
- Down + closing
- —
- Monthly P&I
- —
- Monthly cashflow
- —
- DSCR
- —
- Eligible?
- —
Short-term bridge; refi at stabilization.
Rent comps 2 comps
| Address | Beds | Baths | Sqft | Rent | $/sqft | DOM | Units | Dist |
|---|---|---|---|---|---|---|---|---|
| 37 Beaverbrook Rd Weston, CT | 5.0 | 4.5 | 6734 | $35,000 | $5.20 | 43d | 1 | 0.28mi |
| 29 Rogues Rdg Weston, CT | 6.0 | 6.5 | 7649 | $17,000 | $2.22 | 2d | 1 | 0.99mi |
Listing history 40 events
-
2026-06-18days on market $2,595,000 Active 72 DOM
-
2026-06-17days on market $2,595,000 Active 71 DOM
-
2026-06-16days on market $2,595,000 Active 70 DOM
-
2026-06-15days on market $2,595,000 Active 69 DOM
-
2026-06-13days on market $2,595,000 Active 67 DOM
-
2026-06-13days on market $2,595,000 Active 66 DOM
-
2026-06-10days on market $2,595,000 Active 64 DOM
-
2026-06-09days on market $2,595,000 Active 63 DOM
-
2026-06-08days on market $2,595,000 Active 62 DOM
-
2026-06-07days on market $2,595,000 Active 61 DOM
-
2026-06-03days on market $2,595,000 Active 57 DOM
-
2026-06-03days on market $2,595,000 Active 56 DOM
-
2026-06-01days on market $2,595,000 Active 55 DOM
-
2026-05-31days on market $2,595,000 Active 54 DOM
-
2026-04-08$2,595,000 Active 1495-char remark
Show marketing remark (1495 chars)
This restored, 6,100 sf-expanded 18th century antique commands a view of its 1.24 ac, brook-fed lake; expansive lawn; raised beds; and 450 ft. bleached stone driveway. Your vision--Big Tented Celebrations,Fabulous Local Tomatoes--is correct. The former NYC chef's professional kitchen, wet bar, and 2 eat-in dining areas are open to the 5 rooms that circle around this heartbeat, making large gatherings feel and taste delicious. The antique's original entrance to a home office + fireplace (cozy, authentic) complete the floor. The 2nd floor offers 4 secondary beds/baths, a superior primary suite, and has a 600-sf bonus room with its own entrance and full kitchen. Generous third-level space fronted by a viewing balcony becomes the game/exercise/screening room you choose. Windows are featured everywhere, in particular note the sunroom array and the sitting room's 28ft of windowed walls. The separate 1,100 sf, 1-2 BR COTTAGE has had just 4 long-term tenants in the owners' 28 years. The COTTAGE rental income and tax/financial advantages make your net purchase price and occupancy exceedingly comfortable. The owner has prepared for final approvals a survey,building plans, and rendering package of a pool and surrounding deck connected to the home's 500sf front terrace. The buyer wishing the design can move forward with confidence in the sellers' careful efforts. A 2025, 95% efficient,state-of-the art, Navien natural gas boiler and HW installation has proven to be a gas bill slayer.
-
2026-04-03historical $2,595,000 1495-char remark
Show marketing remark (1495 chars)
This restored, 6,100 sf-expanded 18th century antique commands a view of its 1.24 ac, brook-fed lake; expansive lawn; raised beds; and 450 ft. bleached stone driveway. Your vision--Big Tented Celebrations,Fabulous Local Tomatoes--is correct. The former NYC chef's professional kitchen, wet bar, and 2 eat-in dining areas are open to the 5 rooms that circle around this heartbeat, making large gatherings feel and taste delicious. The antique's original entrance to a home office + fireplace (cozy, authentic) complete the floor. The 2nd floor offers 4 secondary beds/baths, a superior primary suite, and has a 600-sf bonus room with its own entrance and full kitchen. Generous third-level space fronted by a viewing balcony becomes the game/exercise/screening room you choose. Windows are featured everywhere, in particular note the sunroom array and the sitting room's 28ft of windowed walls. The separate 1,100 sf, 1-2 BR COTTAGE has had just 4 long-term tenants in the owners' 28 years. The COTTAGE rental income and tax/financial advantages make your net purchase price and occupancy exceedingly comfortable. The owner has prepared for final approvals a survey,building plans, and rendering package of a pool and surrounding deck connected to the home's 500sf front terrace. The buyer wishing the design can move forward with confidence in the sellers' careful efforts. A 2025, 95% efficient,state-of-the art, Navien natural gas boiler and HW installation has proven to be a gas bill slayer.
-
2025-06-05historical
-
2025-04-28$2,495,000 Active
-
2025-04-22historical
-
2022-06-24historical
-
2022-02-19$2,495,000 Active
-
2022-02-15historical
-
2021-11-23historical
-
2021-09-16status Active
-
2021-07-05historical
-
2021-04-07$2,495,000 Active
-
2016-10-27historical
-
2016-10-26historical
-
2016-04-15$2,295,000
-
2016-04-15$2,295,000
-
2015-11-15historical
-
2015-03-14$2,350,000
-
2015-01-18historical
-
2014-10-03$2,395,000
-
2006-12-14historical
-
2006-10-07$2,595,000
-
1997-11-30soldstatus $372,000
-
1997-09-24$419,000
-
1997-09-15historical
-
1995-02-13$419,000
ⓘ Source: listings_history table (triggers on properties + properties_extension) + one-shot
backfill from property_details.listing_events for pre-trigger history.
Tax reassessment forecast CT · Partial reset (capped growth)
- Current annual tax
- $26,988 · $2,249/mo
- Projected year-2 tax
- $41,260 · $3,438/mo
- Expected delta
- +$14,272/yr (+$1,189/mo · 52.9%)
ⓘ Screening estimate from a state-policy table — verify with the county assessor before closing.
Climate risk First Street
- Flood 1/10 Low FEMA zone X (unshaded) · 0% chance over 30 yrs
- Wildfire 2/10 Low
- Heat 5/10 Major 7 d/yr ≥99°F today · 15 d/yr by 30 yrs out
- Wind 6/10 Major 27% chance of damaging wind over 30 yrs
- Air quality 4/10 Moderate 3 unhealthy d/yr today · 5 by 30 yrs out
Nearby sold comps map
Loading sold comps map…
Walkable amenities ~0.75 mi
Loading nearby amenities…
Taxation est. · year 1
- Rental income
- $373,241
- − Mortgage interest
- −$145,360
- − Property taxes
- −$26,988
- − Insurance
- −$12,975
- − Repairs & maintenance
- −$29,859
- − Management
- −$29,859
- − Depreciation
- −$75,491
- Taxable income
- $52,708
- Est. tax owed @ 24.0%
- −$12,650
- After-tax cash flow
- $78,946/yr
For passive investors: Depreciation is non-cash, so a rental often shows a tax loss while cash-flowing — sheltering income. Rental losses are passive: they offset passive income freely, and up to $25,000/yr can offset ordinary (W-2) income if you actively participate and your MAGI is under $100k (phasing out to $0 by $150k); unused losses carry forward. On sale, claimed depreciation is recaptured at up to 25%, and gains may owe capital-gains tax (a 1031 exchange can defer both). Figures are a year-1 estimate at your 24.0% rate — not tax advice; consult a CPA.
Schools (NCES district)
- District
- Weston School District
- NCES district ID
- 0905010
- Math proficiency
- 68% ▼ -6.00%
- Reading proficiency
- 77% ▼ -1.00%
- Median HH income
- $194,414
- Composite
- 75.21/100
- National rank
- #137
- State rank
- #4 of 153 in CT
Livability — Weston
No livability data for this city. (Only ~50 U.S. cities are tracked.)
Census & demographics
- Population (ZIP)
- 10,335
Population outlook (Western Connecticut County) Hauer SSP2
- By 2040
- 685,031
Race, ethnicity, and origin ACS 2023
- Neighborhood character
- Predominantly White (78%)
- Race & ethnicity
- White 78% Two or more races 10% Hispanic / Latino 9% Asian 5% Black 3%
- Hispanic origin (detail)
- Mexican 1% Puerto Rican 2% Dominican 1% Salvadoran 2%
- Common ancestry
- Romanian 7% Scotch-Irish 5% Italian 5%
- Foreign-born
- 16% · Canada, China, Dominican Republic
- Languages at home
- 83% English-only · Spanish 5% Chinese 3% Other Indo-European 3%
Political lean MEDSL · Western Connecticut
- 2024 margin
- D (+19.1) · D 58.8% · R 39.7% · Other 1.6%
- All cycles
- 2024: D+19.1
Not yet ingested
- Civics
- —
Market trends
- HPI YoY
- ▼ -316.44%
- Current HPI
- 208.835
- Rent YoY
- —
- Metro
- —
- State GDP YoY
- ▲ 1.06%
- F500 in state
- 38
Industry mix (Fortune 500 HQ in CT)
| Industry | F500 HQs | Revenue |
|---|---|---|
| Industrial Machinery | 4 | $38B |
|
||
| Insurance | 3 | $71B |
|
||
| Financial Services | 2 | $25B |
|
||
| Transportation / Logistics | 2 | $18B |
|
||
| Healthcare | 1 | $247B |
|
||
| Telecommunications | 1 | $55B |
|
||
Price history
+519.3% since first listed26 events — show timeline
- 2026-04-08 Listed $2,595,000 Smart MLS
- 2026-04-03 Coming Soon $2,595,000 Smart MLS
- 2025-06-05 Listing Removed — Smart MLS
- 2025-04-28 Listed $2,495,000 Smart MLS
- 2025-04-22 Coming Soon — Smart MLS
- 2022-06-24 Listing Removed — Smart MLS
- 2022-02-19 Listed $2,495,000 Smart MLS
- 2022-02-15 Coming Soon — Smart MLS
- 2021-11-23 Listing Removed — Smart MLS
- 2021-09-16 Relisted — Smart MLS
- 2021-07-05 Listing Removed — Smart MLS
- 2021-04-07 Listed $2,495,000 Smart MLS
- 2016-10-27 Delisted — GMLS
- 2016-10-26 Listing Removed — Smart MLS
- 2016-04-15 Listed $2,295,000 Smart MLS
- 2016-04-15 Listed $2,295,000 GMLS
- 2015-11-15 Listing Removed — Smart MLS
- 2015-03-14 Listed $2,350,000 Smart MLS
- 2015-01-18 Listing Removed — Smart MLS
- 2014-10-03 Listed $2,395,000 Smart MLS
- 2006-12-14 Listing Removed — Smart MLS
- 2006-10-07 Listed $2,595,000 Smart MLS
- 1997-11-30 Sold (MLS) $372,000 Smart MLS
- 1997-09-24 Listed $419,000 Smart MLS
- 1997-09-15 Listing Removed — Smart MLS
- 1995-02-13 Listed $419,000 Smart MLS
Property tax history
+1.2%/yrLatest (2023): $26,988 · +0.3% YoY. Source: county tax records.
Cash-flow waterfall
monthlySold comps — $/sqft
last 12 mo · ≤1 miLoading sold comps…