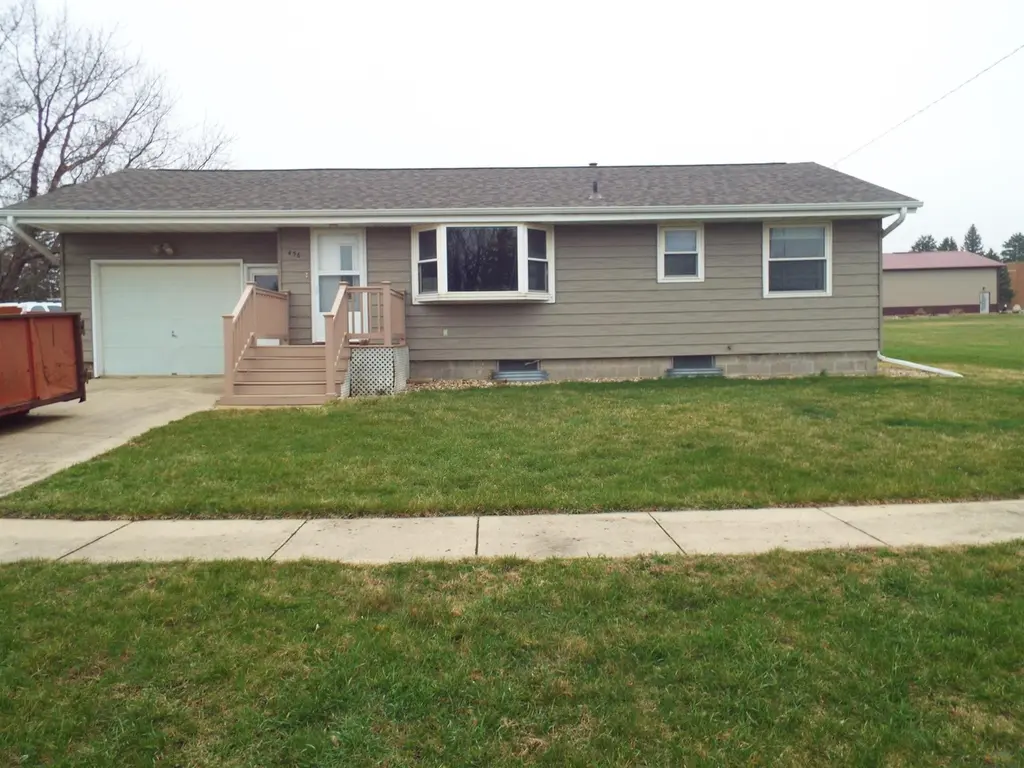
456 4th Ave · Ashton, IA
Flood risk 1/10 · Minimal
- FEMA flood zone
- X (unshaded)
- Chance of flooding over 30 yrs
- 0.0%
- Est. flood insurance / yr
- $473 – $860
Fire risk 5/10 · Moderate
- Est. fire insurance / yr
- $902 – $1,676
Heat risk 3/10 · Minor
- Hot days now (above 100°F)
- 7 days/yr
- Hot days in 30 yrs
- 15 days/yr
Wind risk 2/10 · Minimal
- Chance of severe wind over 30 yrs
- —
Air-quality risk 2/10 · Minimal
- Unhealthy air days now
- 0 days/yr
- Unhealthy air days in 30 yrs
- 1 days/yr
Risk factors via First Street. Map © Google.
Why this score? — see what drove the D+ grade
The composite is a weighted blend of 9 inputs, each scored 0–100. Each bar is that input's sub-score; the figure is the points it added to the 100-point composite (weight × sub-score).
- Cash flow +14.2/30.0
- Schools +6.4/10.0
- Appreciation +6.2/10.0
- ARV discount +5.1/15.0
- DSCR +4.3/10.0
- Livability +3.2/5.0
- 1% rule +2.9/10.0
- Rent growth +2.5/5.0
- Condition / age +2.5/5.0
$119,900
🖨 Deal sheet 📄 Offer letter ✓ Due diligence
Listing remarks MLS
Take a look at this one story 2 bedroom home close to the city park and the Catholic Church in Ashton. The home has permanent siding and an attached garage. There is a 12 x 16 storage shed in the back yard for all the extras along with a nice deck on the back of the home. Inside the kitchen is open to a dining area. Laundry area is currently on main floor but there are also hookups in the basement. Bathroom has a convenient walk-in shower and storage.
Key facts
- Attached garage
- Laundry area
- Storage shed
Tags
Neighborhood map
What this means for you Summary
Snapshot
- This is a 2-bed/2.5-bath single-family listed at $120k.
Deal economics
- At list price, monthly cash flow is $19 ($226/yr) — positive.
- The deal already cash-flows at list — no discount required.
- To meet the 1% rule (rent ≥ 1% of price), the offer needs to be $94k (21.3% below list).
- Recommended offer: $94k (21.3% below list) — sets the bar for 1% rule.
Location & tenants
- Location reads 63/100 on livability (#673 in IA) — a middle-class / working-renter tenant base. Strengths: cost of living A+, housing A+; Watch: crime C-, employment C-, schools F.
- Sheldon Community School District (town): math 74% / reading 78% proficiency, ranked #63 of 289 in IA (top 22%) — strong family-tenant draw, lease renewals of 3-5y typical.
- Market conditions: 5 active listings in the ZIP; 8 units permitted in Osceola County in 2024 (0 in 5+ unit buildings).
Forward outlook
- In year one you build about $4k of equity ($829 loan paydown + $3k appreciation (2.4% local appreciation)).
- Osceola County population projected at -32% by 2050 — secular population decline; favor cash flow + early exit over multi-decade hold.
- At projected returns (2.4% appreciation + 3.0% rent growth), your $34k cash investment doubles in ~7 years — after that, you're playing with house money.
- By year 9, paydown + projected appreciation supports a ~$32k cash-out refi (75% LTV) — recoverable capital for the next deal without selling this one.
Negotiation context
- It's been on market 66 days — a 6% lower offer ($113k) is reasonable based on typical stale-listing flexibility.
- Current owner paid $79k; list at $120k implies a 52% gain — meaningful room to come down on a strong offer.
Risks & watch-outs
- Watch-outs: built in 1954 — expect roof / HVAC / electrical / plumbing capex.
- Climate carrying-cost: moderate wildfire risk — expect insurance premiums to compound above CPI over the hold.
Questions for the listing agent
- It's been on market 66 days. Have you received any prior offers? Is the seller open to a 21% concession, seller financing, or rate buy-down credit?
- Built in 1954 — when were the roof, HVAC, electrical panel, plumbing, and water heater last replaced?
- Why hasn't it sold? Are there any deal-killer items the seller is aware of (foundation, flood, title, zoning, code violations)?
- Is there a deadline driving the sale (1031 exchange, divorce, estate, relocation)? That informs how much negotiation room exists.
- Schools are F-rated, which usually means shorter tenancies and higher turnover. Who's the typical renter profile here, and what's been the actual vacancy rate?
- The area grade is low — what's the realistic commute time and amenity access for the typical tenant pool here? Any planned neighborhood developments (good or bad) we should know about?
- What's the average days-on-market for RENTAL listings here right now (not sales)? A rising rental-DOM trend means longer vacancies and softer asking-rent achievability than the comps imply.
- What's the recent tenant-quality profile in this submarket — average credit score on applications, eviction rate, late-payment / NSF rate, and stable-employment percentage? A property-management company in the area should have these aggregated.
- How much new for-sale + rental construction is in the pipeline within 1–3 miles? Heavy new supply typically softens prices + rents 12–24 months out; constrained supply supports both.
Investment metrics
- 1% rule
- 0.79% ✗
- Cap rate
- 6.48%
- Cash-on-cash
- 0.67%
- DSCR
- 1.03
- GRM
- 10.6
CMA / ARV
- ARV (median comp)
- $113,945
- List price
- $119,900
- Delta
- 5.23%
- Verdict
- FAIR
- Comps
- 5 within 1.0 mi
Show comp detail 2 sales within ~0.75 mi
| Address | Dist | Beds/Ba | Sqft | Sold | Price | $/sf | Match |
|---|---|---|---|---|---|---|---|
| 357 3rd Ave | 0.11mi | 2/1.0 | 1,120 (-13%) | 20mo | $110,000 | $98 | 52 |
| 550 Ashton Ave | 0.09mi | 3/1.0 (+1) | 1,120 (-13%) | 21mo | $98,000 | $88 | 46 |
Match score weights: distance 35% · size 25% · config 20% · recency 20%. Top-matched comps best support the ARV.
Projected returns pro-forma
2.42% appreciation · 3.0% rent growth · sell at horizon
- IRR
- 6.4%
- Equity multiple
- 1.36×
- Total profit
- $11,933
- Equity at exit
- $50,015
- IRR
- 9.6%
- Equity multiple
- 2.35×
- Total profit
- $45,415
- Equity at exit
- $74,176
Cash invested: $33,572 (down + closing). Projections, not guarantees.
Landlord ↔ Tenant lean methodology
- Overall (STATE)
- 83 Strongly Landlord-Friendly
- State Iowa
- 83 Strongly Landlord-Friendly · R+6
- County
- — inherits STATE
- City
- — inherits STATE
ZIP-level market 51232
- Home prices YoY
- 2.1%
- Active inventory
- 5
- Price-to-rent
- 10.6×
Monthly cashflow live
- Estimated rent
- $943 medium interval (Pro) →
- Mortgage (P&I)
- −$629
- Tax from tax record
- −$48 /mo · $570/yr
- Insurance
- −$50
- HOA
- −$0
- Vacancy / Maint / Mgmt
- −$198
- Net cashflow
- $19
Break-even live
UW: 25.0% down · 7.5% · 30yr · 1.5% tax · 5.0% vac · 8.0% maint · 8.0% mgmt
Financing live
Cash to close
- Down payment
- $29,975
- Closing costs
- $3,597
- Reserves months
- —
- Total cash needed
- —
Loan-product check · same deal, 3 products live
Conventional
25% down · 7.5% · 30yr
- Down + closing
- —
- Monthly P&I
- —
- Monthly cashflow
- —
- DSCR
- —
- Eligible?
- —
Personal DTI + credit; lowest rate.
DSCR
20% down · 8.5% · 30yr
- Down + closing
- —
- Monthly P&I
- —
- Monthly cashflow
- —
- DSCR
- —
- Eligible?
- —
No personal income docs; deal must DSCR.
Hard money
10% down · 12.0% · 12mo
- Down + closing
- —
- Monthly P&I
- —
- Monthly cashflow
- —
- DSCR
- —
- Eligible?
- —
Short-term bridge; refi at stabilization.
Listing history 18 events
-
2026-06-18days on market $119,900 Active 66 DOM
-
2026-06-17days on market $119,900 Active 65 DOM
-
2026-06-16days on market $119,900 Active 64 DOM
-
2026-06-15days on market $119,900 Active 63 DOM
-
2026-06-13days on market $119,900 Active 61 DOM
-
2026-06-12days on market $119,900 Active 60 DOM
-
2026-06-09days on market $119,900 Active 57 DOM
-
2026-06-08days on market $119,900 Active 56 DOM
-
2026-06-07days on market $119,900 Active 55 DOM
-
2026-06-05days on market $119,900 Active 53 DOM
-
2026-06-04days on market $119,900 Active 51 DOM
-
2026-06-02days on market $119,900 Active 50 DOM
-
2026-06-01days on market $119,900 Active 49 DOM
-
2026-05-31days on market $119,900 Active 48 DOM
-
2026-05-31days on market $119,900 Active 47 DOM
-
2026-04-20price $119,900 455-char remark
Show marketing remark (455 chars)
Take a look at this one story 2 bedroom home close to the city park and the Catholic Church in Ashton. The home has permanent siding and an attached garage. There is a 12 x 16 storage shed in the back yard for all the extras along with a nice deck on the back of the home. Inside the kitchen is open to a dining area. Laundry area is currently on main floor but there are also hookups in the basement. Bathroom has a convenient walk-in shower and storage.
-
2026-04-13$129,900 Active 455-char remark
Show marketing remark (455 chars)
Take a look at this one story 2 bedroom home close to the city park and the Catholic Church in Ashton. The home has permanent siding and an attached garage. There is a 12 x 16 storage shed in the back yard for all the extras along with a nice deck on the back of the home. Inside the kitchen is open to a dining area. Laundry area is currently on main floor but there are also hookups in the basement. Bathroom has a convenient walk-in shower and storage.
-
2020-12-18soldstatus $79,000
ⓘ Source: listings_history table (triggers on properties + properties_extension) + one-shot
backfill from property_details.listing_events for pre-trigger history.
Tax reassessment forecast IA · Partial reset (capped growth)
- Current annual tax
- $570 · $48/mo
- Projected year-2 tax
- $1,226 · $102/mo
- Expected delta
- +$656/yr (+$55/mo · 115.1%)
ⓘ Screening estimate from a state-policy table — verify with the county assessor before closing.
Climate risk First Street
- Flood 1/10 Low FEMA zone X (unshaded) · 0% chance over 30 yrs
- Wildfire 5/10 Major
- Heat 3/10 Moderate 7 d/yr ≥100°F today · 15 d/yr by 30 yrs out
- Wind 2/10 Low
- Air quality 2/10 Low 0 unhealthy d/yr today · 1 by 30 yrs out
Nearby sold comps map
Loading sold comps map…
Walkable amenities ~0.75 mi
Loading nearby amenities…
Taxation est. · year 1
- Rental income
- $11,318
- − Mortgage interest
- −$6,716
- − Property taxes
- −$570
- − Insurance
- −$600
- − Repairs & maintenance
- −$905
- − Management
- −$905
- − Depreciation
- −$3,488
- Taxable loss
- −$1,867
- Est. tax savings @ 24.0%
- +$448
- After-tax cash flow
- $674/yr
For passive investors: Depreciation is non-cash, so a rental often shows a tax loss while cash-flowing — sheltering income. Rental losses are passive: they offset passive income freely, and up to $25,000/yr can offset ordinary (W-2) income if you actively participate and your MAGI is under $100k (phasing out to $0 by $150k); unused losses carry forward. On sale, claimed depreciation is recaptured at up to 25%, and gains may owe capital-gains tax (a 1031 exchange can defer both). Figures are a year-1 estimate at your 24.0% rate — not tax advice; consult a CPA.
Schools (NCES district)
- District
- Sheldon Community School District
- NCES district ID
- 1925980
- Math proficiency
- 74% ▼ -4.00%
- Reading proficiency
- 78% ▬ 0.00%
- Median HH income
- $50,644
- Composite
- 64.39/100
- National rank
- #545
- State rank
- #63 of 289 in IA
Livability — Ashton
- Score
- 63/100
- State rank
- #673
- US rank
- #15651
Category grades
Schools grade is shown separately in the Schools card above.
Census & demographics
- Census place
- Ashton, IA
- Population (ZIP)
- 713
Population outlook (Osceola County) Hauer SSP2
- Today (2025)
- 5,434 people
- By 2030
- 5,046 · -7.1%
- By 2040
- 4,339 · -20.2%
- By 2050
- 3,711 · -31.7%
- By 2075
- 2,649 · -51.3%
- By 2100
- 1,975 · -63.7%
Race, ethnicity, and origin ACS 2023
- Neighborhood character
- Predominantly White (97%)
- Race & ethnicity
- White 97% Hispanic / Latino 2% Two or more races 1%
- Common ancestry
- Iranian 16% Lithuanian 5% Portuguese 4%
- Foreign-born
- 1% · Canada
- Languages at home
- 98% English-only · Spanish 1% French/Haitian/Cajun 1%
Political lean MEDSL · Osceola
- 2024 margin
- Solid R (+64.2) · D 17.2% · R 81.5% · Other 1.3%
- 2008→2024 swing
- -32.6pp toward R · 2008: -31.7pp · 2024: -64.2pp
- All cycles
- 2024: R+64.2 2020: R+62.8 2016: R+61.8 2012: R+41.4 2008: R+31.7
Not yet ingested
- Civics
- —
Market trends
- HPI YoY
- ▲ 2.42%
- Current HPI
- 114.5305
- Rent YoY
- —
- Metro
- —
- State GDP YoY
- ▲ 2.48%
- F500 in state
- 4
Industry mix (Fortune 500 HQ in IA)
| Industry | F500 HQs | Revenue |
|---|---|---|
| Financial Services | 1 | $16B |
|
||
| Retail / Convenience | 1 | $15B |
|
||
Price history
+51.8% since first listed3 events — show timeline
- 2026-04-20 Price Changed $119,900 NWIA
- 2026-04-13 Listed $129,900 NWIA
- 2020-12-18 Sold (Public Records) $79,000 Public Records
Property tax history
+1.1%/yrLatest (2025): $570 · -12.0% YoY. Source: county tax records.
Cash-flow waterfall
monthlySold comps — $/sqft
last 12 mo · ≤1 miLoading sold comps…