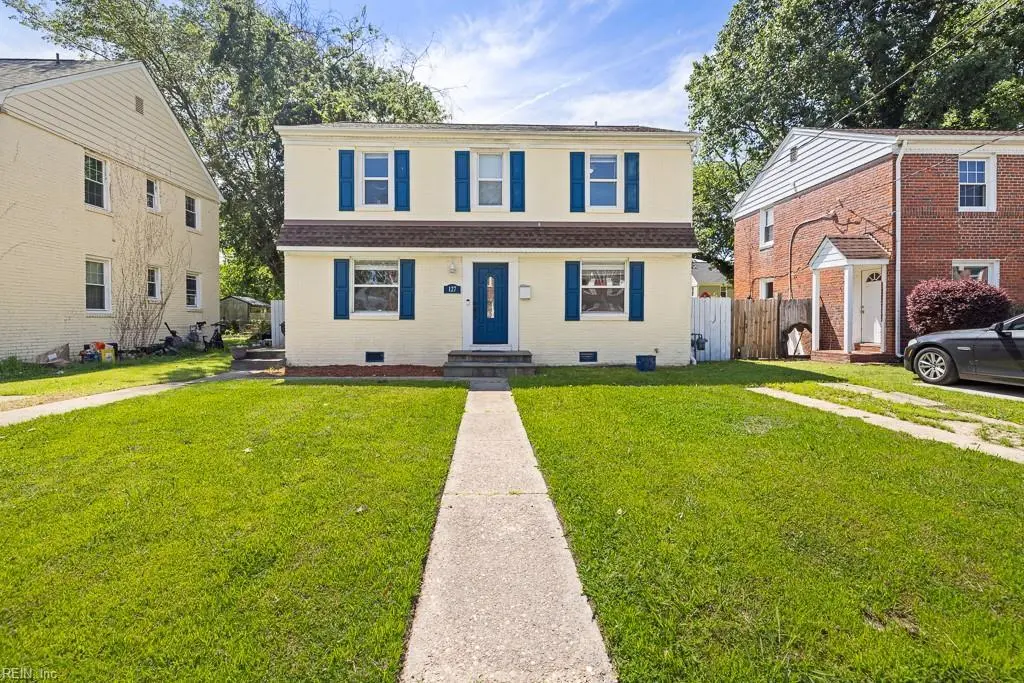
127 Clyde St · Hampton, VA
Flood risk 4/10 · Minor
- FEMA flood zone
- X (unshaded)
- Chance of flooding over 30 yrs
- 0.13%
- Est. flood insurance / yr
- $473 – $860
Fire risk 1/10 · Minimal
- Est. fire insurance / yr
- $666 – $1,236
Heat risk 9/10 · Severe
- Hot days now (above 105°F)
- 7 days/yr
- Hot days in 30 yrs
- 16 days/yr
Wind risk 8/10 · Major
- Chance of severe wind over 30 yrs
- 80.0%
Air-quality risk 2/10 · Minimal
- Unhealthy air days now
- 1 days/yr
- Unhealthy air days in 30 yrs
- 1 days/yr
Risk factors via First Street. Map © Google.
Why this score? — see what drove the D grade
The composite is a weighted blend of 9 inputs, each scored 0–100. Each bar is that input's sub-score; the figure is the points it added to the 100-point composite (weight × sub-score).
- Cash flow +12.6/30.0
- ARV discount +9.4/15.0
- Schools +5.5/10.0
- Rent growth +3.9/5.0
- Livability +3.8/5.0
- DSCR +3.7/10.0
- 1% rule +3.1/10.0
- Condition / age +2.5/5.0
- Appreciation +0.0/10.0
$270,000
🖨 Deal sheet (PDF) 📄 Offer letter ✓ Due diligence
Listing remarks MLS
Closing cost assistance may be available. Contact listing agent for details. Welcome home to this beautifully updated 4-bedroom, 2-bathroom charmer located in the sought-after Sussex at Hampton neighborhood! This home features a newer roof, updated electrical and plumbing from 2021, and a recently installed HVAC system in 2023. The windows were also replaced for added efficiency. A stylish shed was added in 2017, and major utility upgrades include a new water line (2021) and sewer line (2017). Fresh interior paint just completed, giving the home a bright and clean feel throughout. Conveniently located near Hampton University, Downtown Hampton, and quick access to I-64. Don’t miss your chance—schedule your private tour today!
Key facts
- Replaced windows
- Updated electrical
- Newer roof
Tags
Neighborhood map
What this means for you Summary
Snapshot
- This is a 4-bed/2.0-bath single-family listed at $270k.
Deal economics
- At list price, monthly cash flow is $-36 ($-437/yr) — negative.
- To cash-flow at today's rent, offer at most $264k (2.4% below list).
- To meet the 1% rule (rent ≥ 1% of price), the offer needs to be $218k (19.4% below list).
- Recommended offer: $218k (19.4% below list) — sets the bar for 1% rule.
- Cap rate 6.1% vs local median 4.5% in Hampton — top-decile yield for the area; either an underpriced asset or a hidden risk that comps aren't pricing in. Stress-test before assuming the spread holds.
Location & tenants
- Location reads 75/100 on livability (#133 in VA, #4,302 nationally) — a middle-class / working-renter tenant base. Strengths: housing A+, health & safety A+, cost of living A; Watch: crime C-, amenities D+, commute F.
- Hampton City Public School District (urban): math 60% / reading 70% proficiency, ranked #40 of 131 in VA (top 30%) — acceptable for families but not a draw, mixed tenant base, ~2y average lease.
- Zoned schools: Hunter B. Andrews (math 65% / reading 72%, grade B+, #357 of 1,108 statewide, top 33%, 1,131 students, 81% FRL); Thomas Eaton Middle (math 51% / reading 60%, grade B-, #186 of 342 statewide, top 55%, 577 students, 88% FRL); Phoebus High (math 57% / reading 76%, grade B, #195 of 319 statewide, top 62%, 1,365 students, 86% FRL) — zoned schools average 85% FRL vs 49% district-wide (36 pts higher); higher-poverty schools than district average — tighter screening recommended.
- Market conditions: Rents rising fast (+5.4%/yr); 235 active listings in the ZIP; 15 comparable units currently listed for rent nearby; rentals at typical pace (median 17d on market — plan ~3-4 weeks tenant-placement turnaround); 40% of comp listings sitting > 30 days — soft ceiling on asking rent; 68 units permitted in Hampton city in 2024 (0 in 5+ unit buildings).
- This rent runs 37% of the median local income ($71k/yr) — at the standard rent-burdened threshold; future hikes will face affordability resistance.
Forward outlook
- Local home prices are declining (-3.0%/yr); year-one equity from $2k of loan paydown is wiped out by about $8k of value loss. Plan a longer hold.
- Hampton County population projected at -13% by 2050 — secular population decline; favor cash flow + early exit over multi-decade hold.
Negotiation context
- It's been on market 73 days — a 6% lower offer ($254k) is reasonable based on typical stale-listing flexibility.
- 8 sale attempts since 10y ago; this cycle's ask is 4% above the opening price — seller raised mid-cycle; expect resistance to lowballs.
Risks & watch-outs
- Watch-outs: built in 1944 — expect roof / HVAC / electrical / plumbing capex.
- Climate carrying-cost: severe wind risk, 80% chance of damaging wind over 30y; extreme-heat days projected 7→16/yr by 2055 (HVAC capex compounding) — expect insurance premiums to compound above CPI over the hold.
Questions for the listing agent
- What do current leases actually rent for vs. the listed asking? Can we see a recent rent roll and the last 12 months of T-12 income?
- It's been on market 73 days. Have you received any prior offers? Is the seller open to a 19% concession, seller financing, or rate buy-down credit?
- Built in 1944 — when were the roof, HVAC, electrical panel, plumbing, and water heater last replaced?
- Why hasn't it sold? Are there any deal-killer items the seller is aware of (foundation, flood, title, zoning, code violations)?
- Is there a deadline driving the sale (1031 exchange, divorce, estate, relocation)? That informs how much negotiation room exists.
- Schools are B-rated — typically a magnet for longer-tenancy family renters. What's the average tenant stay here, and is there a school-zone premium baked into asking?
- The area grade is low — what's the realistic commute time and amenity access for the typical tenant pool here? Any planned neighborhood developments (good or bad) we should know about?
- What's the average days-on-market for RENTAL listings here right now (not sales)? A rising rental-DOM trend means longer vacancies and softer asking-rent achievability than the comps imply.
- What's the recent tenant-quality profile in this submarket — average credit score on applications, eviction rate, late-payment / NSF rate, and stable-employment percentage? A property-management company in the area should have these aggregated.
- How much new for-sale + rental construction is in the pipeline within 1–3 miles? Heavy new supply typically softens prices + rents 12–24 months out; constrained supply supports both.
Investment metrics
- 1% rule
- 0.81% ✗
- Cap rate
- 6.13%
- Cash-on-cash
- -0.58%
- DSCR
- 0.97
- GRM
- 10.3
CMA / ARV
- ARV (median comp)
- $281,950
- List price
- $270,000
- Delta
- -4.24%
- Verdict
- FAIR
- Comps
- 20 within 1.0 mi
Show comp detail 12 sales within ~0.75 mi
| Address | Dist | Beds/Ba | Sqft | Sold | Price | $/sf | Match |
|---|---|---|---|---|---|---|---|
| 137 Clyde St | 0.05mi | 4/2.0 | 1,584 (0%) | 3mo | $100,000 | $63 | 96 |
| 106 Clyde St | 0.10mi | 4/2.0 | 1,584 (0%) | 2mo | $280,000 | $177 | 94 |
| 3829 Roads View Ave | 0.15mi | 3/2.0 (-1) | 1,584 (0%) | 2mo | $265,000 | $167 | 86 |
| 4009 Catesby Jones Dr | 0.19mi | 3/2.0 (-1) | 1,600 (+1%) | 1mo | $285,000 | $178 | 84 |
| 3614 Matoaka Rd | 0.41mi | 4/2.0 | 1,566 (-1%) | 2mo | $320,500 | $205 | 77 |
| 154 Armstrong Dr | 0.09mi | 4/2.0 | 1,783 (+13%) | 5mo | $245,000 | $137 | 71 |
| 55 Victor St | 0.58mi | 3/2.5 (-1) | 1,589 (+0%) | 5mo | $337,000 | $212 | 61 |
| 126 Cherokee Rd | 0.54mi | 3/2.0 (-1) | 1,669 (+5%) | 1mo | $323,000 | $194 | 60 |
| 4037 Catesby Jones Dr | 0.37mi | 3/2.0 (-1) | 1,760 (+11%) | 1mo | $325,000 | $185 | 58 |
| 15 Victor St | 0.46mi | 4/2.5 | 1,755 (+11%) | 3mo | $239,900 | $137 | 56 |
| 355 Ivy Home Rd | 0.64mi | 4/2.5 | 1,400 (-12%) | 0mo | $299,800 | $214 | 48 |
| 144 Algonquin Rd | 0.63mi | 3/1.5 (-1) | 1,742 (+10%) | 1mo | $315,000 | $181 | 46 |
Match score weights: distance 35% · size 25% · config 20% · recency 20%. Top-matched comps best support the ARV.
Projected returns pro-forma
-3.0% appreciation · 5.44% rent growth · sell at horizon
- IRR
- -14.7%
- Equity multiple
- 0.46×
- Total profit
- $-40,632
- Equity at exit
- $40,258
- IRR
- -2.7%
- Equity multiple
- 0.80×
- Total profit
- $-14,891
- Equity at exit
- $23,345
Cash invested: $75,600 (down + closing). Projections, not guarantees.
Landlord ↔ Tenant lean methodology
- Overall (STATE)
- 55 Moderately Landlord-Leaning
- State Virginia
- 55 Moderately Landlord-Leaning · D+2
- County
- — inherits STATE
- City
- — inherits STATE
ZIP-level market 23669
- Rents YoY
- 5.4%
- Active inventory
- 235
- Price-to-rent
- 10.3×
Monthly cashflow live
- Estimated rent
- $2,177 high interval (Pro) →
- Mortgage (P&I)
- −$1,416
- Tax from tax record
- −$228 /mo · $2,736/yr
- Insurance
- −$112
- HOA
- −$0
- Vacancy / Maint / Mgmt
- −$457
- Net cashflow
- $-36
Break-even live
Sensitivity live
| Price | -10% $116 | -5% $40 | +0% $-36 | +5% $-113 | +10% $-189 |
|---|---|---|---|---|---|
| Rent | -10% $-208 | -5% $-122 | +0% $-36 | +5% $50 | +10% $136 |
| Rate | -1.0pp $100 | -0.5pp $32 | base $-36 | +0.5pp $-106 | +1.0pp $-178 |
UW: 25.0% down · 7.5% · 30yr · 1.5% tax · 5.0% vac · 8.0% maint · 8.0% mgmt
Financing live
Cash to close
- Down payment
- $67,500
- Closing costs
- $8,100
- Reserves months
- —
- Total cash needed
- —
Loan-product check · same deal, 3 products live
Conventional
25% down · 7.5% · 30yr
- Down + closing
- —
- Monthly P&I
- —
- Monthly cashflow
- —
- DSCR
- —
- Eligible?
- —
Personal DTI + credit; lowest rate.
DSCR
20% down · 8.5% · 30yr
- Down + closing
- —
- Monthly P&I
- —
- Monthly cashflow
- —
- DSCR
- —
- Eligible?
- —
No personal income docs; deal must DSCR.
Hard money
10% down · 12.0% · 12mo
- Down + closing
- —
- Monthly P&I
- —
- Monthly cashflow
- —
- DSCR
- —
- Eligible?
- —
Short-term bridge; refi at stabilization.
Rent comps 15 comps
| Address | Beds | Baths | Sqft | Rent | $/sqft | DOM | Units | Dist |
|---|---|---|---|---|---|---|---|---|
| 310 Lasalle Ave Hampton, VA | 3.0 | 2.0 | 1858 | $2,200 | $1.18 | 45d | 1 | 0.48mi |
| 180 Cherokee Rd Hampton, VA | 3.0 | 1.0 | 1600 | $2,000 | $1.25 | 0d | 1 | 0.56mi |
| 27 Capps Qtrs #1 Hampton, VA | 3.0 | 2.5 | 1734 | $2,200 | $1.27 | 45d | 1 | 0.81mi |
| 53 Shenandoah Rd Hampton, VA | 3.0 | 2.5 | 1767 | $2,395 | $1.36 | 0d | 1 | 0.82mi |
| 516 Homestead Ave Hampton, VA | 4.0 | 2.0 | 1129 | $1,995 | $1.77 | 0d | 1 | 0.91mi |
| 534 Brightwood Ave Hampton, VA | 3.0 | 3.0 | 1528 | $2,095 | $1.37 | 45d | 1 | 0.94mi |
| 426 Seminole Rd Hampton, VA | 4.0 | 2.5 | 2200 | $2,450 | $1.11 | 16d | 1 | 0.94mi |
| 607 Lee St Hampton, VA | 3.0 | 1.5 | 1404 | $2,150 | $1.53 | 45d | 1 | 1.08mi |
| 708 Westwood Ave Hampton, VA | 3.0 | 2.5 | 1300 | $2,300 | $1.77 | 16d | 1 | 1.10mi |
| 448 Chapel St Hampton, VA | 3.0 | 2.0 | 1425 | $1,850 | $1.30 | 5d | 1 | 1.12mi |
| 626 Chapel St Hampton, VA | 4.0 | 2.0 | 1470 | $1,900 | $1.29 | 14d | 1 | 1.21mi |
| 702 Rutherford St Hampton, VA | 3.0 | 2.0 | 1445 | $1,795 | $1.24 | 25d | 1 | 1.24mi |
| 901 W Queen St Hampton, VA | 2.0–3.0 | 1.5–2.5 | 1096 | $1,600 | $1.46 | 45d | 1 | 1.33mi |
| 130 Pocahontas Pl Hampton, VA | 3.0 | 1.0 | 1415 | $1,695 | $1.20 | 45d | 1 | 1.36mi |
| 100 Chesterfield Rd Hampton, VA | 3.0 | 1.5 | 1742 | $2,200 | $1.26 | 6d | 1 | 1.39mi |
Listing history 40 events
-
2026-06-21days on market $270,000 Active 73 DOM
-
2026-06-18days on market $270,000 Active 70 DOM
-
2026-06-17days on market $270,000 Active 69 DOM
-
2026-06-16days on market $270,000 Active 68 DOM
-
2026-06-15days on market $270,000 Active 67 DOM
-
2026-06-13days on market $270,000 Active 65 DOM
-
2026-06-13days on market $270,000 Active 64 DOM
-
2026-06-09days on market $270,000 Active 61 DOM
-
2026-06-08days on market $270,000 Active 60 DOM
-
2026-06-07days on market $270,000 Active 59 DOM
-
2026-06-03days on market $270,000 Active 55 DOM
-
2026-06-02days on market $270,000 Active 54 DOM
-
2026-06-01days on market $270,000 Active 53 DOM
-
2026-05-31days on market $270,000 Active 52 DOM
-
2026-05-06price $270,000 746-char remark
Show marketing remark (746 chars)
Closing cost assistance may be available. Contact listing agent for details. Welcome home to this beautifully updated 4-bedroom, 2-bathroom charmer located in the sought-after Sussex at Hampton neighborhood! This home features a newer roof, updated electrical and plumbing from 2021, and a recently installed HVAC system in 2023. The windows were also replaced for added efficiency. A stylish shed was added in 2017, and major utility upgrades include a new water line (2021) and sewer line (2017). Fresh interior paint just completed, giving the home a bright and clean feel throughout. Conveniently located near Hampton University, Downtown Hampton, and quick access to I-64. Don’t miss your chance—schedule your private tour today!
-
2026-04-09$260,000 Active 746-char remark
Show marketing remark (746 chars)
Closing cost assistance may be available. Contact listing agent for details. Welcome home to this beautifully updated 4-bedroom, 2-bathroom charmer located in the sought-after Sussex at Hampton neighborhood! This home features a newer roof, updated electrical and plumbing from 2021, and a recently installed HVAC system in 2023. The windows were also replaced for added efficiency. A stylish shed was added in 2017, and major utility upgrades include a new water line (2021) and sewer line (2017). Fresh interior paint just completed, giving the home a bright and clean feel throughout. Conveniently located near Hampton University, Downtown Hampton, and quick access to I-64. Don’t miss your chance—schedule your private tour today!
-
2025-08-10historical
-
2025-05-22$280,000 Active
-
2023-12-18historical
-
2023-12-15soldstatus $250,000 Closed
-
2023-12-04status Under Contract
-
2023-11-22historical Active Under Contract
-
2023-11-22status Pending
-
2023-11-16$250,000 Active
-
2023-11-16$250,000 Active
-
2021-11-24soldstatus $200,000
-
2021-11-24historical
-
2021-11-19soldstatus $200,000 Closed
-
2021-11-19soldstatus $200,000
-
2021-11-04status Under Contract
-
2021-10-14historical Active Under Contract
-
2021-10-14status Pending
-
2021-10-05$230,000 Active
-
2021-10-05$230,000
-
2021-10-05$230,000 Active
-
2016-10-26soldstatus $150,000
-
2016-09-14status Under Contract
-
2016-09-13historical
-
2016-08-09$150,000 Active
-
2006-05-10soldstatus $140,900
ⓘ Source: listings_history table (triggers on properties + properties_extension) + one-shot
backfill from property_details.listing_events for pre-trigger history.
Tax reassessment forecast VA · Resets to sale price
- Current annual tax
- $2,736 · $228/mo
- Projected year-2 tax
- $2,736 · $228/mo
- Expected delta
- $0/yr ($0/mo · 0.0%)
ⓘ Screening estimate from a state-policy table — verify with the county assessor before closing.
Climate risk First Street
- Flood 4/10 Moderate FEMA zone X (unshaded) · 13% chance over 30 yrs
- Wildfire 1/10 Low
- Heat 9/10 Extreme 7 d/yr ≥105°F today · 16 d/yr by 30 yrs out
- Wind 8/10 Severe 80% chance of damaging wind over 30 yrs
- Air quality 2/10 Low 1 unhealthy d/yr today · 1 by 30 yrs out
Nearby sold comps map
Loading sold comps map…
Walkable amenities ~0.75 mi
Loading nearby amenities…
Taxation est. · year 1
- Rental income
- $26,126
- − Mortgage interest
- −$15,124
- − Property taxes
- −$2,736
- − Insurance
- −$1,350
- − Repairs & maintenance
- −$2,090
- − Management
- −$2,090
- − Depreciation
- −$7,855
- Taxable loss
- −$5,119
- Est. tax savings @ 24.0%
- +$1,229
- After-tax cash flow
- $791/yr
For passive investors: Depreciation is non-cash, so a rental often shows a tax loss while cash-flowing — sheltering income. Rental losses are passive: they offset passive income freely, and up to $25,000/yr can offset ordinary (W-2) income if you actively participate and your MAGI is under $100k (phasing out to $0 by $150k); unused losses carry forward. On sale, claimed depreciation is recaptured at up to 25%, and gains may owe capital-gains tax (a 1031 exchange can defer both). Figures are a year-1 estimate at your 24.0% rate — not tax advice; consult a CPA.
Schools (NCES district)
- District
- Hampton City Public School District
- NCES district ID
- 5101800
- Math proficiency
- 60% ▼ -21.00%
- Reading proficiency
- 70% ▼ -4.00%
- Median HH income
- $50,089
- Composite
- 55.19/100
- National rank
- #1272
- State rank
- #40 of 131 in VA
Livability — Hampton
- Score
- 75/100
- State rank
- #133
- US rank
- #4302
Category grades
Schools grade is shown separately in the Schools card above.
Census & demographics
- Census place
- Hampton, VA
- County
- Hampton City · 132,421 people
- City population
- 132,421
- Metro
- Virginia Beach-Norfolk-Newport News, VA-NC
- Population (ZIP)
- 39,884
- Household income
- $71,222
- Rent vs Own
- Severe rent burden
- 2130.0
Population outlook (Hampton County) Hauer SSP2
- Today (2025)
- 134,055 people
- By 2030
- 131,753 · -1.7%
- By 2040
- 125,017 · -6.7%
- By 2050
- 116,825 · -12.9%
- By 2075
- 97,033 · -27.6%
- By 2100
- 76,188 · -43.2%
Race, ethnicity, and origin ACS 2023
- Neighborhood character
- Diverse neighborhood (Simpson 0.63)
- Race & ethnicity
- Black 46% White 39% Two or more races 9% Hispanic / Latino 6% Asian 2%
- Hispanic origin (detail)
- Mexican 1% Puerto Rican 2%
- Common ancestry
- Slovak 2% Italian 1% Romanian 1%
- Foreign-born
- 4% · Canada
- Languages at home
- 95% English-only · Spanish 3% Other Asian/Pacific 1%
Political lean MEDSL · Hampton
- 2024 margin
- Solid D (+39.9) · D 69.2% · R 29.4% · Other 1.4%
- 2008→2024 swing
- +1.0pp no change · 2008: 38.9pp · 2024: 39.9pp
- All cycles
- 2024: D+39.9 2020: D+42.2 2016: D+37.8 2012: D+45.4 2008: D+38.9
Not yet ingested
- Civics
- —
Market trends
- HPI YoY
- ▼ -150.40%
- Current HPI
- 276.4636
- Rent YoY
- ▲ 5.44%
- Metro
- Virginia Beach-Norfolk-Newport News, VA-NC
- State GDP YoY
- ▲ 2.40%
- F500 in state
- 50
Industry mix (Fortune 500 HQ in VA)
| Industry | F500 HQs | Revenue |
|---|---|---|
| Aerospace / Defense | 4 | $236B |
|
||
| Technology / Defense | 3 | $32B |
|
||
| Financial Services | 2 | $176B |
|
||
| Utilities | 2 | $27B |
|
||
| Insurance | 2 | $25B |
|
||
| Technology | 2 | $15B |
|
||
Price history
+91.6% since first listed26 events — show timeline
- 2026-05-06 Price Changed $270,000 REINMLS
- 2026-04-09 Listed $260,000 REINMLS
- 2025-08-10 Listing Removed — REINMLS
- 2025-05-22 Listed $280,000 REINMLS
- 2023-12-18 Listing Removed — REINMLS
- 2023-12-15 Sold (MLS) $250,000 WMLS
- 2023-12-04 Pending — REINMLS
- 2023-11-22 Contingent — REINMLS
- 2023-11-22 Pending — WMLS
- 2023-11-16 Listed $250,000 WMLS
- 2023-11-16 Listed $250,000 REINMLS
- 2021-11-24 Sold (Public Records) $200,000 Public Records
- 2021-11-24 Listing Removed — CVRMLS
- 2021-11-19 Sold (MLS) $200,000 WMLS
- 2021-11-19 Sold (MLS) $200,000 CVRMLS
- 2021-11-04 Pending — REINMLS
- 2021-10-14 Contingent — REINMLS
- 2021-10-14 Pending — CVRMLS
- 2021-10-05 Listed $230,000 REINMLS
- 2021-10-05 Listed $230,000 WMLS
- 2021-10-05 Listed $230,000 CVRMLS
- 2016-10-26 Sold (Public Records) $150,000 Public Records
- 2016-09-14 Pending — REINMLS
- 2016-09-13 Listing Removed — REINMLS
- 2016-08-09 Listed $150,000 REINMLS
- 2006-05-10 Sold (Public Records) $140,900 Public Records
Property tax history
+8.8%/yrLatest (2025): $2,736 · +9.6% YoY. Source: county tax records.
Cash-flow waterfall
monthlySold comps — $/sqft
last 12 mo · ≤1 miLoading sold comps…