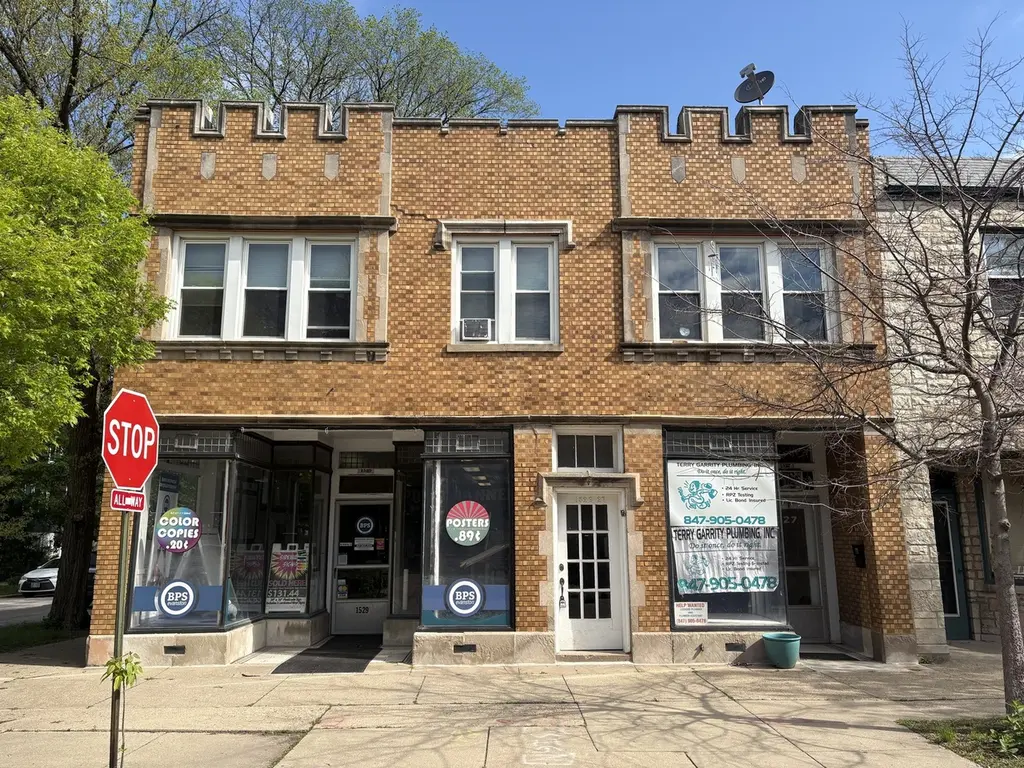
1529 Greenleaf St · Evanston, IL
Flood risk 1/10 · Minimal
- FEMA flood zone
- X (unshaded)
- Chance of flooding over 30 yrs
- 0.0%
- Est. flood insurance / yr
- $473 – $860
Fire risk 1/10 · Minimal
- Est. fire insurance / yr
- $804 – $1,492
Heat risk 2/10 · Minimal
- Hot days now (above 98°F)
- 7 days/yr
- Hot days in 30 yrs
- 14 days/yr
Wind risk 2/10 · Minimal
- Chance of severe wind over 30 yrs
- 0.0%
Air-quality risk 4/10 · Minor
- Unhealthy air days now
- 5 days/yr
- Unhealthy air days in 30 yrs
- 6 days/yr
Risk factors via First Street. Map © Google.
Why this score? — see what drove the F grade
The composite is a weighted blend of 9 inputs, each scored 0–100. Each bar is that input's sub-score; the figure is the points it added to the 100-point composite (weight × sub-score).
- ARV discount +7.5/15.0
- Schools +4.5/10.0
- Livability +4.2/5.0
- Rent growth +3.6/5.0
- Cash flow +2.5/30.0
- Condition / age +2.5/5.0
- 1% rule +0.0/10.0
- DSCR +0.0/10.0
- Appreciation +0.0/10.0
$895,000
🖨 Deal sheet 📄 Offer letter ✓ Due diligence
Listing remarks
OWNER-USER or INVESTOR OPPORTUNITY! Check out this 5-unit, mixed-use building located in the Arts District neighborhood! It is comprised of (2) commercial units, (2) 2-bed / 1-bath & (1) 1-bed / 1-bath apartment. The larger commercial unit with will be vacant at the end of May. That unit is approximately 1,650-SF. There is an unfinished basement. All of the apartments were freshly updated in 2017, all have in-unit washer / dryers and a shared outdoor space on the second floor. It currently generates $87,840 in gross income with the ability to increase rents in current condition. The windows were all replaced in 2017, water heaters were both replaced in the last 2 years, and the lower
Key facts
- Shared outdoor space
- Unfinished basement
- Windows replaced
Tags
Property features AI
Finance
- Other: Property listed as having 5 total units; Location note: located on the north side of Greenleaf Street near Florence Avenue
- Financial info: Total monthly income reported as $7,320; Gross income reported as $87,840; Gross rent multiplier reported as 10.2; Operating expense examples reported: water/sewer $965, electric $542, trash $391, insurance $3,550
- HOA & community: HOA information not provided
Exterior
- Parking: Parking details not provided
- Security: Security details not provided
- Utilities: Electric service on separate meters
- Home design: Mixed Use property; Built before 1978
- Construction: Year built: prior to 1978; Construction materials and roof/foundation details not provided
- Exterior features: Lot dimensions approximately 35 x 90
Interior
- Kitchen: Kitchen details not provided
- Bedrooms: Total of 5 residential units (bedroom counts per unit not provided)
- Flooring: Flooring details not provided
- Bathrooms: Bathroom details not provided
- Heating & cooling: Gas heating; Window air conditioning units
- Interior features: Mixed-use interior layout (residential and commercial spaces)
- Laundry & utility: Three washers on site; Three dryers on site; Washer/dryer are not leased
Neighborhood map
What this means for you Summary
Snapshot
- This is a 4-bed/4.0-bath condo listed at $895k.
Deal economics
- At list price, monthly cash flow is $-3k ($-37k/yr) — negative.
- To cash-flow at today's rent, offer at most $344k (61.6% below list).
- To meet the 1% rule (rent ≥ 1% of price), the offer needs to be $389k (56.5% below list).
- Recommended offer: $344k (61.6% below list) — sets the bar for cash-flow.
- Cap rate 2.1% vs local median 2.9% in Evanston — below-typical yield; the buyer is paying a premium for something (appreciation thesis, condition, location) that the cap rate doesn't capture.
Location & tenants
- Location reads 85/100 on livability (#26 in IL, #464 nationally) — a professional / high-income tenant draw. Strengths: amenities A+, commute A+, employment A+; Watch: cost of living F.
- Evanston Twp Hsd 202 (urban): math 47% / reading 52% proficiency, ranked #54 of 620 in IL (top 9%) — families likely to look elsewhere, expect single-tenant / working-renter base with shorter leases.
- Market conditions: Rents rising fast (+4.3%/yr); 72 active listings in the ZIP; 2 comparable units currently listed for rent nearby; solid renter incomes; 6,272 units permitted in Cook County in 2024 (4,658 in 5+ unit buildings).
- At $3,893/mo this rent would consume 47% of the median local household income ($99k/yr) (locally 784% of renters already pay >50% of income on rent) — very limited rent-growth headroom before tenants either downsize or default.
Forward outlook
- Local home prices are declining (-3.0%/yr); year-one equity from $6k of loan paydown is wiped out by about $27k of value loss. Plan a longer hold.
Negotiation context
- It's been on market 42 days — a 3% lower offer ($868k) is reasonable based on typical stale-listing flexibility.
- Current owner paid $300k; list at $895k implies a 198% gain — meaningful room to come down on a strong offer.
Risks & watch-outs
- Watch-outs: built in 1927 — expect roof / HVAC / electrical / plumbing capex.
Questions for the listing agent
- What do current leases actually rent for vs. the listed asking? Can we see a recent rent roll and the last 12 months of T-12 income?
- It's been on market 42 days. Have you received any prior offers? Is the seller open to a 62% concession, seller financing, or rate buy-down credit?
- Built in 1927 — when were the roof, HVAC, electrical panel, plumbing, and water heater last replaced?
- Any open or pending special assessments — roof, HVAC, plumbing, elevator, façade? What's the per-unit balance and payoff schedule, and is the seller paying it off at close or rolling it to the buyer?
- Is there a deadline driving the sale (1031 exchange, divorce, estate, relocation)? That informs how much negotiation room exists.
- Schools are A-rated — typically a magnet for longer-tenancy family renters. What's the average tenant stay here, and is there a school-zone premium baked into asking?
- The area grade is low — what's the realistic commute time and amenity access for the typical tenant pool here? Any planned neighborhood developments (good or bad) we should know about?
- What's the average days-on-market for RENTAL listings here right now (not sales)? A rising rental-DOM trend means longer vacancies and softer asking-rent achievability than the comps imply.
- What's the recent tenant-quality profile in this submarket — average credit score on applications, eviction rate, late-payment / NSF rate, and stable-employment percentage? A property-management company in the area should have these aggregated.
- How much new apartment / multifamily construction is in the pipeline within 1–3 miles? Heavy new supply (>2% of stock underway) typically softens rents 12–24 months out; light construction supports rent growth.
Investment metrics
- 1% rule
- 0.44% ✗
- Cap rate
- 2.11%
- Cash-on-cash
- -14.94%
- DSCR
- 0.34
- GRM
- 19.2
CMA / ARV
No comps found within radius.
Projected returns pro-forma
-3.0% appreciation · 4.35% rent growth · sell at horizon
- IRR
- -43.6%
- Equity multiple
- -0.35×
- Total profit
- $-338,336
- Equity at exit
- $133,447
- IRR
- -67.5%
- Equity multiple
- -1.11×
- Total profit
- $-527,644
- Equity at exit
- $77,383
Cash invested: $250,600 (down + closing). Projections, not guarantees.
Landlord ↔ Tenant lean methodology
- Overall (STATE)
- 43 Moderately Tenant-Leaning
- State Illinois
- 43 Moderately Tenant-Leaning · D+7
- County
- — inherits STATE
- City
- — inherits STATE
ZIP-level market 60202
- Rents YoY
- 4.3%
- Active inventory
- 72
- Price-to-rent
- 19.2×
Monthly cashflow live
- Estimated rent
- $3,893 medium interval (Pro) →
- Mortgage (P&I)
- −$4,693
- Tax from tax record
- −$1,130 /mo · $13,557/yr
- Insurance
- −$373
- HOA
- −$0
- Vacancy / Maint / Mgmt
- −$818
- Net cashflow
- $-3,120
Break-even live
UW: 25.0% down · 7.5% · 30yr · 1.5% tax · 5.0% vac · 8.0% maint · 8.0% mgmt
Financing live
Cash to close
- Down payment
- $223,750
- Closing costs
- $26,850
- Reserves months
- —
- Total cash needed
- —
Loan-product check · same deal, 3 products live
Conventional
25% down · 7.5% · 30yr
- Down + closing
- —
- Monthly P&I
- —
- Monthly cashflow
- —
- DSCR
- —
- Eligible?
- —
Personal DTI + credit; lowest rate.
DSCR
20% down · 8.5% · 30yr
- Down + closing
- —
- Monthly P&I
- —
- Monthly cashflow
- —
- DSCR
- —
- Eligible?
- —
No personal income docs; deal must DSCR.
Hard money
10% down · 12.0% · 12mo
- Down + closing
- —
- Monthly P&I
- —
- Monthly cashflow
- —
- DSCR
- —
- Eligible?
- —
Short-term bridge; refi at stabilization.
Rent comps 2 comps
| Address | Beds | Baths | Sqft | Rent | $/sqft | DOM | Units | Dist |
|---|---|---|---|---|---|---|---|---|
| 1217 Ridge Ave Evanston, IL | 5.0 | 5.5 | 7000 | $11,000 | $1.57 | 12d | 1 | 0.35mi |
| 8734 Kimball Ave #1 Skokie, IL | 3.0 | 3.0 | 4000 | $4,500 | $1.12 | 24d | 1 | 1.02mi |
HOA detail condo
- Monthly dues
- $0 · $0/yr
- Likely covers
- water
- Assessments
- None detected in remarks — confirm with the listing agent.
Listing history 17 events
-
2026-06-18days on market $895,000 Active 42 DOM
-
2026-06-17days on market $895,000 Active 41 DOM
-
2026-06-16days on market $895,000 Active 40 DOM
-
2026-06-15days on market $895,000 Active 39 DOM
-
2026-06-13days on market $895,000 Active 37 DOM
-
2026-06-09days on market $895,000 Active 33 DOM
-
2026-06-08days on market $895,000 Active 32 DOM
-
2026-06-07days on market $895,000 Active 31 DOM
-
2026-06-04days on market $895,000 Active 28 DOM
-
2026-06-03days on market $895,000 Active 27 DOM
-
2026-06-02days on market $895,000 Active 26 DOM
-
2026-06-01days on market $895,000 Active 25 DOM
-
2026-05-31days on market $895,000 Active 24 DOM
-
2017-03-14soldstatus $300,000
-
2015-09-11historical
-
2015-06-16New
-
1977-01-03soldstatus $70,000
ⓘ Source: listings_history table (triggers on properties + properties_extension) + one-shot
backfill from property_details.listing_events for pre-trigger history.
Tax reassessment forecast IL · Partial reset (capped growth)
- Current annual tax
- $13,557 · $1,130/mo
- Projected year-2 tax
- $16,937 · $1,411/mo
- Expected delta
- +$3,380/yr (+$282/mo · 24.9%)
ⓘ Screening estimate from a state-policy table — verify with the county assessor before closing.
Climate risk First Street
- Flood 1/10 Low FEMA zone X (unshaded) · 0% chance over 30 yrs
- Wildfire 1/10 Low
- Heat 2/10 Low 7 d/yr ≥98°F today · 14 d/yr by 30 yrs out
- Wind 2/10 Low 0% chance of damaging wind over 30 yrs
- Air quality 4/10 Moderate 5 unhealthy d/yr today · 6 by 30 yrs out
Nearby sold comps map
Loading sold comps map…
Walkable amenities ~0.75 mi
Loading nearby amenities…
Taxation est. · year 1
- Rental income
- $46,722
- − Mortgage interest
- −$50,134
- − Property taxes
- −$13,557
- − Insurance
- −$4,475
- − Repairs & maintenance
- −$3,738
- − Management
- −$3,738
- − Depreciation
- −$26,036
- Taxable loss
- −$54,956
- Est. tax savings @ 24.0%
- +$13,189
- After-tax cash flow
- $-24,254/yr
For passive investors: Depreciation is non-cash, so a rental often shows a tax loss while cash-flowing — sheltering income. Rental losses are passive: they offset passive income freely, and up to $25,000/yr can offset ordinary (W-2) income if you actively participate and your MAGI is under $100k (phasing out to $0 by $150k); unused losses carry forward. On sale, claimed depreciation is recaptured at up to 25%, and gains may owe capital-gains tax (a 1031 exchange can defer both). Figures are a year-1 estimate at your 24.0% rate — not tax advice; consult a CPA.
Schools (NCES district)
- District
- Evanston Twp Hsd 202
- NCES district ID
- 1714490
- Math proficiency
- 47% ▼ -3.00%
- Reading proficiency
- 52% ▬ 0.00%
- Median HH income
- $72,672
- Composite
- 44.52/100
- National rank
- #2794
- State rank
- #54 of 620 in IL
Livability — Evanston
- Score
- 85/100
- State rank
- #26
- US rank
- #464
Category grades
Schools grade is shown separately in the Schools card above.
Census & demographics
- Census place
- Evanston, IL
- County
- Cook County · 4,486,803 people
- City population
- 76,085
- Metro
- Chicago-Naperville-Elgin, IL-IN-WI
- Population (ZIP)
- 32,341
- Household income
- $98,989
- Rent vs Own
- Severe rent burden
- 784.0
Population outlook (Cook County) Hauer SSP2
- Today (2025)
- 5,347,519 people
- By 2030
- 5,357,703 · +0.2%
- By 2040
- 5,324,924 · -0.4%
- By 2050
- 5,230,762 · -2.2%
- By 2075
- 4,785,735 · -10.5%
- By 2100
- 4,188,836 · -21.7%
Race, ethnicity, and origin ACS 2023
- Neighborhood character
- Diverse neighborhood (Simpson 0.65)
- Race & ethnicity
- White 54% Black 18% Hispanic / Latino 14% Two or more races 11% Asian 8%
- Hispanic origin (detail)
- Mexican 8%
- Common ancestry
- Romanian 8% Scotch-Irish 2% Portuguese 2%
- Foreign-born
- 19% · Canada, Jamaica, Vietnam
- Languages at home
- 73% English-only · Spanish 11% Other Indo-European 3% Russian/Polish/Slavic 2%
Political lean MEDSL · Cook
- 2024 margin
- Solid D (+42.0) · D 70.4% · R 28.4% · Other 1.2%
- 2008→2024 swing
- -11.4pp toward R · 2008: 53.4pp · 2024: 42.0pp
- All cycles
- 2024: D+42.0 2020: D+50.3 2016: D+53.0 2012: D+49.4 2008: D+53.4
Not yet ingested
- Civics
- —
Market trends
- HPI YoY
- ▼ -245.25%
- Current HPI
- 172.9605
- Rent YoY
- ▲ 4.35%
- Metro
- Chicago-Naperville-Elgin, IL-IN-WI
- State GDP YoY
- ▲ 1.59%
- F500 in state
- 60
Industry mix (Fortune 500 HQ in IL)
| Industry | F500 HQs | Revenue |
|---|---|---|
| Insurance | 4 | $201B |
|
||
| Consumer Goods | 4 | $87B |
|
||
| Industrial Machinery | 3 | $64B |
|
||
| Healthcare | 2 | $55B |
|
||
| Retail / Pharmacy | 1 | $148B |
|
||
| Agriculture / Food | 1 | $86B |
|
||
Price history
+328.6% since first listed4 events — show timeline
- 2017-03-14 Sold (Public Records) $300,000 Public Records
- 2015-09-11 Listing Removed — MRED as Distributed by MLS Grid
- 2015-06-16 Listed — MRED as Distributed by MLS Grid
- 1977-01-03 Sold (Public Records) $70,000 Public Records
Property tax history
-0.1%/yrLatest (2023): $13,557 · +4.2% YoY. Source: county tax records.
Cash-flow waterfall
monthlySold comps — $/sqft
last 12 mo · ≤1 miLoading sold comps…