 🏗️ New Construction
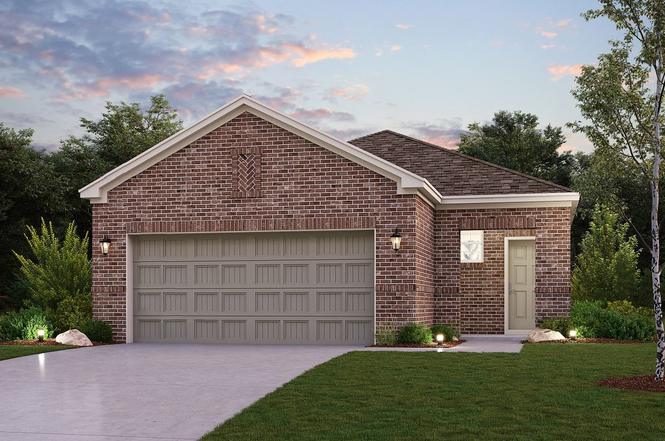
4019 Ancient Honor Dr · Brookshire, TX
Flood risk 1/10 · Minimal
- FEMA flood zone
- X (unshaded)
- Chance of flooding over 30 yrs
- 0.0%
- Est. flood insurance / yr
- $507 – $1,088
Fire risk 5/10 · Moderate
- Est. fire insurance / yr
- $1,222 – $2,270
Heat risk 8/10 · Major
- Hot days now (above 111°F)
- 7 days/yr
- Hot days in 30 yrs
- 22 days/yr
Wind risk 9/10 · Severe
- Chance of severe wind over 30 yrs
- 99.0%
Air-quality risk 2/10 · Minimal
- Unhealthy air days now
- 1 days/yr
- Unhealthy air days in 30 yrs
- 1 days/yr
Risk factors via First Street. Map © Google.
Why this score? — see what drove the D- grade
The composite is a weighted blend of 9 inputs, each scored 0–100. Each bar is that input's sub-score; the figure is the points it added to the 100-point composite (weight × sub-score).
- Cash flow +10.5/30.0
- ARV discount +7.5/15.0
- Schools +4.6/10.0
- Livability +3.1/5.0
- DSCR +3.0/10.0
- Condition / age +2.5/5.0
- 1% rule +2.3/10.0
- Rent growth +2.2/5.0
- Appreciation +0.0/10.0
$274,900
🖨 Deal sheet (PDF) 📄 Offer letter ✓ Due diligence
Listing remarks
CORNER LOT HOME! The Aspen - With 1388 Square feet, the Aspen plan is a 3 bedroom/2 bath and offers ample space. 42" cabinets, stainless steel appliances, Whirlpool 5 burner gas range, microwave oven, and dishwasher are some of the features this home offers. Wait until you see the luxurious 5' tiled walk-in shower in the primary bedroom! With ceiling fans in the primary bedroom and great room, you'll stay cool and comfortable all year round. The tankless water heater, garage door opener, blinds, and keyless entry add extra convenience to your daily life. Call to schedule your private tour of this home.
Key facts
- Microwave oven
- Dishwasher
- Ceiling fans
Tags
Neighborhood map
What this means for you Summary
Snapshot
- This is a 3-bed/2.0-bath land listed at $275k.
Deal economics
- At list price, monthly cash flow is $-139 ($-2k/yr) — negative.
- To cash-flow at today's rent, offer at most $250k (8.9% below list).
- To meet the 1% rule (rent ≥ 1% of price), the offer needs to be $201k (27.0% below list).
- Recommended offer: $201k (27.0% below list) — sets the bar for 1% rule.
Location & tenants
- Location reads 62/100 on livability (#960 in TX) — a middle-class / working-renter tenant base. Strengths: cost of living A+, housing A+; Watch: crime D-, amenities F, commute F.
- Lamar CISD (suburban): math 50% / reading 53% proficiency, ranked #116 of 826 in TX (top 14%) — acceptable for families but not a draw, mixed tenant base, ~2y average lease.
- Zoned schools: Dean Leaman J H School (math 59% / reading 56%, grade B, #206 of 1,662 statewide, top 13%, 2,191 students, 32% FRL); Fulshear H S (math 52% / reading 70%, grade C+, #258 of 1,632 statewide, top 16%, 2,464 students, 30% FRL).
- Market conditions: Rents soft (-1.0%/yr); 997 active listings in the ZIP; solid renter incomes; 12,093 units permitted in Fort Bend County in 2024 (815 in 5+ unit buildings).
Forward outlook
- Local home prices are declining (-3.0%/yr); year-one equity from $2k of loan paydown is wiped out by about $8k of value loss. Plan a longer hold.
- Fort Bend County population projected at +75% by 2050 — long-run rental-demand tailwind backs the buy-and-hold thesis.
Negotiation context
- It's been on market 51 days — a 3% lower offer ($267k) is reasonable based on typical stale-listing flexibility.
Risks & watch-outs
- Climate carrying-cost: severe wind risk, 99% chance of damaging wind over 30y; moderate wildfire risk; extreme-heat days projected 7→22/yr by 2055 (HVAC capex compounding) — expect insurance premiums to compound above CPI over the hold.
Questions for the listing agent
- What do current leases actually rent for vs. the listed asking? Can we see a recent rent roll and the last 12 months of T-12 income?
- It's been on market 51 days. Have you received any prior offers? Is the seller open to a 27% concession, seller financing, or rate buy-down credit?
- What does the HOA fee cover, when was the last increase, and are there any pending special assessments or reserve-fund shortfalls?
- Is there a deadline driving the sale (1031 exchange, divorce, estate, relocation)? That informs how much negotiation room exists.
- Schools are F-rated, which usually means shorter tenancies and higher turnover. Who's the typical renter profile here, and what's been the actual vacancy rate?
- Crime grade is D in this area — have there been break-ins, vandalism, or insurance claims at this property in the last 3 years? What carrier currently insures it and at what premium?
- The area grade is low — what's the realistic commute time and amenity access for the typical tenant pool here? Any planned neighborhood developments (good or bad) we should know about?
- What's the average days-on-market for RENTAL listings here right now (not sales)? A rising rental-DOM trend means longer vacancies and softer asking-rent achievability than the comps imply.
- What's the recent tenant-quality profile in this submarket — average credit score on applications, eviction rate, late-payment / NSF rate, and stable-employment percentage? A property-management company in the area should have these aggregated.
- How much new for-sale + rental construction is in the pipeline within 1–3 miles? Heavy new supply typically softens prices + rents 12–24 months out; constrained supply supports both.
Investment metrics
- 1% rule
- 0.73% ✗
- Cap rate
- 5.69%
- Cash-on-cash
- -2.16%
- DSCR
- 0.90
- GRM
- 11.4
CMA / ARV
No comps found within radius.
Projected returns pro-forma
-3.0% appreciation · 0.0% rent growth · sell at horizon
- IRR
- -23.0%
- Equity multiple
- 0.23×
- Total profit
- $-59,335
- Equity at exit
- $40,988
- IRR
- -26.7%
- Equity multiple
- -0.12×
- Total profit
- $-86,081
- Equity at exit
- $23,768
Cash invested: $76,972 (down + closing). Projections, not guarantees.
Landlord ↔ Tenant lean methodology
- Overall (STATE)
- 87 Strongly Landlord-Friendly
- State Texas
- 87 Strongly Landlord-Friendly · R+5
- County
- — inherits STATE
- City
- — inherits STATE
ZIP-level market 77423
- Rents YoY
- -1.0%
- Active inventory
- 997
- Price-to-rent
- 11.4×
Monthly cashflow live
- Estimated rent
- $2,007 medium interval (Pro) →
- Mortgage (P&I)
- −$1,442
- Tax from tax record
- −$105 /mo · $1,258/yr
- Insurance
- −$115
- HOA
- −$63
- Vacancy / Maint / Mgmt
- −$421
- Net cashflow
- $-139
Break-even live
Sensitivity live
| Price | -10% $17 | -5% $-61 | +0% $-139 | +5% $-216 | +10% $-294 |
|---|---|---|---|---|---|
| Rent | -10% $-297 | -5% $-218 | +0% $-139 | +5% $-59 | +10% $20 |
| Rate | -1.0pp $0 | -0.5pp $-69 | base $-139 | +0.5pp $-210 | +1.0pp $-282 |
UW: 25.0% down · 7.5% · 30yr · 1.5% tax · 5.0% vac · 8.0% maint · 8.0% mgmt
Financing live
Cash to close
- Down payment
- $68,725
- Closing costs
- $8,247
- Reserves months
- —
- Total cash needed
- —
Loan-product check · same deal, 3 products live
Conventional
25% down · 7.5% · 30yr
- Down + closing
- —
- Monthly P&I
- —
- Monthly cashflow
- —
- DSCR
- —
- Eligible?
- —
Personal DTI + credit; lowest rate.
DSCR
20% down · 8.5% · 30yr
- Down + closing
- —
- Monthly P&I
- —
- Monthly cashflow
- —
- DSCR
- —
- Eligible?
- —
No personal income docs; deal must DSCR.
Hard money
10% down · 12.0% · 12mo
- Down + closing
- —
- Monthly P&I
- —
- Monthly cashflow
- —
- DSCR
- —
- Eligible?
- —
Short-term bridge; refi at stabilization.
HOA detail
- Monthly dues
- $63 · $756/yr
- Likely covers
- watergaspool
Listing history 3 events
-
2025-10-16status Pending
-
2025-09-23price $274,900
-
2025-08-26$280,900 Active
ⓘ Source: listings_history table (triggers on properties + properties_extension) + one-shot
backfill from property_details.listing_events for pre-trigger history.
Tax reassessment forecast TX · Resets to sale price
- Current annual tax
- $1,258 · $105/mo
- Projected year-2 tax
- $5,031 · $419/mo
- Expected delta
- +$3,773/yr (+$314/mo · 300.0%)
ⓘ Screening estimate from a state-policy table — verify with the county assessor before closing.
Climate risk First Street
- Flood 1/10 Low FEMA zone X (unshaded) · 0% chance over 30 yrs
- Wildfire 5/10 Major
- Heat 8/10 Severe 7 d/yr ≥111°F today · 22 d/yr by 30 yrs out
- Wind 9/10 Extreme 99% chance of damaging wind over 30 yrs
- Air quality 2/10 Low 1 unhealthy d/yr today · 1 by 30 yrs out
Nearby sold comps map
Loading sold comps map…
Walkable amenities ~0.75 mi
Loading nearby amenities…
Taxation est. · year 1
- Rental income
- $24,081
- − Mortgage interest
- −$15,399
- − Property taxes
- −$1,258
- − Insurance
- −$1,374
- − Repairs & maintenance
- −$1,926
- − Management
- −$1,926
- − HOA
- −$756
- − Depreciation
- −$7,997
- Taxable loss
- −$6,556
- Est. tax savings @ 24.0%
- +$1,573
- After-tax cash flow
- $-90/yr
For passive investors: Depreciation is non-cash, so a rental often shows a tax loss while cash-flowing — sheltering income. Rental losses are passive: they offset passive income freely, and up to $25,000/yr can offset ordinary (W-2) income if you actively participate and your MAGI is under $100k (phasing out to $0 by $150k); unused losses carry forward. On sale, claimed depreciation is recaptured at up to 25%, and gains may owe capital-gains tax (a 1031 exchange can defer both). Figures are a year-1 estimate at your 24.0% rate — not tax advice; consult a CPA.
Schools (NCES district)
- District
- Lamar CISD
- NCES district ID
- 4826580
- Math proficiency
- 50% ▼ -12.00%
- Reading proficiency
- 53% ▼ -4.00%
- Median HH income
- $75,213
- Composite
- 46.43/100
- National rank
- #2452
- State rank
- #116 of 826 in TX
Livability — Brookshire
- Score
- 62/100
- State rank
- #960
- US rank
- #17059
Category grades
Schools grade is shown separately in the Schools card above.
Census & demographics
- County
- Waller County · 18,767 people
- Metro
- Houston-The Woodlands-Sugar Land, TX
- Population (ZIP)
- 18,767
- Household income
- $84,490
- Rent vs Own
- Severe rent burden
- 20.0
Population outlook (Fort Bend County) Hauer SSP2
- Today (2025)
- 1,004,526 people
- By 2030
- 1,153,104 · +14.8%
- By 2040
- 1,453,718 · +44.7%
- By 2050
- 1,753,781 · +74.6%
- By 2075
- 2,455,772 · +144.5%
- By 2100
- 2,930,528 · +191.7%
Race, ethnicity, and origin ACS 2023
- Neighborhood character
- Diverse neighborhood (Simpson 0.64)
- Race & ethnicity
- Hispanic / Latino 41% White 41% Black 14% Two or more races 13% Asian 2% Native American 1%
- Hispanic origin (detail)
- Mexican 30% Cuban 2%
- Common ancestry
- Lithuanian 2% Italian 2% Slovak 1%
- Foreign-born
- 17% · Canada, China, Dominican Republic
- Languages at home
- 65% English-only · Spanish 32% French/Haitian/Cajun 1% Other Indo-European 1%
Political lean MEDSL · Fort Bend
- 2024 margin
- Toss-up / Even · D 49.5% · R 47.9% · Other 2.6%
- 2008→2024 swing
- +4.0pp toward D · 2008: -2.4pp · 2024: 1.6pp
- All cycles
- 2024: D+1.6 2020: D+10.6 2016: D+6.6 2012: R+6.8 2008: R+2.4
Not yet ingested
- Civics
- —
Market trends
- HPI YoY
- ▼ -125.28%
- Current HPI
- 204.8709
- Rent YoY
- ▼ -1.01%
- Metro
- Houston-The Woodlands-Sugar Land, TX
- State GDP YoY
- ▲ 3.95%
- F500 in state
- 110
Industry mix (Fortune 500 HQ in TX)
| Industry | F500 HQs | Revenue |
|---|---|---|
| Energy | 16 | $1,198B |
|
||
| Technology | 5 | $198B |
|
||
| Engineering / Construction | 4 | $72B |
|
||
| Energy Services | 3 | $60B |
|
||
| Utilities | 3 | $41B |
|
||
| Healthcare | 2 | $330B |
|
||
Price history
-2.1% since first listed3 events — show timeline
- 2025-10-16 Pending — HARMLS
- 2025-09-23 Price Changed $274,900 HARMLS
- 2025-08-26 Listed $280,900 HARMLS
Cash-flow waterfall
monthlySold comps — $/sqft
last 12 mo · ≤1 miLoading sold comps…